Performance of the Continuous Performance Test
Among Community Samples
by Wei J. Chen, Chuhsing K. Hsiao, Ii-Iing Hsiao, and Hai'Qwo Hwu
Abstract
The Continuous Performance Test (CPT) has been modified to be used widely as a potential vulnerability marker of schizophrenia. In genetic analyses of schizo-phrenia, well-established norms for the CPT are essen-tial in choosing a suitable threshold of CPT for classi-fying subjects as affected or unaffected. In this study, we investigated the performance of 115 adolescents and 345 adults, randomly sampled from a community, on two sessions of the CPT 1-9 (undegraded and 25% degraded). The results showed that an older age was associated with a decreasing hit rate and sensitivity (d'), while a higher level of education was associated with an increasing hit rate and d' for both sessions of the CPT. Men had higher hit rates and d' than women for the degraded CPT. A practice effect during the sec-ond session of the CPT was noted among 20 to 33 per-cent of the subjects. Poorer CPT performance was associated with schizotypy measured by the Perceptual Aberration Scale and the Schizotypal Personality Questionnaire. Thus, in assessing CPT performance among schizophrenia patients or high-risk popula-tions, we must compare their results to age-, educa-tion-, and sex-corresponding norms. The data pre-sented in this report will be valuable hi this regard.
Key words: Attention, Continuous Performance Test
Schizophrenia Bulletin, 24(1): 163-174,1998.
The Continuous Performance Test (CPT), first designed for measuring deficits in sustained attention among brain-injured patients (Rosvold et al. 1956), has been modified to be used widely in studies of schizophrenia (Nuechterlein 1991). During the test, subjects are pre-sented with a series of short-duration stimuli that appear at a rapid fixed rate. They respond by pressing a button each time a predesignated target stimulus appears.
However, CPT performance depends heavily on the test format. The CPT-X (single character or number as target) is a simultaneous discrimination vigilance task, whereas the CPT—AX (a character or number preceded by another character or number as a target) involves a short-term memory component and is a successive discrimination vigilance task. The information process load of the CPT-AX is thus higher than that of the CPT-X. If the stimulus is blurred during testing (degraded CPT) (Nuechterlein 1983) or a relative target is designated (CPT-Identical Pairs Version, or CPT-IP) (Cornblatt et al. 1988), the difficulty level is raised further.
The performance indices of the CPT have also evolved from the hit rate or the false alarm rate alone to indices derived from signal detection theory. Sensitivity refers to an individual's ability to discriminate target stim-uli from nontarget stimstim-uli, while the response criterion measures the amount of perceptual evidence a person requires to decide that a stimulus is a target (Swets 1973). Both were estimated from a joint consideration of both the hit rate and the false alarm rate. If a person adopts a less stringent response criterion, the hit rate will increase while the false alarm rate increases at the same time. Sensitivity is relatively free from motivational effects (Swets and Sewall 1963), which would be reflected in the response criterion instead.
Schizophrenia patients who are chronically hospital-ized (Orzack and Kometsky 1966) and remitted and on medication (Asarnow and MacCrimmon 1978) or off medication (Wohlberg and Kornetsky 1973) have been found to have deficits on the traditional CPT-X and CPT-AX. However, some researchers have found that the impact of drug withdrawal on CPT performance of schiz-ophrenia patients could be detected only by the degraded CPT (Nestor et al. 1991). hi comparing children of
moth-Reprint requests should be sent to Dr. WJ. Chen, Graduate Institute of Epidemiology, College of Public Health, National Taiwan University, 1 Jen-Ai Rd., Sec. 1, Taipei 100, Taiwan.
ers with schizophrenia to children of healthy mothers, studies using the CPT-X or CPT-AX did not find signifi-cant differences (Asamow et al. 1977; Cohler et al. 1977; Herman et al. 1977; Cornblatt and Erlenmeyer-Kimling 1984). Only studies using a more difficult CPT could detect deficits in the children of mothers with schizophre-nia (Rutschmann et al. 1977; Nuechterlein et al. 1983; Comblatt and Erlenmeyer-Kimling 1985). Adult nonpsy-chotic relatives of schizophrenia patients, however, have been found to have deficits on the degraded CPT (Grove et al. 1991) or both the undegraded and degraded CPT (Mirsky et al. 1995&). These studies indicate that a deficit on the high processing load forms of the CPT might be a vulnerability marker of schizophrenia.
Finding CPT differences between relatives of schizo-phrenia patients and normal controls alone, however, does not necessarily make the measure useful in a genetic analysis of schizophrenia. For example, diagnostic accu-racy, especially specificity, can considerably affect the power to detect linkage (Faraone et al. 1995). A cut off point that leads to a higher ratio of prevalence among patients versus the general population would be more powerful (Risch 1990). Thus, a well-established norm for the CPT is essential when choosing a suitable threshold for classifying subjects as affected or unaffected. However, most previous studies have examined only a limited number of normal subjects matched to patients. Subjects were thus of limited range for age and education (e.g., Nuechterlein 1983; Mirsky et al. 1991). Only two previous studies have been specifically conducted among normal populations. One, applying the undegraded CPT-X, examined 435 children in the first and second grade (Mirsky et al. 1991), while the other, applying the CPT—IP, was conducted among 120 related subjects (Cornblatt et al. 1988).
In this study we investigated the CPT performance of 115 adolescents and 345 adults randomly sampled from a community. Two versions of the CPT, undegraded 1-9 task and 25 percent degraded 1-9 task, were administered. The effect of sex, age, and education on CPT performance and the relationship between CPT performance and schizotypal personality features were then evaluated.
Methods
Subjects. Two groups of subjects, adolescents and adults, were sampled from Chinshan Township, a 60-minute drive north of Taipei. The population of the town-ship was about 18,000 in 1993. In 1994 a systematic sam-pling was carried out from a list of students in all classes of the Chinshan Junior High School, which is the only one of its kind in the township. One of every 10 students
from 27 classes was selected. Out of 1,178 students, 118 were sampled. Only three students failed to complete the test (one was absent and two transferred to other schools).
For the adults, two waves of sampling were per-formed. Initially, we conducted a systematic sampling from die 1993 voter lists of Chinshan Township. Since all citizens who are eligible to vote in Taiwan are listed auto-matically by local household registration offices, the voter list is representative of the general population. Four of 14 villages were excluded from the sampling because they were located in mountain areas. One of every 20 eligible voters was selected. Subjects older than 65 years were excluded because of the concern that they might have chronic illnesses that would affect CPT performance. Using these parameters, 478 subjects were selected. However, because many subjects on the voter list did not reside in the Chinshan area, a similar sampling method was applied to the 1994 voter lists from six villages. The voter lists of the remaining four villages were not avail-able at the time of sampling for administrative reasons. An additional 402 subjects were selected this way. Among the total of 880 adult subjects, 215 did not live in Chinshan and 102 could not be located. For the remaining 563 subjects who could be contacted either by telephone, mail, or a direct home visit, 365 (64.8%) were success-fully interviewed. There were various reasons for non-completion: 120 (60.9%) failed to show up for the appointment; 50 (25.4%) refused to take the test (5 of them had a diagnosis of schizophrenia and 1 had a diag-nosis of manic-depressive psychosis, according to the out-patient records at Chinshan Health Station); 23 (11.7%) were in military service; 4 (2.0%) were overseas fishing; and 1 remained silent during the interview. Among the 365 adult subjects who completed the questionnaire, 11 subjects (1 had a diagnosis of schizophrenia and 1 had a history of stroke) did not participate in CPT testing, and 7 subjects refused to perform the degraded session after fin-ishing the undegraded one. Two of the remaining subjects were excluded from this study because of a diagnosis of either schizophrenia or stroke. Overall, 345 adult subjects who did not have a diagnosis of psychosis or stroke and completed both the undegraded and the degraded CPT were included for analysis.
Test Procedures. All participating subjects completed a questionnaire and two CPT sessions, after informed writ-ten consent was obtained. The adolescents were inter-viewed and tested in the Health Care Room at the Chinshan Junior High School. The adults were inter-viewed in an examining room at the Chinshan Health Station to avoid possible interference from the surround-ing environment. The questionnaire was composed of
Performance of the Continuous Performance Test Schizophrenia Bulletin, Vol. 24, No. 1,1998
demographic features, a handedness assessment, 12 ques-tions from the Chinese Health Questionnaire (CHQ; Cheng and Williams 1986), 35 questions from the Perceptual Aberration Scale (PAS; Chapman et al. 1978), and 74 questions from the Schizotypal Personality Questionnaire (SPQ; Raine 1991). The answers to the questions from the three scales were either yes or no. The three parts were intermingled to minimize the potential offensiveness of some questions regarding aberrations in bodily perception. If the subjects could not read or chose not to read themselves, they were questioned by the inter-viewers.
CPT. We used a CPT machine from Sunrise Sys-tems, v. 2.20 (Pembroke, MA, USA), which is based on the work of Dr. Allan Mirsky's laboratory (Mirsky et al. 1991). The machine is composed of the Stimulus/ Response Unit containing a microprocessor with associ-ated stimulus generation and response acquisition and a driver program that operates on an IBM-compatible lap-top computer. Subjects' responses were recorded automat-ically on diskette. Visual stimuli were presented on a 2-inch-square matrix of green light-emitting diodes (LEDs), 21 dots high by 20 dots wide. The display was refreshed at 189 frames peT second. Numbers between 0 and 9 were randomly presented for 50 milliseconds (ms) each, at a rate of one per second. Available response time was 700 ms and the probability of critical stimulus was set at 10 percent The interstimulus interval was not randomized.
Each subject undertook two CPT sessions: the unde-graded 1—9 task and the deunde-graded 1—9 task. During the undegraded session, subjects responded to the target stim-ulus (the number 9 preceded by the number 1) by pressing a button. A total of 331 trials, 31 of them targets, were presented over 5 minutes. During the degraded session, a pattern of snow was used to toggle background and fore-ground dots so that the image was not distinct We chose 25 percent masking for this session after preliminary trials indicated that beyond this masking level more than half the subjects refused to continue. Each session of the test began with 2 minutes of practice (repeated if subjects required it). The rater monitored subjects' performance through the computer monitor and made sure that they knew how to press the button correctly.
The signal-detection indices of CPT performance were derived from the hit rate (probability of response to target trials) and the false alarm rate (probability of response to nontarget trials) (Swets 1973; Nuechterlein 1991). The sensitivity index, d', was calculated as z{h) — z(f), where z denotes normal deviate, h denotes hit rate, a n d / denotes false alarm rate. If there were perfect hits or zero false alarms, d' was calculated as 2r^' and 1 - T^n, where s denotes number of target trials and n denotes the
number of nontarget trials (Davies and Parasuraman 1982). The response criterion index, lnfi, was computed as In {y [z (h)]/y[z (/)]}, where y is the ordinate of the normal distribution. Variables extraneous to the intended comparison (d'), such as differences in motivation or in cooperativeness between the groups, would yield differ-ences in the response criterion rather than in d'.
In a test-retest reliability study of the versions of CPT used in this study, 10 schizophrenia and 10 nonpsy-chotic inpatients admitted to the psychiatric ward of National Taiwan University Hospital, and 10 normal age-and sex-matched control subjects recniited from hospital employees and students were administered the CPT twice, 1 week apart The intraclass correlation coefficient relia-bilities (ICCRs) of CPT performance indices were reported for all subjects together because this made the range of variation large enough to make a stable estimate. The impact of illness on the reliability of the CPT was presumably minimal in such a short period of time. The ICCRs of the performance indices for the degraded and 25 percent degraded CPT were, respectively, 0.89 and 0.81 for the hit rate, 0.37 and 0.52 for the false alarm rate, 0.83 and 0.82 for d', and 0.49 and 0.72 for ln^. The rela-tively low ICCRs for the false alarm rate might be due to the limited range of the false alarm rate among the sam-ple. The test-retest variability of the response criterion was greater than that of the sensitivity of the CPT, which is consistent with a previous report (Comblart et al. 1988). Questionnaire. CHQ is a self-administered screen-ing instrument used to identify nonpsychotic psychiatric disorders in community settings. The version used in this study is composed of 12 items derived from the original 60 items via a series of discriminant function analysis (Cheng and Williams 1986). It has been tested and applied in surveys of minor psychiatric morbidity in com-munities (Cheng and Williams 1986) and patients admit-ted for general health screening (Chong and Wilkinson 1989). The original 4-point scale was condensed into a 2-point scale to be intermingled with questions from SPQ and PAS.
The PAS is a 35-item, true-false self-report measure of a variety of nonpsychotic body-image and perceptual distortions (Chapman et al. 1978). Internal consistency analyses revealed coefficient alphas around 0.90 and test-retest correlation of 0.75 (Chapman and Chapman 1985). College students with high scores on PAS were found to have higher risk of schizotypal-related symptoms 10 years later (Chapman et al. 1994).
The SPQ is a 74-item self-report scale based on DSM-///-K (American Psychiatric Association 1987) cri-teria for schizotypal personality disorders (Raine 1991). In addition to the total scale, it contains a separate
sub-scale for each of the nine schizotypal features. The relia-bility of the SPQ is high as indicated by coefficient alpha (0.91) and test-retest correlation (0.82). The SPQ has also been demonstrated to have convergent, discriminant, and criterion validity (Raine 1991).
Both SPQ and PAS were translated from English into Chinese in a two-stage translation after obtaining permis-sion from the original authors. In a reliability study among the 30 subjects used for the test-detest of the CPT described above, the internal consistency alphas were 0.95 for the SPQ and 0.84 for the PAS, while the ICCR for the 1-week test-retest was 0.86 for the SPQ and 0.80 for the PAS.
Statistical Analysis. Multiple linear regression and three-way analysis of variance (ANOVA) procedures were used to assess the effects of age, education, and sex on the CPT performance indices. The relationship between CPT performance indices and total score of CHQ, PAS, and SPQ, respectively, was assessed by regressing the individual CPT index on each total score with age, education, and sex as covariates. Fisher's exact tests (two-tailed) or chi-squared tests were used to assess the association between two categorical variables. To compare the value of continuous variables between two groups, f-tests were used. Paired r-tests were used to com-pare the performance indices of undegraded CPT versus degraded CPT. Pearson product-moment correlations
Table 1. Demographic characteristics of subjects
were used to assess the relationship between d' and hip. A p value less than 0.05 was considered significant, while a p value in the range of 0.05 to 0.10 was considered bor-derline. All analyses were performed with the SAS com-puter package (SAS Institute 1989).
Results
Among the 115 adolescents, 52 (45.2%) were male and 63 were female (54.8%). There was no significant difference in age between male and female subjects (table 1). However, the grades of female students were significantly better than those of their male counterparts. Among the 345 adults, 165 (47.8%) were male and 180 were female (52.2%). The mean age of the men was 3 years older than the mean age of the women, but men did not differ signifi-cantly from women in the distribution of the three age groups (table 1). Overall, men also tended to have 0.8 more years of education than did women, but men did not differ significantly from women in the distribution of the three education groups. There was a significant associa-tion between age group and educaassocia-tion group for men and women, respectively: the younger the age, the more years of education (Fisher's exact tests, two-tailed, p < 0.0001). For example, for age groups 20-34, 35-49, and 50-65 years, the proportions of men with i 10 years of educa-tion were 45, 27, and 13 percent, respectively, while the proportions for women were 57, 13, and 2 percent.
Characteristic Male Female Total
Adolescents Number
Age, years, mean (SD) Overall grades, n (%) Excellent Good Fair Adults Number
Age group, years, n (%) 20-34
35-^9
50-65
Age, years, mean (SD) Education group, years, n (%)
s 6
7-9
i10
Education, years, mean (SD)
52 13.9 11 24 17 65 53 56 56 42.9 81 38 46 7.8 (0.8) (21.2) (46.2) (32.7) (32.1) (33.9) (33.9) (12.8) (49.1) (23.0) (27.9) (3.9) 63 14.0 25 30 8 180 74 56 50 39.8 96 34 50 7.0 (0.8) (39.7)1 (47.6) (12.7) (41.1) (31.1) (27.8) (13.0)2 (53.3) (18.9) (27.8) (4.7)3 115 14.0 36 54 25 345 127 112 106 41.3 177 72 96 7.4 (0.8) (31.3) (47.0) (21.7) (36.8) (32.5) (30.7) (13.0) (51.3) (20.9) (27.8) (4.3) Note.—SD = standard deviation.
1 Significant sex difference, Fisher's exact test (two-tailed), p = 0.02.
Significant sex difference, f = 2.2 (equal variance), c#« 343, p = 0.03.
Performance of the Continuous Performance Test Schizophrenia Bulletin, Vol. 24, No. 1,1998
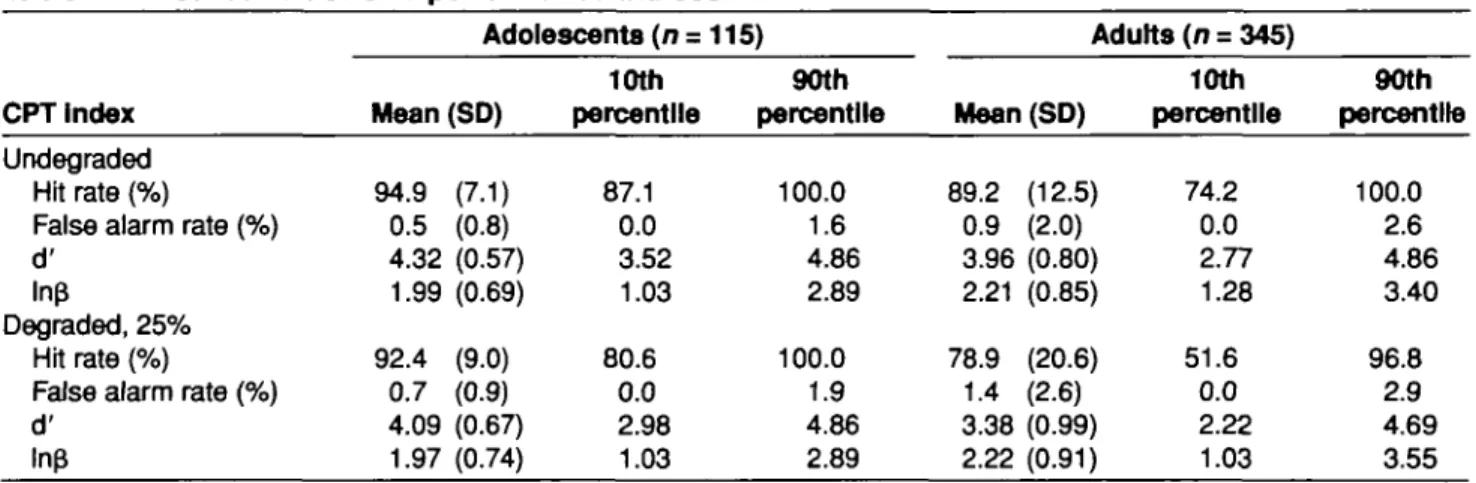
For the undegraded CPT, the percentages of subjects who reached the best allowable limit of hit rate (100%), false alarm rate (0%) and d' (4.86) were 33.0, 47, and 27 percent for adolescents and 23.8, 39.4, and 16.5 percent for adults, respectively. When the test was degraded, the percentages were lowered to 29.6, 33.0, and 18.3 percent for the adolescents and 8.7, 20.6, and 4.4 percent for the adults.
Since the distribution of the CPT indices was skewed, mean with standard deviation (SD) and 10th and 90th per-centiles were reported for the adolescents and adults, respectively (table 2). The 10th percentile for the hit rate and d', and the 90th percentile for the false alarm rate served as cutoff points for selecting subjects with the most deviant performance. Comparing the performance of ado-lescents with that of adults, adoado-lescents had higher hit rates, lower false alarm rates, and higher d' for both the undegraded and degraded CPT (p < 0.01). Meanwhile, adolescents tended to adopt a less stringent criterion than their adult counterparts during the CPT (p < 0.01).
To examine the independence between d' and ln{5, the Pearson correlation between the two indices was cal-culated. For adolescents, the correlation between d' and lnp was not significant: r = 0.04 (p = 0.77) for male and 0.20 (p = 0.12) for female subjects for the undegraded; r = 0.13 (p - 0.37) for male and 0.01 (p = 0.94) for female subjects for the degraded. For adults, r = 0.18 (p = 0.02) for male and -0.02 (p - 0.75) for female subjects for the undegraded; and r = 0.10 (p = 0.10) for male and 0.31 (p = 0.001) for female subjects for the degraded. Thus, there was a moderate but significant correlation between d' and \n$ for men during the undegraded CPT and for women during the degraded CPT.
To evaluate the effects of age, education (or academic grade), and sex on CPT performance, both linear regres-sion of CPT indices on these demographic features as
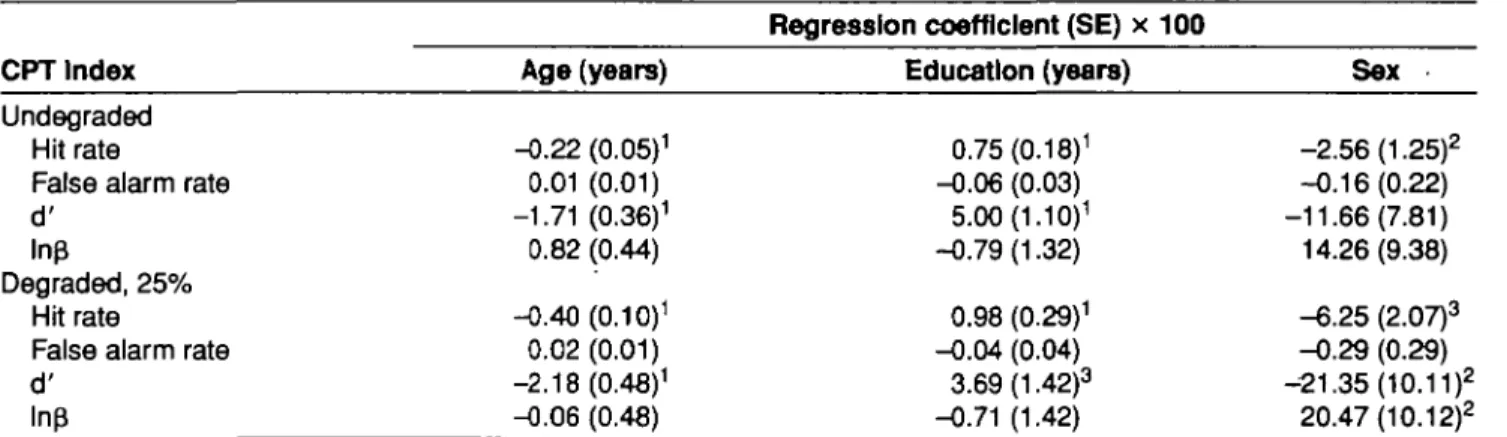
con-tinuous variables and three-way ANOVA, treating these demographic features as categorical variables, were per-formed. For the adolescents, the results of both linear regression and three-way ANOVA indicated that age, acad-emic grade, and sex did not have a significant effect on hit rate, false alarm rate, d', or lnf$ for either undegraded or degraded sessions. In contrast, for the adults, the results of the multiple linear regressions showed that lower age and higher level of education were associated with an increas-ing hit rate and d' in both the undegraded and degraded CPT (table 3). In addition, men had higher hit rates for both the undegraded and degraded CPT, and higher d' and lower ln£ for the degraded CPT than women did. None of the demographic features had an effect on the false alarm rate. Similar results for the effects of age, education, and sex on the four CPT indices were obtained by three-way ANOVA, except that the effect of education became less significant on the degraded hit rate (F = 4.18; df= 2,339; p = 0.02) and borderline on the degraded d' (F = 2.32; <% = 2,339 (p = 0.10).
Since there were effects of age, education, and sex on the hit rate and d' among adult subjects, the mean and standard deviation of the two indices for the undegraded CPT, which is less device-dependent and more comparable across studies than the degraded one, are displayed by age and education for men and women separately (table 4).
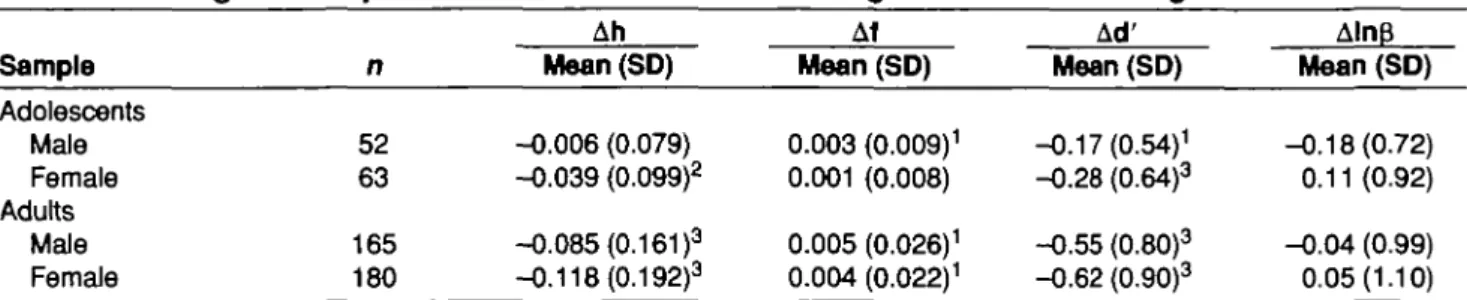
Comparing the CPT indices among undegraded and degraded sessions, the results of paired f-tests showed that, on average, there was a decrease in the hit rate, an increase in the false alarm rate, and hence a decrease in d' from the undegraded to the degraded sessions for both adolescents and adults, except that the change did not reach statistical significance in the hit rate for male adolescents and in the false alarm rate for female adolescents (table 5). Meanwhile, there was no significant change in ln(J for either adolescents or adults.
Table 2. Distribution of CPT performance Indices
CPT Index
Undegraded Hit rate (%)
False alarm rate (%) d'
Inp
Degraded, 25% Hit rate (%)
False alarm rate (%) d' Inp Adolescents (n = Mean (SD) 94.9 (7.1) 0.5 (0.8) 4.32 (0.57) 1.99 (0.69) 92.4 (9.0) 0.7 (0.9) 4.09 (0.67) 1.97 (0.74) 10th percentile 87.1 0.0 3.52 1.03 80.6 0.0 2.98 1.03 115) 90th percentile 100.0 1.6 4.86 2.89 100.0 1.9 4.86 2.89 Adults (n = 345) Mean (SD) 89.2 (12.5) 0.9 (2.0) 3.96 (0.80) 2.21 (0.85) 78.9 (20.6) 1.4 (2.6) 3.38 (0.99) 2.22 (0.91) 10th percentile 74.2 0.0 2.77 1.28 51.6 0.0 2.22 1.03 90th percentile 100.0 2.6 4.86 3.40 96.8 2.9 4.69 3.55
Table 3. The coefficients for the regression of CPT performance Index on the continuous age, education, and sex among adults (n = 345)
Regression coefficient (SE) x 100
CPT Index
Undegraded Hit rate
False alarm rate d'
ln£
Degraded, 25% Hit rate
False alarm rate d' Inp Age (years) -0.22 (0.05)1 0.01 (0.01) -1.71 (0.36)1 0.82 (0.44) -0.40 (0.10)1 0.02(0.01) -2.18 (0.48)1 -0.06 (0.48) Education (years) 0.75 (0.18)1 -0.06 (0.03) 5.00 (1.10)1 -0.79(1.32) 0.98 (0.29)1 -0.04 (0.04) 3.69(1.42)3 -0.71 (1.42) Sex -2.56 (1.25)2 -0.16(0.22) -11.66(7.81) 14.26(9.38) -6.25 (2.07)3 -0.29 (0.29) -21.35 (10.11)2 20.47 (10.12)2
Note.—CPT = Continuous Performance Test (Rosvold et al. 1956); SE .
1p < 0.001 for the z test. 2p < 0.05 for the z test. 3p < 0.01 for the z test.
standard error.
Table 4. and sex
Distribution of the hit rate and d of the undegraded CPT among adults by age, education,
Age (years) and education (years) Men ( n = 165) Women ( n = 180) n 12 17 24 28 13 15 41 15 Hit rate (%) Mean (SD) 83.6(21.5) 96.2 (4.0) 94.6 (9.2) 88.9 (9.4) 96.3 (4.4) • 95.9 (4.9) 85.4(12.1) 89.7 (9.5) d' Mean (SD) 3.65(1.17) 4.48 (0.38) 4.40 (0.60) 3.81 (0.82) 4.57 (0.37) 4.36(0.51) 3.65 (0.70) 3.76(1.02) n 10 22 42 39 10 7 47 3 Hit rate (%) Mean (SD) 92.6(5.1) 94.1 (10.4) 94.8(11.1) 85.8(12.1) 91.0(7.1) 94.5 (5.5) 78.9(15.0) 77.4(18.0) d' Mean (SD) 4.00 (0.67) 4.34 (0.62) 4.40 (0.59) 3.71 (0.80) 4.19(0.51) 4.33 (0.43) 3.35 (0.74) 3.07 (0.76) 20-34 7-9 35-49 7-9 50-65
Note.—CPT = Continuous Performance Test (Rosvold et al. 1956); SD = standard deviation.
We further examined the change of d' (Ad'), which is determined by both hit rate and false alarm rate, at an indi-vidual level. We found that 29 to 33 percent of adoles-cents and 22 percent of adults had an increase rather than a decrease in d' from the undegraded to the degraded CPT (table 6). The magnitude of the change in d' was signifi-cantly smaller among subjects who had an increase in d' than among those who had a decrease in d' in the second session. The only exception was male adolescents. The baseline (undegraded) d' was also significantly lower among subjects who had an increase in d' than among those who had a decrease in d' in the second session. For adults, 100 percent of the men and 95 percent of the
women with a positive change in d' also had a positive change in ln|3 (AlnfJ) from the undegraded to the degraded CPT. The association between Ad and Amp was less strong for male adolescents and was not observed in female adolescents.
To provide some measure of the concurrent and dis-criminant validity of the CPT, the four performance indices were compared with the total score of the three questionnaires (CHQ, PAS, and SPQ) administered in this study. The CHQ tested for nonpsychotic morbidity and thus served as a negative control, while PAS and SPQ measured various features of schizotypal personality. Since the three questionnaires were designed primarily for
Performance of the Continuous Performance Test Schizophrenia Bulletin, Vol. 24, No. 1, 1998
Table 5. Change In CRT performance Indices from the undegraded to the 25% degraded sessions
Sample Adolescents Male Female Adults Male Female n 52 63 165 180 Ah Mean (SD) -0.006 (0.079) -0.039 (0.099)2 -0.085 (0.161 )3 -0.118 (0.192)3 Af Mean (SD) 0.003 (0.009)1 0.001 (0.008) 0.005 (0.026)1 0.004 (0.022)1 Ad' Mean (SD) -0.17 (0.54)1 -0.28 (0.64)3 -0.55 (0.80)3 -0.62 (0.90)3 Aln$ Mean (SD) -0.18(0.72) 0.11 (0.92) -0.04 (0.99) 0.05(1.10)
difference In hit rate,
Note.—CPT - Continuous Performance Test (RosvokJ el al. 1956); SD - standard deviation; Ah, Af, Ad', and AlnfJ •
false alarm rate, d', and InB, respectively, from the undegraded to the degraded CPT.
1p < 0.05 for the paired Mest. 2p < 0.01 for the paired Mest. 3p < 0.001 for the paired Mest.
Table 6. Comparison between subjects with decrease In d' versus subjects with Increase In d during the second (degraded) session of the CPT
Sample Adolescents Male Female Adults Male Female n 52 63 165 180 n( 37 42 128 140 %) (71) (67) (78) (78) |Ad'| Mean (SD) 0.39 (0.45) 0.62 (0.47) 0.84 (0.62) 0.94 (0.75) +Ad' s 0 Baseline d' Mean (SD) 4.57 (0.42) 4.40 (0.54) 4.18(0.70) 4.07 (0.78) AlnB > 0 n(%) 6(16) 21 (50) 4(3) 5(4) n( 15 21 37 40 %) (29) (33) (22) (22) A d > 0 |Ad'| Mean (SD) 0.35 (0.37) 0.40 (0.31 )2 0.48 (0.39)3 0.49 (0.34)3 Baseline d' Mean (SD) 3.91 (0.72)1 4.02 (0.45)1 3.47 (0.89)3 3.35 (0.64)3 A l n p > 0 n(%) 7(47)2 10(48) 37(100)3 38 (95)3
Note.—CPT » Continuous Performance Test (RosvokJ et al. 1956); SD - standard deviation; Ad', and AlnB - difference in d', and InB,
from the undegraded to the degraded CPT.
1p < 0.01 for comparing subjects with Ad' s 0 vs. subjects with Ad' > 0 (Mest or Fisher's exact test two-tailed). 2p < 0.05 for comparing subjects wtth Ad' s 0 vs. subjects with Ad' > 0 (Mest or Fisher's exact test two-tailed). 3p < 0.001 for comparing subjects with Ad' s 0 vs. subjects with Ad' > 0 (Mest or Fisher's exact test two-tailed).
Table 7. Internal consistency and distribution of the total scores of three questionnaires (CHQ, PAS, and SPQ) Questionnaire CHQ PAS SPQ Maximum n 12 35 74 a 0.57 0.70 0.93 Adolescents (n= 115) Mean (SD) 3.8 (2.2) 4.9 (3.3) 20.6(12.9) 10th per-centlle 1 1 4 90th per-cent Me 7 9 39 a 0.61 0.78 0.90 Adults Mean (SD) 4.0 (2.2) 2.6 (3.0)1 12.9 (9.1)1 (n = 345) 10th per-centlle 1 0 3 90th per-centlle 7 8 26
Note.—CHQ - Chinese Health Questionnaire (Cheng and Williams 1986); PAS - Perceptual Aberration Scale (Chapman et al. 1978);
SPQ - Schizotypal Personality Questionnaire (Raine 1991); SD - standard deviation; a - Cronbach's alpha.
1p < 0.001 for the Mest In comparing adolescents with adults.
adults, their results in adolescents should be treated as exploratory. The internal consistency and distribution of the three tests are presented in table 7. The relatively low value of alpha for CHQ might be due to the condensation of the original 4-point scale into a 2-point scale for this study. The mean total score of CHQ was similar between adults and adolescents, but the mean total scores of PAS and SPQ were lower in adults than in adolescents.
Since adults' CPT performance was influenced by age, education, and sex, the regression of CPT indices on the total score of each questionnaire was done by adding the demographic variables as covariates. The results from respective regression analyses showed that a higher PAS score was associated with an increase in the false alarm rate and a borderline decrease in d' for the undegraded CPT, and an increase in the false alarm rate and a
border-Table 8. Coefficients for the regression analysis of CPT Index on total score of CHQ, PAS, and SPQ, respectively, with adjustment for age, education (or academic grade), and sex
Regression coefficient (SE) x 100
CPT Index CHQ PAS SPQ
Adolescents Undegraded
Hit rate
False alarm rate d'
Inp
Degraded, 25% Hit rate
False alarm rate d'
Inp
Adults
Undegraded Hit rate
False alarm rate d'
Inp
Degraded, 25% Hit rate
False alarm rate d' 0.41 (0.33) -0.01 (0.04) 2.72(2.61) -0.55 (3.20) -0.02(0.41) 0.01 (0.04) 1.06 (3.04) -0.40 (3.33) -0.19(0.27) -0.02 (0.05) -0.20(1.72) 0.53 (2.07) 0.17(0.46) 0.09 (0.06) 1.22 (2.22) -2.48 (2.22) -0.23(0.21) 0.07 (0.02)1 -4.51 (1.60)1 -2.61 (2.01) -0.39 (0.26) 0.07 (0.03)1 ^ . 1 7 ( 1 . 8 9 )2 -2.26(2.10) -0.18(0.21) 0.10 (0.04)1 -2.45 (1.30)3 -0.58(1.57) -0.31 (0.35) 0.11 (0.05)2 -1.84(1.69) -3.13 (1.69)3 0.05 (0.06) 0.00(0.01) 0.00 (0.45) -0.55 (0.55) 0.04 (0.07) 0.01 (0.01) -0.07 (0.52) -0.66 (0.57) -0.12 (0.07)3 0.02 (0.01 )3 -0.75 (0.45)3 0.26 (0.55) -0.23(0.12)2 0.02 (0.02) -1.14(0.59)2 -0.81 (0.59) Note.—CHQ - Chinese Health Questionnaire (Cheng and Williams 1986); CPT - Continuous Performance Test (Rosvold et al. 1956);
PAS = Perceptual Aberration Scale (Chapman et al. 1978); SPQ - Schizotypal Personality Questionnaire (Raine 1991); SE = standard error.
1p < 0.01 for the z-test.
2p < 0.05 for the z-test
3p < 0.10 for the z-test
line decrease in lnp for the degraded CPT (table 8). A higher SPQ score was associated with a borderline decrease in the hit rate, a borderline increase in the false alarm rate, and a borderline decrease in d' for the unde-graded CPT, and a decrease in the hit rate and d' for the degraded CPT. In contrast, the CHQ score was not associ-ated with any of the CPT performance indices. It is inter-esting that for the adolescents, a higher PAS score was associated with an increase in the false alarm rate and a decrease in d' for both the undergraded and degraded CPT (table 8). Meanwhile, the CHQ and SPQ scores were not associated with any CPT indices.
Discussion
Comparability of CPT Results. The CPT is currently the most widely used measure of sustained attention or vigilance, which is recognized as one of four factors of human attention (Mirsky et al. 1991). However, there have been various versions of the CPT differing in the
medium of presentation of the stimuli and parameters of the stimulus and scoring (Nuechterlein 1991). Two impor-tant parameters of the undegraded CPT-AX used by Mirsky and colleagues (1995a, 19956) and Harvey et al. (1996) were similar to ours: The duration of the stimulus was 50 ms and the available reaction time was 700 ms in all these studies. Mirsky et al. (1995a) reported a mean hit rate and a false alarm rate for the CPT-AX of 96.5 and 0.6 percent, respectively, for 62 Israeli controls (mean age = 31 years, mean education = 14.6 years). In a study involving 43 control subjects (mean age = 48.9 years, mean education =11.2 years) in Ireland, Mirsky et al. (19956) reported mean hit and false alarm rates of 93.7 and 0.6 percent, respectively. In 31 U.S. volunteers (age not reported, mean education = 14.8 years), the mean d' was 4.46 (Harvey et al. 1996). In our results, for subjects in the age group of 35—49 years and education a 10 years (15 men and 7 women), the mean hit rate, false alarm rate, and d' were 95.9, 0.5, and 4.36 for men and 94.5, 0.3, and 4.33 for women. Given the similarity of these data, we believe that the undegraded CPT results are comparable
Performance of the Continuous Performance Test Schizophrenia Bulletin, Vol. 24, No. 1, 1998
across cultures. However, it is more difficult to directly compare the results of the degraded CPT because the methods of degrading differed and the meaning of degrad-ing levels are not equivalent across studies.
In reporting the results of the CPT, the four indices have different advantages and disadvantages. One concern is the ceiling effect of the test. As shown in our data, the ceiling effect was more minor for d' than for the hit rate and the false alarm rate, and it was even more minor for the degraded session than for the undegraded session. Meanwhile, the hit rate and the false alarm rate are easy to calculate and have been used widely in the literature. But these two indices are affected by the underlying response criterion a subject adopts during the test (Nuechterlein 1991). In contrast, the sensitivity index, d', extracts infor-mation from both the hit rate and the false alarm rate and is assumed to be independent from the subject's response criterion. However, the assumptions needed for the calcu-lation of d' and hip, the normal distribution and equal variances of signal and noise (Swets 1973), cannot be ver-ified. In this study we found that the correlation between d' and hip was not significant for adolescents, which is consistent with previous findings among adolescents (Nuechterlein 1983). However, for male adults during the undegraded CPT and for female adults during the degraded CPT, there was a small but significant correla-tion between d' and hip. This indicates that adults with better sensitivity tended to adopt a more stringent crite-rion than did adults with poor sensitivity. Whether the correlation is due to aging or inappropriate assumptions for the formula warrants further investigation.
Effect of Demographic Features on CPT Performance. The large size and wide range of age and education in the samples provided us an opportunity to examine the effect of certain demographic features on CPT performance. In general, the hit rate and d' of the CPT were affected by demographic features, while the false alarm rate and the response criterion were not. Our results indicated that increasing age was associated with a decreasing value of hit rate and d' in both the undegraded and 25 percent degraded CPT. This is true either by comparing adoles-cents' to adults' CPT results as a whole or by examining the effect of age among adults, with adjustment for sex and education. However, for children in the first and sec-ond grade, the mean hit rate of the undegraded CPT-X was reported to be 80 percent (Mirsky et al. 1991), which is lower than the 94.9 percent of the undegraded CPT 1-9 used for adolescents in this study. This might imply that the performance on the CPT 1-9 develops to its maturity as early as adolescence and declines thereafter. Using a
different version of the CPT, Cornblatt et al. (1988) found that adolescent offspring performed more poorly than their parents on the numeral form of the CPT-IP, although the difference was not statistically significant. One possible explanation for the discrepancy between the two studies is that the verbal ability required for information processing for the CPT-IP is greater than that for the CPT 1-9 (the target in CPT 1-9 was absolute while that in CPT-IP was relative) and thus matures more slowly.
Although we did not find any effect of academic grade on CPT performance among the adolescents, greater length of education was found to be associated with a higher hit rate and d' for both the undegraded and degraded CPT among adults. Cornblatt et al. (1988) found that IQ was not associated with the d' of CPT-IP in 120 subjects from 30 families. Since 71.5 percent of the fathers in that sample had attended college, the absence of effect of IQ on the CPT-IP might be due to the homo-geneity of education in that sample.
The sex difference in the CPT found in this study (i.e., men had a higher hit rate for the undegraded, as well as a higher hit rate, higher d', and less stringent lnP for the degraded CPT than women did) has not been exam-ined in previous reports. Such sex difference was not found among the adolescents. Thus, the sex difference in sustained attention manifested itself only for adults, espe-cially in the higher processing load version of the CPT. Practice Effect. Theoretically, degrading the stimuli should worsen performance on the CPT because it increases the processing load of incoming information. On a group level, this indeed was the case in this study. The paired Mests clearly demonstrated that the hit rate decreased, the false alarm rate increased, and d' decreased from the undegraded to the degraded CPT, while the response criterion was unchanged between sessions. It is intriguing that, on an individual level, the d' of a consid-erable proportion of subjects (range = 22%-33%) improved rather than deteriorated during the degraded session. More adolescents were capable of such improve-ment than adults. A similar phenomenon was noted by Cornblatt et al. (1988) in their findings that normal sub-jects' d' improved significantly in response to distraction during CPT-IP, with improvement tending to be greater for adolescents than for adults. This raises an issue regarding the degrading method used in this study: Does it make the test more difficult by increasing the process-ing load or by distractprocess-ing a subject's attention durprocess-ing the test? Part of the answer might also come from another finding of Cornblatt et al. (1988): Their subjects had small but significant improvements in d' from the first
adminis-tration to the second 6 months later. Since the degraded CPT always followed the undegraded CPT after a 2-minute intermission in the present study, a practice effect is the likely explanation for the improvement in a minor proportion of subjects during the degraded session. Many earlier studies that involved repeated CPT measures did not find a significant practice effect (Orzack et al. 1967; Sykes et al. 1973; Nuechterlein et al. 1983). However, small sample sizes might account for that failure (Nuechterlein 1991).
A closer look at the characteristics of those who improved during the degraded CPT also supports the explanation of a practice effect. We found that the base-line d' for those who improved during the second session was lower than that for those whose scores deteriorated. Thus, the unexpected improvement in d' during the more difficult session of the CPT, seen in a minor proportion of subjects, could be attributed to regression to the mean after the trial of the first session. Another interesting find-ing is that improvfind-ing in d' durfind-ing the second session was strongly associated with becoming more stringent in ln(3 (table 6). This casts more doubt on the independence between d' and ln£. Overall, however, the d' of 67 to 78 percent of the subjects deteriorated during the second ses-sion, and the magnitude of deterioration was greater than the magnitude of improvement. In addition to practice effect, we cannot rule out the possibility of distraction caused by the degrading method, and a factorial design will help to delineate the two effects. How to account for such effects in interpreting a subject's performance on a series of the CPT also warrants further study.
CPT and Schizotypy. The association between CPT performance indices and the PAS and SPQ total scores, and the lack of association between CPT performance indices and the CHQ total score among adults, revealed that the CPT was indeed measuring some underlying structure related to schizotypal personality. This is con-sistent with previous studies examining CPT results among subjects with either psychometrically defined schizotypy or a clinical diagnosis of schizotypal personal-ity disorder. Subjects with PAS-defined schizotypy (2 SD above mean) have been found to have a lower hit rate and d' than controls for the CPT-IP (Lenzenweger et al. 1991), and patients with a DSM-III-R diagnosis of schizotypal personality disorder have also been found to have lower d' for the degraded CPT (Condray and Steinhauer 1992; Harvey et al. 1996).
It is reassuring to see that among adolescents, CPT performance indices were associated with the total score of PAS but not with that of CHQ. Given this similarity
between adults and adolescents, the absence of an associ-ation between CPT performance and SPQ score among adolescents is puzzling. One explanation is that the per-sonality traits measured by SPQ do not mature to a stable state during adolescence, so the application of the SPQ to this age group may not be valid. A second explanation is that using a total score might cloud an underlying associa-tion between CPT performance and certain dimension(s) of the SPQ (Raine et al. 1994). Indeed, the different pat-terns of association between CPT performance and PAS or SPQ among adults indicated that this might be the case. Among adults, the association of PAS score with CPT appeared mainly in the false alarm rate, while its border-line association with the undegraded d' became not signif-icant in the degraded d'. In contrast, the association of SPQ with CPT was mainly in the hit rate and d', espe-cially for the degraded d'. Since SPQ covers all nine crite-ria of schizotypal personality disorder, while PAS focuses on perceptual aberrations of schizotypy, a factor-analytic approach to the SPQ may help clarify its relationship to CPT performance.
Some limitations of this study should be noted. Although psychotic individuals were excluded from this study, we did not screen for a family history of psychosis. Nevertheless, the number of subjects with a positive family history would be small because the lifetime prevalence of schizophrenia in Taiwan was 0.1 to 0.4 percent according to two community surveys (Lin et al. 1989; Hwu et al. 1989). Since we did not screen for alcohol or drug abuse among the participants, we cannot rule out the possible impact of substance use on the variability of CPT perform-ance observed in this study. We do not expect the impact to be large, because the lifetime prevalence of alcohol abuse OT dependence among Han Chinese in Taiwan is 7 percent, the lowest among five locations (St. Louis, MO; Edmonton, Canada; Puerto Rico; Taipei City, Taiwan; and South Korea) studied (Helzer et al. 1990). Although the range of age and education was large enough for some assessment, the representativeness of the samples is limited by the mod-erate response rate (64.8%). Because subjects with schizo-typal personality tended not to participate in the test, the distribution of CPT performance reported in this study may be biased toward less deviance.
hi conclusion, the performance on the CPT among a nonclinical population is profoundly affected by age, edu-cation, and sex. Poorer CPT performance is associated with schizotypal personality features. In assessing CPT performance of relatives of schizophrenia patients, a com-mon practice when considering deficits on CPT per-formance as part of a schizophrenia spectrum (Grove et al. 1991; Mirsky et al. 1995a, 19956), we must compare their results to age-, education-, and sex-corresponding
Performance of the Continuous Performance Test Schizophrenia Bulletin, Vol. 24, No. 1, 1998
norms. The data presented in this report will be valuable in this regard.
References
American Psychiatric Association. DSM-III-R: Diagnostic and Statistical Manual of Mental Disorders. 3rd ed., revised. Washington, DC: The Association, 1987. Asarnow, R.F., and MacCrimmon, D J . Residual per-formance deficit in clinically remitted schizophrenics: A marker of schizophrenia? Journal of Abnormal Psychology, 87:597-608, 1978.
Asarnow, R.F.; Steffy, R.A.; MacCrimmon, D.J.; and Cleghorn, J.M. An attentional assessment of foster chil-dren at risk for schizophrenia. Journal of Abnormal Psychology, 86:267-275, 1977.
Chapman, L.J., and Chapman, J.P. Psychosis proneness. In: Alpert, M., ed. Controversies in Schizophrenia: Changes and Constancies. New York, NY: Guilford Press,
1985. pp. 157-172.
Chapman, L.J.; Chapman, J.P.; Kwapil, T.R.; Eckblad, M.; and Zinser, M.C. Putatively psychosis-prone subjects 10 years later. Journal of Abnormal Psychology, 103:171-183,1994.
Chapman, L.J.; Chapman, J.P.; and Raulin, M.L. Body-image aberration in schizophrenia Journal of Abnormal Psychology, 87:399-407, 1978.
Cheng, T.A., and Williams, P. The design and develop-ment of a screening questionnaire (CHQ) for use in com-munity studies of mental disorders in Taiwan. Psycho-logical Medicine, 16:415-422, 1986.
Chong, M.Y., and Wilkinson, G. Validation of 30- and 12-item versions of the Chinese Health Questionnaire (CHQ) in patients admitted for general health screening. Psychological Medicine, 19:495-505,1989.
Cohler, B.J.; Grunebaum, H.U.; Weiss, J.L.; Gamer, E.; and Gallant, D.H. Disturbances of attention among schiz-ophrenic, depressed, and well mothers and their children. Journal of Child Psychology and Psychiatry, 18:115-135,
1977.
Condray, R., and Steinhauer, S.R. Schizotypal personality disorder in individuals with and without schizophrenic relatives: Similarities and contrasts in neurocognitive and clinical functioning. Schizophrenia Research, 7:33—41, 1992.
Comblatt, B.A., and Erlenmeyer-Kimling, L. Early atten-tional predictors of adolescent behavioral disturbances in children at risk for schizophrenia. In: Watt, N.F.; Anthony, EJ.; Wynne, L.C.; and Rolf, J.E., eds. Children at Risk for
Schizophrenia: A Longitudinal Perspective. New York, NY: Cambridge University Press, 1984. pp. 198-211. Cornblatt, B.A., and Erlenmeyer-Kimling, L. Global attentional deviance as a marker of risk for schizophrenia: Specificity and predictive validity. Journal of Abnormal Psychology, 94:470-486, 1985.
Cornblatt, B.A.; Risch, N.; Fans, G.; Friedman, D.; and Erlenmeyer-Kimling, L. The Continuous Performance Test, Identical Pairs version (CPT-IP): I. New findings about sustained attention in normal families. Psychiatry Research, 26:223-238, 1988.
Davies, D.R., and Parasuraman, R. The Psychology of Vigilance. London, England: Academic Press, 1982. Faraone, S.V.; Kremen, W.S.; Lyons, M.J.; Pepple, J.R.; Seidman, L.J.; and Tsuang, M.T. Diagnostic accuracy and linkage analysis: How useful are schizophrenia spectrum phenotypes? American Journal of Psychiatry,
152:1286-1290, 1995.
Grove, W.M.; Lebow, B.S.; Clementz, B.A.; Cerri, A.; Medus, C ; and Iacono, W.G. Familial prevalence and coaggregation of schizotypal indicators: A multitrait fam-ily study. Journal of Abnormal Psychology, 100:115-121, 1991.
Harvey, P.D.; Keefe, R.S.E.; Mitroupolou, V.; Dupre, R.; Roitman, S.L.; Mohs, R.C.; and Siever, L.J. Information-processing markers of vulnerability to schizophrenia: Performance of patients with schizotypal and nonschizo-typal personality disorders. Psychiatry Research, 60:49-56,1996.
Helzer, J.E.; Canino, G.J.; Yeh, E.-K.; Bland, R.C.; Lee, C.K.; Hwu, H.-G.; and Newman, S. Alcoholism—North America and Asia: A comparison of population surveys with the Diagnostic Interview Schedule. Archives of General Psychiatry, 47:313-319, 1990.
Herman, J.; Mirsky, A.F.; Ricks, N.C.; and Gallant, D. Behavioral and electrographic measures of attention in children at risk for schizophrenia. Journal of Abnormal Psychology, 86:27-33, 1977.
Hwu, H.-G.; Yeh, E.-K.; and Chang, L.-Y. Prevalence of psychiatric disorders in Taiwan defined by the Chinese Diagnostic Interview Schedule. Acta Psychiatrica Scandinavica, 79:136-147,1989.
Lenzenweger, M.F.; Cornblatt, B.A.; and Putnick, M. Schizotypy and sustained attention. Journal of Abnormal Psychology, 100:84-89, 1991.
Lin, T.Y.; Chu, H.M.; Rin, H.; Hsu, C.C.; Yeh, E.K.; and Chen, C.C. Effects of social change on mental disorders in Taiwan: Observations based on a 15-year follow-up survey of general populations in three communities.
Acta Psychiatrica Scandinavica, 79(SuppI. 348): 11-34, 1989.
Mirsky, A.F.; Anthony, B.J.; Duncan, C.C.; Ahearn, M.B.; and Kellam, S.G. Analysis of the elements of attention: A neuropsychological approach. Neuropsychology Review, 2:109-145, 1991.
Mirsky, A.F.; Ingraham, L.J.; and Kugelmass, S. Neuro-psychological assessment of attention and its pathology in the Israeli cohort. Schizophrenia Bulletin, 21(2): 193-204, 1995a.
Mirsky, A.F.; Lochhead, S.J.; Jones, B.P.; Kugelmass, S.; Walsh, D.; and Kendler, K.S. On familial factors in the attentional deficit in schizophrenia: A review and report of two new subject samples. Journal of Psychiatric Research, 26:383-403, 1992.
Mirsky, A.F.; Yardley, S.L.; Jones, B.P.; Walsh, D.; and Kendler, K.S. Analysis of the attention deficit in schizo-phrenia: A study of patients and their relatives in Ireland. Journal of Psychiatric Research, 29:23-42,19956. Nestor, P.G.; Faux, S.F.; McCarley, R.W.; Sands, S.F.; Horvath, T.B.; and Peterson, A. Neuroleptics improve sus-tained attention in schizophrenia: A study using signal detection theory. Neuropsychopharmacology, 4:145—149,
1991.
Nuechterlein, K.H. Signal detection in vigilance tasks and behavioral attributes among offspring of schizophrenic mothers and among hyperactive children. Journal of Abnormal Psychology, 92:4-28, 1983.
Nuechterlein, K.H. Vigilance in schizophrenia and related disorders. In: Steinhauer, S.R.; Gruzelier, J.H.; and Zubin, J., eds. Handbook of Schizophrenia: Neuropsychology, Psychophysiology and Information Processing. Vol. 5. Amsterdam, The Netherlands: Elsevier Science Publishers, 1991. pp. 3 9 7 ^ 3 3 .
Nuechterlein, K.H.; Parasuraman, R.; and Jiang, Q. Visual sustained attention: Image degradation produces rapid sen-sitivity decrement over time. Science, 220:327-329,1983. Orzack, M.H., and Kometsky, C. Attention dysfunction in chronic schizophrenia. Archives of General Psychiatry, 14:323-327, 1966.
Orzack, M.H.; Kometsky, C ; and Freeman, H. The effect of daily carphenazine on attention in the schizophrenic patient. Psychopharmacologia, 8:31-38, 1967.
Raine, A. The SPQ: A scale for the assessment of schizo-typal personality based on DSM-IH-R criteria. Schizo-phrenia Bulletin, 17(4):555-564, 1991.
Raine, A.; Reynolds, C ; Lencz, T.; Scerbo, A.; Triphon, N.; and Kim, D. Cognitive-perceptual, interpersonal, and disorganized features of schizotypal personality. Schizophrenia Bulletin, 20(l):191-201, 1994.
Risch, N. Linkage strategies for genetically complex traits: II. The power of affected relative pairs. American Journal of Human Genetics, 46:229-241, 1990.
Rosvold, H.E.; Mirsky, A.F.; Sarason, I.; Bransome, E.D., Jr.; and Beck, L.H. A continuous performance test of brain damage. Journal of Consulting Psychology, 20:343—350, 1956.
Rutschmann, J.; Cornblatt, B.; and Erlenmeyer-Kimling, L. Sustained attention in children at risk for schizophre-nia: Report on a continuous performance test Archives of General Psychiatry, 34:571-575, 1977.
SAS Institute, Inc. SAS/STAT User's Guide. 6th ed. Cary, NC: The Institute, 1989.
Swets, J.A. The relative operating characteristic in psy-chology: A technique for isolating effects of response bias finds wide use in the study of perception and cognition. Science, 182:990-1001, 1973.
Swets, J.A., and Sewall, S.T. Invariance of signal detect-ability over stages of practice and levels of motivation. Journal of Experimental Psychology, 66:120-126, 1963. Sykes, D.; Douglas, V.I.; and Morgenstern, G. Sustained attention in hyperactive children. Journal of Child Psychology and Psychiatry, 14:213-220, 1973.
Wohlberg, G.W., and Kometsky, C. Sustained attention in remitted schizophrenics. Archives of General Psychiatry, 28:533-537, 1973.
Acknowledgments
This study was supported by grants from the National Science Council (NSC83-O412-B-OO2-31O, NSC84-2331-B-002-187). The authors acknowledge the hard work of Miss Weng-Lin Liu in the fieldwork. They also thank Drs. F.T. Tsai and G.C. Huang at Chinshan Health Station for providing them with a facility for conducting interviews and tests, Drs. Loren J. Chapman and Adrian Raine for granting them permission to translate PAS and SPQ into Chinese, Ms. Adela H.H. Jeng for her work in the second stage of translation, and Dr. Stephen Faraone for his com-ments on earlier versions of the manuscript
The Authors
Wei J. Chen, M.D., Sc.D, is Professor; Chuhsing K. Hsiao, Ph.D, is Associate Professor, Li-Ling Hsiao, B.S., is Research Assistant, Institute of Epidemiology, College of Public Health, National Taiwan University, Taipei, Taiwan. Hai-Gwo Hwu, M.D., is Professor, Department of Psychiatry, College of Medicine, National Taiwan University, Taipei, Taiwan.