高效能水溶性量子點之製備與其在生物檢測之應用
144
0
0
全文
(2)
(3)
(4)
(5) 高效能水溶性量子點之製備與其在生物檢測之應用. 研究生:黃靜萍. 指導教授:陳登銘. 博士. 李耀坤. 博士. 國立交通大學應用化學所博士班. 中文摘要 本論文研究係以水溶性量子點硫醇琥珀酸修飾硒化鎘/硫化鋅製 備尿素、葡萄糖及三酸甘油脂等生物分子指示劑,更進一步合成高效 能水溶性量子點建立量子點螢光共振能量檢測系統,最終將其應用於 生物分子之檢測。 因水溶性量子點螢光強度易受環境中酸鹼值之影響,當量子點暴 露於鹼性環境時,其螢光強度隨環境中鹼性強度增加而增強;藉由光 譜分析可明顯追蹤其放射光譜產生紅位移之現象,此係因鹼性環境下 可減少量子點表面之缺陷與其結構之修飾,造成有效電子-電洞結合 率增加所致。利用上述特性,本研究亦探討尿素經尿素酶水解反應後 產生鹼性物質,致使螢光產生變化故可藉以分析樣品內尿素之含量。 反之,當量子點暴露於酸性環境時,其螢光強度隨酸強度增加而降 低,造成其放射光譜產生藍位移之現象,此係酸性環境中量子點表面 缺陷增加,而電子-電洞結合率降低所致。另一方面,本研究亦利用 葡萄糖氧化酵素催化葡萄糖,因其反應後形成酸性產物,故可藉量子 ii.
(6) 點之螢光變化分析樣品中葡萄糖含量。為增強量子點之螢光強度及脂 質被分析物之偵測,本研究藉由光氧化提升量子點螢光效率,並改善 其表面疏水性,以提升脂質被分析物之溶解度;本論文亦藉量子點之 光活化以結合解脂酵素水解三酸甘油脂,最終利用螢光強度變化以偵 測三酸甘油脂。 本研究結合高分子包覆聚二烯丙基二甲基氯化銨與光活化製程 可合成量子效率高達 48%水溶性且放射波長不同範圍之高效能量子 點,此高效能之螢光特性可應用於螢光共振能量轉移系統,建立檢測 生物分子之分析模型。本研究利用具高正電荷之聚二烯丙基二甲基氯 化銨所修飾量子點與類固醇賀爾蒙酵素以自組裝方式形成複合物,結 合已標定有機染料四甲基羅達明的膽酸目標物,探討量子點與有機染 料間螢光共振能量轉移現象,並掌握膽酸與類固醇賀爾蒙酵素之鍵結 能力,以作為生物分子檢測系統之基礎。. iii.
(7) Preparation of High Performance Water-Soluble Quantum Dots and Their Applications in Bioassay Student: Chin-Ping Huang. Advisor: Dr. Teng-Ming Chen Dr. Yaw- Kuen Li. This research focuses on the design and preparation of molecular bioindicators for semi-quantitative determination of urea, glucose, and triglycerides (MSA)-capped. by. using. CdSe/ZnS. water-soluble quantum. dots. mercaptosuccinic (QDs). acid. (MSA-QDs).. Furthermore, we have also attempted to synthesize high performance water-soluble MSA-QDs and establish a bioassay based on fluorescence resonance energy transfer (FRET) principle that was then utilized in bioassay. The fluorescence intensity of MSA-QDs, highly sensitive to the acidity/basicity of the environment, was discovered to increase with increasing basicity and a red-shifting in emission wavelength has been observed. This observation was attributed to the reduction of surface defects and modified surface structure of MSA-QDs in a basic environment that further increases the recombination probability of holes and electrons. On the contrary, a blue-shifting in emission wavelength was observed when MSA-QDs was exposed to an acidic environment and the fluorescence intensity was found to decrease with increasing acidity, which is attributed to the surface defects formation and lowering probability of electron-hole recombination. Therefore, the assay of urea and glucose has been demonstrated by monitoring the changes of basicity and acidity, respectively, when urea and glucose are hydrolyzed by urease and glucose oxidase in a series of analytes. In order to realize the feasibility of detection for lipid analytes, we have improved the fluorescence intensity and activated the surface iv.
(8) hydrophobicity (to enhance the solubility of lipid) of MSA-QDs by carrying out photoactivation under fluorescent lamp irradiation. The assay of triglyceride has been demonstrated by monitoring the change of fluorescence intensity of MSA-QDs when triglyceride is hydrolyzed by lipase in the analytes. We have also demonstrated that a series of highly efficient, wavelength-tunable or multicolored and poly(diallyldimethylammonium chloride) QDs (PDDA-QDs) with quantum efficiency of ~48% can be synthesized through PDDA capping and photoactivation process. The most challenging task of this research is to investigate and utilize the binding affinity between tetramethylrodamine (TMR)-labeled cholic acid (CA) and self-assembled 5-3-ketosteroid isomerase (KSI) by assuming TMR-CA as the energy donor and PDDA-QDs as the acceptor.. Based. on the principle of fluorescence resonance energy transfer (FRET) from TMR-CA-KSI to PDDA-QDs, our research results exhibit great potential applications in establishing effective assay systems for quantitative determination of a wide variety of biomolecules.. v.
(9) 誌謝 本論文得以順利完成,要感謝許多人給予學生在博士班的學習生涯中不斷的幫助。首先,學 生要誠摯地感謝兩位指導教授陳登銘博士與李耀坤博士,這三年來對學生耐心指導與鼓勵,讓學 生能順利完成博士學業。從碩士至博士求學期間,陳老師不斷的啟發學生研究精神並給予學生足 夠空間與想法進行相關研究,使得學生於材料之研究上有更多更新穎之方向並完成本論文;接下 來,要感謝李耀坤老師在學生博士班研究路上不斷的提供學生資源與訓練學生各方面之能力(研 究方向思考,數據的判讀,邏輯思考..等),又加上老師常有獨到之見解,不僅開啟學生之視野, 更啟發學生獨立思考之能力。 學生能順利口試而獲得碩士學位,要感謝口試委員們,首先要感謝工研院化工所副所長王先 知博士在百忙中抽空給予學生指導與建議,也要感謝張大慈老師與林立元老師給予學生撰寫論文 之相關建議,使論文之內容更為嚴謹與充實,再次感謝李積琛老師不僅是學生博士計劃口試也是 學生博士口試之口委,李老師提供學生許多材料性質之分析方法與論文之指導。古語說:「以銅 為鏡,可以正衣冠,以史為鏡,可以知興替,以人為鏡,可以明得失」 。亦有一語: 「舜何人也, 宇何人也,有為者,亦若是」。由於有老師所立下之模範,讓學生有學習之榜樣與追逐之目標, 奠定學生在學問研究及品德涵養上的基礎,感謝老師不辭辛勞的指導學生。 在研究工作上,首先要感謝陳登銘老師實驗室同學們的支持與鼓勵,李耀坤老師實驗室學長 -可欣熱情的提供所合成的蛋白質與分析物,及實驗室同學們的鼓勵;接下來要感謝材料系-蓉萱 熱情的幫我利用貴儀相關儀器量測樣品,也教我許多儀器操作,更是我的生活心得分享夥伴陪我 度過研究生活中的酸甜苦辣。感謝你們陪伴我度過這段美好的日子,因為有你們,我的生活更多 采多姿。 最後,感謝我的父母、家人與未婚夫-建尉,讓我無經濟壓力下完成博士學位,也陪我渡過 研究生涯中的高、低潮,並給予精神支持與關懷鼓勵,在此,願將一切榮耀與成就獻給我所深愛 的家人。. vi.
(10) Contents 中文摘要. ii. Abstract. iv. 致謝. vi. Contents. vii. Index of Figures. xi. Index of Tables. xvi. Abbreviations. xvii. Chapter 1. 1.1 1.2 1.2.1 1.2.2 1.2.3 1.3 1.4 1.5 Chapter 2. 2.1. Background Properties of Quantum dots. 1 1. Reviews of the Quantum dots. 8. Surface modification of Quantum dots. 8. Photoactivation on the Quantum dots. 15. Application of the Quantum dots. 18. Motivations. 22. Thesis organization. 24. Reference. 26. Synthesis the water-soluble CdSe/ZnS quantum dots and their application 29 Introduction 30. vii.
(11) 2.2 2.2.1 2.2.2 2.2.3 2.2.4 2.3 2.3.1 2.3.2 2.3.3 2.3.4 2.3.5 2.4 2.5 Chapter 3. 3.1 3.2 3.2.1 3.2.2 3.2.3. Materials and Methods. 34. Surface modification of Quantum dots. 34. Instruments and Chemicals. 34. Synthesis of water-soluble MSA-capped CdSe/ZnS QDs 35 Assay conditions and PL measurements for glucose indicator 36 Results and discussion 36 Optical characterization of MSA capped CdSe/ZnS Influence of pH on luminescence of MSA-CdSe/ZnS Photoluminescence spectroscopy for the detection of urea Influence of GOD on photoluminescence of MSA- QDs Photoluminescent spectroscopy of the detection of glucose Conclusions. 46 50. Reference. 51. 36 38 40 44. Investigation of the photoactivated CdSe/ZnS quantum dots and their application 55 Introduction 56 Materials and Methods. 58. Instruments and chemicals. 58. Photoactivation of CdSe/ZnS QDs. 59. Assay conditions and PL measurements. 60. viii.
(12) Results and Discussion. 3.3 3.3.1 3.3.2 3.3.3 3.4 3.5 Chapter 4. 61. Characterization of the photoactivation of CdSe/ZnS QDs Influence of pH on the photoluminescence of POD-QDs Photoluminescence spectroscopy for the detection of triglyceride Conclusion. 66 73. Reference. 74. 61 65. Synthesis and Charac- terization of Poly (diallyldimethylammonium chloride) capped CdSe/ ZnS quantum dots via photoactivation for Fluorescence Resonance Energy Transfer application 76. 4.1 4.2 4.2.1 4.2.2 4.2.3 4.2.4 4.2.5 4.3 4.3.1 4.3.2. Introduction. 77. Materials and Methods. 79. Instruments and chemical. 79. Synthesis of the Poly (diallyldimethylammonium chloride) solution (PDDA) capped CdSe/ZnS quantum dots via photoactivation 80 Conditions of the agarose gel electrophoresis 81 Conditions of the Rhodamine X-labeling on Streptavidin 81 Assay condition of the FRET between PDDA-QDs with Rhodamine X-Streptavidin 82 Results and Discussion 82 Optical properties of the PDDA-QDs via photoactivation 82 Surface and Size Characterization of the PDDA-QDs via photoactivation 88. ix.
(13) 4.3.3 4.4. Fluorescence resonance energy transfer with the PDDA-QDs and SAv-Rhodamine 94 Conclusions 97 Reference. 4.5 Chapter 5. 5.1 5.2 5.2.1 5.2.2 5.2.3 5.3 5.3.1 5.3.2 5.3.3 5.4 5.5 Chapter 6. 99. FRET-based biosensing via PDDA-QDs/KSI 101 and Cholic acid-TMR Introduction 102 Materials and Methods. 102. Instruments and chemicals. 105. Assay condition of the FRET between PDDAQDs with KSI-TMR 105 Assembly of the KSI-Bound Dye-Labeled analogue with QDs and FRET Quenching Assays 105 Results and discussion 108 Spectra. 108. FRET efficiency between PDDA-QDs with KSI-TMR 109 Assembly of the KSI-Bound Dye-Labeled analogue with QDs and FRET Quenching Assays 111 Conclusion 117 Reference. 118. Conclusion. 120. x.
(14) Index of Figures Figure 1.1. Figure 1.2. Figure 1.3 Figure 1.4 Figure 1.5. Figure 1.6. Figure 1.7 Figure 1.8 Figure 1.9. Figure 1.10. Figure 1.11. Figure 1.12. Represent QDs core materials scaled as a function of their emission wavelength superimposed over the spectrum [3] 1 Quantum dots can be synthesized from various types of semiconductor materials (II-VI: CdS, CdSe, CdTeI; III-V: InP, InAsI; IV-VI: PbSeI) characterized by different bulk band gap energies. 2 Absorption (upper) and emission (lower) spectra of four CdSe/ZnS qdot samples. 3 Nanocrystal surrounded by TOPO chains anchored to its surface 5 Bared CdSe QDs and inorganic surface passivation core/shell QDs (a) organic matrix (b) CdS shell (c) ZnS passivation on CdSe surface [13-15] 6 Photobleaching curves showing that QDs are several thousand times more photostable than organic dyes (e.g. Texas red) under the same excitation conditions [19] 7 Qdot solubilization and functionalization. 9 Scheme of the polymer coating procedure. 11 Formation of the polymer-QD complex showing an idealized micellar polymer shell (40% octylamine-modified PAA) encapsulating the QDs [34] 12 (a) Schematic of the CdSe-ZnS core-shell nanoparticle with dihydrolipoic acid surface capping groups; (b) cartoon of the S-S linked MBP-zb homodimer and detail showing nucleotide and primary amino acid sequences of the C-terminal basic leucine zipper interaction domain. 13 Absorption (A) and emission (B) spectra of CdSe@CdS nanocrystals (Cd/Se 8:1) measured after different irradiation times in air. (B): Luminescence spectrum after exposure to light for 15 days [35] 15 Suggested schematics of photoinduced luminescence enhancement. 17 xi.
(15) Figure 1.13 Figure 1.14. Figure 1.15 Figure 1.16. Figure 2.1 Figure 2.2. Figure 2.3 Figure 2.4 Figure 2.5 Figure 2.6 Figure 2.7 Figure 2.8 Figure 2.9 Figure 2.10. Figure 2.11 Figure 3.1 Figure 3.2. Scheme of Maltose-Dependent Change in CdSe Emission [42] 19 Maltose-dependent fluorescence of complex 1 modified-K46C MBP-MT attached to 3.0-3.5 nm diameter THDA capped CdSe nanoparticles under 363 nm excited) at pH 7.5 (20 mM 3-(N-morpholino)propanesulfonic acid, MOPS) 19 Principle of Quantum Dots-Based Enzymatic Activity Probes [43] 20 Emission spectra of rhodamine-labeled peptide-coated quantum dots 15 min following the addition of collagenase of increasing concentration. 21 The structure of MSA assembled on the surface of QD 31 (a) The absorption spectrum (b) photoluminescence spectrum of MSA-QDs with different size in 50 mM phosphate buffer solution 37 PL spectrum of MSA-QDs at different pH values 39 The correlationship between the PL intensity monitored at 586 nm of QDs and pH value 39 The variation of PL spectra of urease/QDs with urea concentration. 41 The variation of pH value and PL intensity with urea concentration. 42 UV-Visible and photoluminescence spectra of the MSA-CdSe/ZnS QDs and GOD. 45 The influence of GOD in PL enhancement of MSA-CdSe/ZnS QDs. 45 The emission spectra of the assay samples at the end-point of the reaction. 47 Correlation between the quench ratio of PL intensity, pH perturbation and the tested glucose concentration. Two assay system, 10 mM and 30 mM phosphate, pH 8.0, were employed. 48 Fluorescent photos of the assay samples. Samples were excited by 365 nm sources. 50 The scheme of triglyceride indicator by POD-QDs 58 The spectrum of 21-Watt fluorescent light 60 xii.
(16) Figure 3.3 Figure 3.4 Figure 3.5 Figure 3.6 Figure 3.7. Figure 3.8. Figure 3.9. Figure 3.10. Figure 3.11. Figure 4.1. Figure 4.2. Figure 4.3. the PL spectrum of MSA-QDs irradiated under the fluorescent light with different times 62 A trend spectrum of the maximum emission peak and the PL intensity under different irradiation times 62 The postulate decay route of an exciton generated in CdSe/ ZnS quantum dots [5] 64 Comparison of PL spectra of MSA-QDs (—) and 65 POD-QDs (----) under excitation at 365 nm. Comparison of PL spectra for POD-QDs as a function of pH. The inset reveals correlation between PL quenching ratio of POD-QDs and pH, 100 (Io- I)/Io represents the ratio of PL quenching, I0 is the PL intensity at 570 nm with pH 8.0, and I is the intensity at emission maximum 66 Variation of PL intensity of POD-QDs as a function of tributyrin concentration in 10 mM phosphate buffer. 68 Absorption spectra of lipase/POD-QDs with different tributyrin concentration (0, 4 and 10 mM) in 10 mM phosphate buffer with pH 8.0. 69 Linear correlation between quenching percentage of PL intensity, [100 (I0 - I)/I0], and tributyrin concentration. 70 Evolution of fluorescence images taken at the end-point of the catalytic hydrolysis of tributyrin in 10 mM phosphate buffer under ultraviolet irradiation of 365 nm 72 The optical characterization of different capping molecular on QDs, MSA capped (。。。); HDA capped (─); PDDA capped (●●●) under 365 nm excited 84 The time evolution of the emission intensity for PDDA-QDs and demonstrates that photoetching or photooxidation of the PDDA-QDs 86 The photoluminescence and images (inset) with the multicolor of the PDDA-QDs, which emission peaks centered at 535 nm (Green), 555nm (Yellow) and 580 nm (Red), when these were excited by 365 nm 87. xiii.
(17) Figure 4.4 Figure 4.5 Figure 4.6 Figure 4.7. Figure 4.8. Figure 4.9 Figure 4.10 Figure 5.1. Figure 5.2 Figure 5.3. Figure 5.4. Figure 5.5 Figure 5.6. Figure 5.7. The gel electrophoresis of MSA-QD and PDDA-QD were drove by 100 89 the multicolor of PDDA-QDs with various sizes. 90 Multiple XPS measurements of MSA-QDs (Black 92 line) and PDDA-QDs (Red line) by Mg Kα source The appearances of (a) Cd3d5/2 at 407 eV (409 eV), Cd3d3/2 at 413.8eV (416 eV), (b) Se 3d at 55.1eV (55.9eV), (c) C 1s at 287 eV (288 eV) and (d) O 1s at 533 eV(534 eV) confirmed the existence of Cadmium, selenium, carbon and oxide in both the MSA-QDs (─) and PDDA-QDs (—。─), repecticely 93 Fluorescence emission spectra from solutions containing 92 nM PDDA-QD and 0~645 nM SAv-Rhodamine by molar ratio. 95 PL and FRET efficiencies as a function of the SAv-Rhodamine/PDDA-QDs molar ratio 96 The fluorescence of SAv-Rhodamine/PDDA- QDs with molar ratio (0- 8) under 365 nm excited 97 Reaction catalyzed by ketosteroid isomerase. The α proton at C-4 is transferred to the α side of C-6 during the isomerization reaction. 104 FRET-based biosensing model via PDDA-QD/KSI and CA –TMR 106 Normalized spectra of (a) emission of PDDA-QDs (530 nm) (b) emission of PDDA-QDs (543 nm) (c) absorption of CA-TMR (d) emission of CA-TMR (580 nm) excited 400 nm. 108 PL spectrum of the PDDA-QDs (530 nm) donor and TMR dye (580nm) acceptor for each ratio (in titration series KSI-TMR) for the PDDA-QDs-due pairs used 109 PL and FRET efficiencies as a function of the KSI-TMR /PDDA-QDs molar ratio 110 The emission spectrum observed from a sample containing 0.33 µM PDDA-QDs, 0.33µM PDDA-QDs/ 2.1µM KSI-TMR and 2.1µM KSI-TMR under 400 nm excited 111 Emission spectra obtain from 0.495µM PDDA-QDs/ 2.99µM KSI and varying amounts of CA-TMR ( 0 to 0.89µM) are also shown for comparison. 113 xiv.
(18) Figure 5.8 Figure 5.9. Figure 5.10 Figure 5.11. Figure 6.1. The FRET efficiency between PDDA-QDs-KSI and Bile-TMR are obtained from Figure 5.7 113 Emission spectra obtain from 0.495µM PDDA-QDs and varying amounts of CA-TMR ( 0 to 0.77µM) are also shown for comparison. 114 The scheme of sensing model with PDDA-QDs/KSI in the mixed solution (CA-TMR and 19NT) 116 shows a typical experiment examining changes in the FRET efficiency of 543 nm emitting PDDA-QDs with increasing concentrations of mixed solutions (CA-TMR and 19NT) 116 Summaries of the research areas 123. xv.
(19) Index of Tables Table 2.1 Table 2.2 Table 3.1 Table 4.1. Summering the characterizations of optical and size with MSA-QDs 38 Comparison of performance of different urea sensors 43 Comparison of performance of different methods for the detection of triglycerides 72 The binding energy intensity and the atomic amount of MSA-QD and PDDA-QD 94. xvi.
(20) Abbreviations Symbol. 19NT CA CdS CdSe/ZnS ConA DHLA FAD FD. FDA. FRET FWHM G-25 GOD HDA KSI MAA MBP MMPs MPA MSA MSA-QDs NP PAA. Full name. 4-Estren-17b-OL-3-ONE Cholic acid Cadium Sulfide Cadmium selenide/ Znic Sulfide (core/shell structure) Concanavalin A dihydroxylipoic acid flavin adenine dinucleotide The integrated fluorescence intensity of donor alone (no acceptor present) The integrated fluorescence intensity of the donor in the presence of acceptor(s) Förster resonance energy transfer Full-width half-maximum Sephadex G glucose oxidase n-hexadecylamine △5-3-ketosteroid isomerase Mercaptoacetic acid Maltose binding protein Matrix metalloproteinases Mercaptopropionic acid Mercaptosuccinic acid Mercaptosuccinic acid quantum dots Nanoparticle Polyacrylic acid. xvii. capped.
(21) PDDA PDDA-QDs PL POD-QDs QDs QY SA SAv SCKs SeO2 TBP TEM TMAOH TMR TOP TOPO UV-Vis XPS. Poly (diallyldimethylammonium chloride) solution Poly (diallyldimethylammonium chloride) solution quantum dots Photoluminescence Photoactivated quantum dots Quantum dots Quantum yield Stearic acid Streptavidin Shell cross-linked knedels Selenium oxide Tri-n-butylphosphine Transmission electron microscopy Tetramethylammonium hydroxide Tetramethylrodaminme Tri-n-octylphosphine Tri-n-octylphosphine oxide Ultraviolet-visible X-ray Photoelectron Spectroscopy. xviii.
(22) Chapter 1 Background 1.1 Properties of Quantum dots For nanocrystals smaller than the Bohr exciton radius (~ a few nanometers), energy levels are quantized, with values directly related to the Quantum dot size. These phenomenon are called quantum confinement, hence the name “Quantum dots” (QDs). Semiconductor QDs are single crystals a few nanometers in diameter whose size and shape can be precisely controlled by the duration, temperature, and capping ligand molecules used in the synthesis process [1-2]. Otherwise, QDs, also as nanocrystals, are a special class of materials known as semiconductors, which are composed of periodic groups of II-VI, III-V, and IV-VI materials. The various compositions of QDs have shown the emitting from the UV to the infrared range, which depend on the band gap of QDs. Figure 1.1 represent QDs core materials scaled as a function of their emission wavelength superimposed over the spectrum [3].. Figure 1.1 Represent QDs core materials scaled as a function of their emission wavelength superimposed over the spectrum [3]. 1.
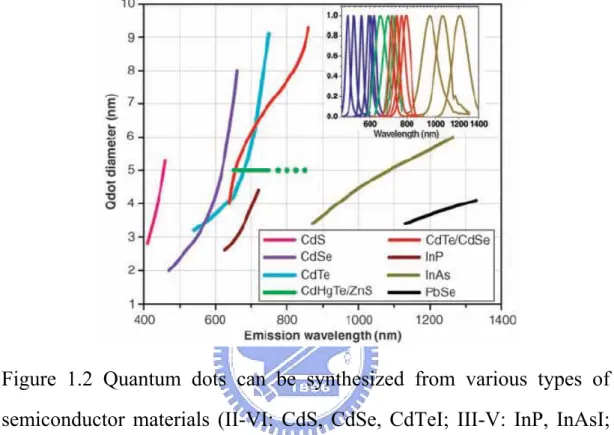
(23) These QDs have composition and size dependent absorption and emission (as shown in Figure 1.2) [3-10]. When absorption a photon with energy above the semiconductor band gap energy would result in the creation of an electron-hole pair (or exciton).. Figure 1.2 Quantum dots can be synthesized from various types of semiconductor materials (II-VI: CdS, CdSe, CdTeI; III-V: InP, InAsI; IV-VI: PbSeI) characterized by different bulk band gap energies. The curves represent experimental data from the literature on the dependence of peak emission wavelength on QDs diameter. The range of emission wavelength is 400 to 1350 nm, with size varying from 2 to 9.5 nm (organic passivation/solubilization layer not included). All spectra are typically around 30 to 50 nm (full width at half maximum). Inset: Representative emission spectra for some materials. Data are from [3-10]. Data for CdHgTe/ZnS have been extrapolated to the maximum emission wavelength obtained in Michalet’s group.. 2.
(24) According to Figure 1.3 [3], the broading absorption spectrum supported a wide excitation source chose. The radiative recombination of exciton leads to the emission of a photon in a narrow, symmetric energy band (shown in Figure 1.3). Bulk semiconductors only could display a rather uniform absorption spectrum; on the contrary, QDs would appear as a series of overlapping peaks in the absorption range. Owing once more to the discrete nature of electron energy levels in QDs, each peak corresponds to an energy transition between electron-hole (exciton) energy levels.. Figure 1.3 Absorption (upper) and emission (lower) spectra of four CdSe/ZnS qdot samples. The blue vertical line indicates the 488-nm line of an argon-ion laser, which can be used to efficiently excite all four types of QDs simultaneously [3]. 3.
(25) Furthermore, the QDs would not absorb light that has a wavelength longer than that of the first exciton peak. Therefore, the wavelength of the first exciton peak is a function of the composition and size of the quantum dot. The emission peak is bell-shaped (Gaussian) and occurs at a slightly longer wavelength than the lowest energy exciton peak (absorption peak). Consequently, the fluorescence or absorption could be tunable by synthesized process, such as temperature, growth time et al. Unfortunately, surface defects in the crystal structure act as temporary traps for the electron or hole, hindering their radiative recombination. If the alternation of trapping and untrapping events results in intermittent fluorescence visible at the single molecule level [11] and reduces the overall quantum yield, which is the ratio of emitted to absorbed photons. Overcoming these shortcomings, and protecting surface atoms from oxidation and other chemical reactions, is to grow a shell of few atomic layers of a material with a larger band gap on top of the nanocrystal core. The properties of core/shell QDs are highly dependant on the inorganic surface passivation and obey the principles of quantum well. Using the organic surfactant (e.g. TOPO or TOP) passivated and stabilized on the CdSe QDs (as shown in Figure 1.4) could not improve the drawback in the fluorescence efficiency [12]. As a result of imperfect surface passivation and rearrangement of the surface atoms, incomplete quantum confinement effect on the surface may takes place. Nevertheless, overcoating nanocrystal core with inorganic materials of higher band offsets has been to improve the photoluminescence quantum yield (QY). It could improve and eliminate 4.
(26) the nonradiative recombination sites on the surface.. Figure 1.4 Nanocrystal surrounded by TOPO chains anchored to its surface [12].. As illustrated in Figure 1.5 (a-c) [13-15], ZnS or CdS shell capped CdSe QDs would provide higher quantum efficiency and photo stability due to the confinement of the carrier on the edge of the energy band offsets, and consequently reducing the loss of the carrier by trapping or tunneling [13-15]. This shell could be designed carefully to obtain quantum yields close to 90% [16]; this step also enhances QDs photostability by several orders of magnitude relative to conventional dyes [17]. As briefly noted above, QDs are made from inorganic semiconductors and have novel optical properties that can be used to optimize the signal-to-background ratio. Additionally, QDs have very large molar extinction coefficients in the order of 0.5-5 × 10⁶ M cm-1[18], which makes them bringhter than organic dye. In photostability, QDs are several thousand times more stable against photobleaching than 5.
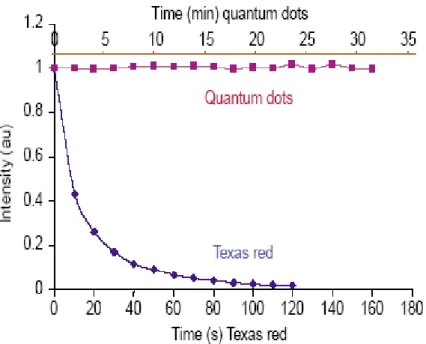
(27) organic dyes (shown in Figure 1.6) and are thus well suited for continuous tracking studies over a long period of time [19].. a. b. c. Figure 1.5 Bared CdSe QDs and inorganic surface passivation core/shell QDs (a) organic matrix (b) CdS shell (c) ZnS passivation on CdSe surface [13-15].. 6.
(28) Figure 1.6 Photobleaching curves showing that QDs are several thousand times more photostable than organic dyes (e.g. Texas red) under the same excitation conditions [19].. 7.
(29) 1.2. Reviews of the Quantum dots. 1.2.1. Surface modification of Quantum dots In traditional methods, QDs could be prepared in the various media,. from atomic deposition on solid-phases to colloidal synthesis in aqueous solution. However, the highly homogeneous and crystalline QDs are most important in the synthesis. Previous authors reported the highest quality QDs are typically prepared at elevated temperatures in organic solvents, such as tri-n-octylphosphine oxide (TOPO) and hexadecylamine, all of them are high boiling point bases containing long alkyl chains. These hydrophobic organic molecules serve as the capping agents that coordinate with unsaturated metal atoms on the QDs surface to prevent the formation of bulk semiconductor. Therefore, the organic ligands capped on the QDs surface and are only soluble in hydrophobic solvents, such as chloroform and hexane. For biological application, these hydrophobic QDs must first be made form water-soluble. As a result, different QDs solubilization strategies have been devised over the past few years, including (i) ligand exchange with simple thio-containing molecules [20-21] or more sophisticated ones, such as oligomeric phosphines [22], dendrons[23], and peptides[24]; (ii) encapsulation by a layer of amphiphilic diblock [25] or triblock copolymers[26] or in silica shells [4,27], phospholipid micelles [28], polymer. beads. [29],. polymer. shells. [30],. or. amphiphilic. polysaccharides [31]; and (iii) combinations of layers of different molecules conferring the required colloidal stability to QDs [3, 32] (as 8.
(30) shown in Figure 1.7 ).. Figure 1.7 Qdot solubilization and functionalization. (A) Surface chemistries. TOPO (trioctylphosphine oxide)– passivated qdots can be solubilized in aqueous buffer by addition of a layer of amphiphilic molecules containing hydrophilic (wt) and hydrophobic (w–) moieties, or by exchange of TOPO with molecules that have a Zncoordinating end (usually a thiol group, SH) and a hydrophilic end. Examples of addition include (a) formation of a cross-linked polymer shell (30), (b) coating with a layer of amphiphilic triblock copolymer (25), and (c) encapsulation in phospholipid micelles (28). Examples of exchange include (d) mercaptoacetic acid (MAA) (20), (e) dithiothreitol (DTT) (21), (f) dihydrolipoic acid (DHLA) (32), (g) oligomeric phosphines (22), (h) cross-linked dendrons (22), and (i) peptides (24). The curved arrow indicates sites available for further functionalization [3]. 9.
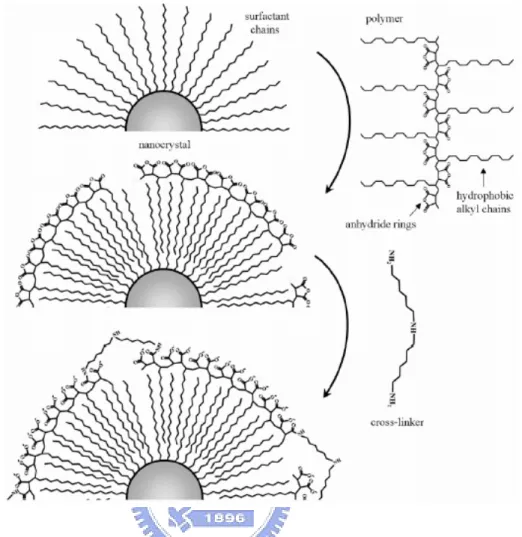
(31) For describing the above methods, we take some example and reported to depict them. In perceiving of QDs surface modification methods, as elaborated in the previous sections, it is clearly that the water-soluble QDs was prepared mostly by capping with a mercaptocarboxylic acid layer, such as mercaptoacetic acid (MAA), mercaptopropionic acid (MPA), and dihydroxylipoic acid (DHLA) etc. The main reason is that the thio group derivatives as a linkage has higher affinity binding than other functional groups on the QDs. For example, Chan and Nie (1998) [20] reported a method by using mercap toacetic acid for solubilization and covalent protein attachment. Sun (2001) used MSA to replace mercaptoacetic acid because one MSA molecule provides two carboxyl groups that may increase binding number of IgG on each QD [33]. In addition, the MSA layer is expected to reduce passive protein adsorption on QDs.. In addition to this. general method, the encapsulation on the hydrophobic QDs surface by polymer has recently been developed. Pellegrino (2004) have developed a simple and general strategy for decorating hydrophobic nanocrystals of various materials, such as CoPt, Au, CdSe/ZnS, and Fe2O3 with a hydrophilic polymer shell by exploiting the nonspecific hydrophobic interactions between the alkyl chains of poly(maleic anhydride alt-1-tetradecene) and the nanocrystal surfactant molecules . Then, addition of bis(6-aminohexyl)amine results in the cross-linking of the polymer chains around each nanoparticle (Figure 1.8 ). Therefore, the nanocrystal become soluble into water upon hydrolyzation of the unreacted anhydride groups [30].. 10.
(32) Figure 1.8 Scheme of the polymer coating procedure. The following plausible configuration is then assumed for the polymer coating process: The hydrophobic alkyl chains of the polymer intercalate with the surfactant coating. The anhydride rings are located on the surface of the polymer-coated nanocrystal. The amino end groups of the cross-linker molecule open the rings and link the individual polymer chains. The surface of the polymer shell becomes negatively charged, stabilizing the particles in water by electrostatic repulsion. A structural analysis aimed at determining the detailed conformation of the cross-linked polymer shell is in progress [30].. 11.
(33) Petruska (2004) have successfully employed hydrophobically modified polymers to solubilize nanoparticle [34]. Using low-molecular weight polyacrylates modified with octyl chains were developed to stabilize and encapsulate QDs, rendering them soluble in polar media, e.g. water or alcohol. The amphiphilic polymer encases the nanoparticle, creating a micellar shell around QDs. Then, the hydrophobic groups are cross-linked to stabilize the QDs-polymer conjugate for preparing shell cross-linked knedels (SCKs) (as shown in Figure 1.9).. Figure 1.9 Formation of the polymer-QD complex showing an idealized micellar polymer shell (40% octylamine-modified PAA) encapsulating the QDs [34].. Mattoussi (2000) reported the strategy of combining the use of alkyl-COOH capped CdSe/ZnS (Figure 1.10) and two-domain recombinant proteins cloned with a highly charged leucine zipper tail offers several advantages. (1) The alkyl-COOH teriminated capping groups, which permit dispersion of the QDs into water solutions, also provide a surface charge distribution that can promote direct self-assembly with other molecules that have a net positive charge. (2) 12.
(34) The fusion protein approach provides a general and consistent way to prepare a wide selection of biological macromolecules amenable to alterations of the interaction domain, such as charge, size, stability to pH, and temperature [32].. Figure 1.10 (a) Schematic of the CdSe-ZnS core-shell nanoparticle with dihydrolipoic acid surface capping groups; (b) cartoon of the S-S linked MBP-zb homodimer and detail showing nucleotide and primary amino acid sequences of the C-terminal basic leucine zipper interaction domain. Poly-Asn flexible linker is boxed with dashed lines, unique engineered cysteine is double boxed, and lysine residues contributing to net positive charge of leucine zipper are single boxed [32].. 13.
(35) Comparing the ligand exchange and polymer encapsulation method, the ligand exchange are wide used into modification QDs surface, because of the surfactant (contain thio group) are cheaper than other polymers and have high binding affinity on the metal atoms. Furthermore, the encapsulation polymer on the hydrophobic surface is easily form the emulsification in the environment. Consequently, most research all like to use the thio derived molecules capping on the QDs surface.. 14.
(36) 1.2.2. Photoactivation on the Quantum dots Wang (2004) reported that Mechanism of Strong Luminescence. Photo-activation of Citrate-Stabilized Water-Soluble Nanoparticles with CdSe Cores. Using sodium citrate as a stabilizer, CdSe and CdSe/CdS semiconductor nanocrystals have been synthesized in aqueous environment. Unfortunately, these QDs display photoluminescence with very low quantum yields, upon prolonged illumination with visible light, enhancements up to 5000% have been measured. Because of their high surface area, nonradiative recombination at surface sites and surface traps compete with the band-edge emission [35]. Photoactivation of the QDs luminescence, that is, an order of magnitude or more increase of QY, is a new process of preparation of highly luminescent nanocrystal. It is important alternative way to achieve high QY. Figure 1.11 shows several absorption and emission spectra after different irradition times for CdSe/CdS.. Figure 1.11 Absorption (A) and emission (B) spectra of CdSe@CdS nanocrystals (Cd/Se 8:1) measured after different irradiation times in air. (B): Luminescence spectrum after exposure to light for 15 days [35].. 15.
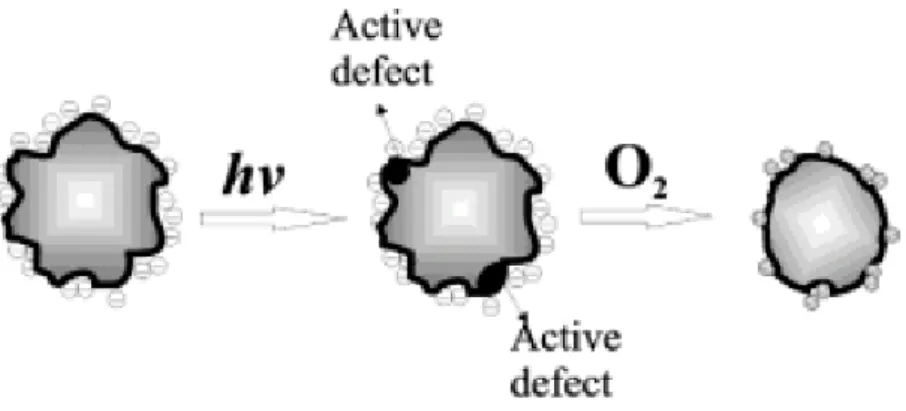
(37) The optical densities of all the samples noticeably decreased during the illumination. The corresponding emission peak grew dramatically, at least 2 orders of magnitude in the peak intensity, retaining about the same peak width of 35-50 nm. It could be observed that light treatment promoted spectral shifts toward shorter wavelengths both in absorption and luminescence, which is consistent with a possible decrease of particle size during illumination. As a result of the photoactivation in CdSe NPs, charge carriers resulting from the absorption of light are trapped into the surface states formed because of the uneven atomic-scale topography of QDs. Additionally, the excitons activate the reactions with oxygen present in the environment, for instance, the transfer of a photoexcited electron to O2 leading form O2-. The remaining hole also trapped on the surface oxidizes the Se to SeO2.This results in the gradual etched of the unwanted topographic features on the surface and in smooth, highly luminescent QDs where the nonradiative decay of excitons no longer dominates. The mechanism is schematically presented in Figure 1.12. In various possible models of photoactivated luminescence, it is important to perceive the occasion and the consequence of the phenomenon. Jones et al. reported the increase in quantum efficiency up on illumination to chemical changes in the particles due to the redistribution of surfactant molecules on QDs surfaces [36]. Therefore, using photoactivation on QDs could enhance the quantum efficiency, and improve the application in the bioassay system.. 16.
(38) Figure 1.12 Suggested schematics of photoinduced luminescence enhancement. Photoinduced charge carriers are trapped in “roughness states” (active defect) on the surface. Photooxidation eliminates the surface roughness of the NP, i.e., atomic-scale imperfections. This procedure results in reduced-size NPs and yields NPs with reduced surface defects and enhanced photoluminescence [36].. 17.
(39) 1.2.3. Application of the Quantum dots Sandros (2005) present a facile, reagentless method for generating. protein-based semiconducting nanoparticle sensors for small molecules. Previous author reported that Maltose binding protein (MBP) is typically for biosensor method development. As a result of MBP undergo a reversible, ligand-dependent conformational change. These movements have been harnessed for maltose sensing either by differentially opening/closing motion on the protein surface [37-39], or by using lever-action molecular displacement [40-41]. Hence, Sandros employs the lever-action strategy to alter the interaction between an MBP attached [(tetraamine)(5-maleimido-phenanthroline)ruthenium][PF6]2 (1) and the surface of a water-soluble CdSe nanoparticle. The system provides reagentless selective detection of maltose by changing the interaction between 1 and CdSe nanoparticle surface in a distance-dependent fashion (as shown in Figure 1.13) [42]. The valence-band hole of the CdSe nanoparticle would be occupied on electron transfer from (1), when source excited on the CdSe. Alternatively, electron transfer from (1) to the valence band of the CdSe excited state, forming a nonfluorescent CdSe anion, is consistent wuth the decrease in CdSe emission intensity. A 1.4-fold increase in fluorescence intensity was observed upon maltose addition (Figure 1.14). The phenomenon indicated a decrease in the (1)-CdSe electron transfer quenching.. 18.
(40) Figure 1.13 Scheme of Maltose-Dependent Change in CdSe Emission [42].. Figure. 1.14. Maltose-dependent. fluorescence. of. complex. 1. modified-K46C MBP-MT attached to 3.0-3.5 nm diameter THDA capped CdSe nanoparticles under 363 nm excited) at pH 7.5 (20 mM 3-(N-morpholino)propanesulfonic acid, MOPS): fluorescence emission spectra of a solution (5 nM biosensor) without (solid line) and with 1 mM maltose (dashed line) [42].. 19.
(41) Shi (2006) reported the development of quantum dots FRET-based protease sensors and their application for the measurement of extracellular matrix metalloproteinases (MMPs) activity in normal and cancerous breast cells. The quantum dots based probes were prepared by exchanging the TOPO capping ligands of CdSe/ZnS QDs with tetrapeptide RGDC molecules. The acceptors are rhodamine which be labeled on the peptide molecules by covalent bonding. Upon enzymatic cleavage of the peptide molecules, the rhodamine (acceptor) molecules no longer provided an efficient energy transfer channel to QDs. Therefore, the emission color of the QDs changed back to green ( the scheme show in Figure 1.5). The QDs FRET-based enzymatic activity probes were first used to determine the activity of collagenase in solution to test the analytical capabilities of the QDs FRET-based probes in a model system. FRET measurements of the QDs at increasing levels of collagenase in solution are shown in Figure 1. The fluorescence intensity (545 nm) of the QDs increased while the fluorescence intensity of the rhodamine molecules decreased due to the enzymatic cleavage of the RGDC peptide by collagenase [43].. Figure 1.15 Principle of Quantum Dots-Based Enzymatic Activity Probes [43].. 20.
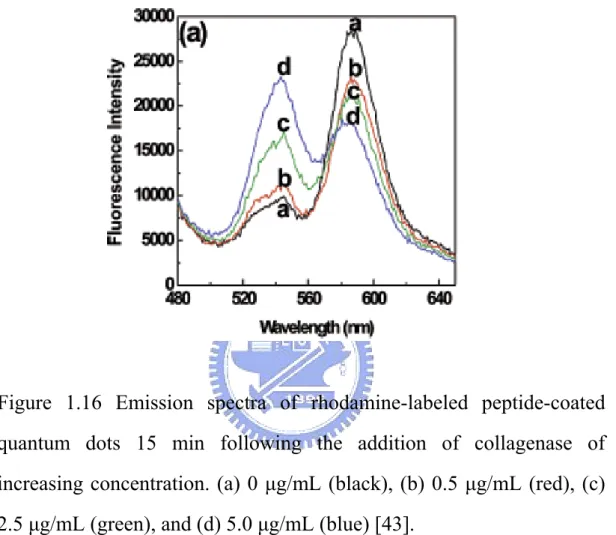
(42) Figure 1.16 Emission spectra of rhodamine-labeled peptide-coated quantum dots 15 min following the addition of collagenase of increasing concentration. (a) 0 µg/mL (black), (b) 0.5 µg/mL (red), (c) 2.5 µg/mL (green), and (d) 5.0 µg/mL (blue) [43].. 21.
(43) 1.3 Motivations In this work, we aim to achieve several goals as below: First at all, modifying the CdSe/ZnS QDs surface contains carboxyl group and water soluble in aqueous. As we have discussed previously, modifiable ligand on the QDs surface, such as ligand exchange by thio group, encapsulation with amphiphilic polymer, and combinations of layers with thio group modified on biomolecular, are also effective for water-soluble QDs and play an important role in the biological or biosensor application area. Among the semiconductor NPs, CdSe or CdSe/ZnS QDs have more advantages in their optical properties, such as tunable photoexcitation depend on the size, high photostability, narrow and symmetric luminescence spectra, and high quantum yield. Therefore, QDs charm many researchers to choose them to apply in the bio-labeling, biosensor (bioindicator), nanodevice, and solar-cell, etc. Recently, the biosensors (bioindicators) are popular in the clinic or portable. However, in the composition of biosensor, they also need complex component, such as sensing area, enzyme immobilized, and circuit designing. For this reason, we propose easily bioindicators, which are urea, glucose, by luminescence intensity of QDs under photoluminescence spectrum instrument monitored. Second, to improve the quantum efficiency of water-soluble QDs (MSA-QDs) suit to assay lipid (triglyceride), where the MSA-QDs must be photoactivated through fluorescent lamp and support more hydrophobic site on the QDs surface to soluble the triglyceride. As we discussed above, current reviewers suggest that the luminescence intensity of QDs would be 22.
(44) increase around 5000% after photoactivation by UV lamp. However, the QDs could not easily control to keep away the aggregation. In this work, the fluorescent lamp is employed as photoactivation source, which contains wide band spectra, and easily gets high performance luminescence POD-QDs with low aggregation phenomena. The POD-QDs is also employed to apply in the triglyceride sensing through visualizing under 365 nm excited. Third, to fabricate and utilize the PDDA-QDs interaction forces to assemble protein molecular assay the bimolecular through fluorescent resonance energy transfer (FRET). As we have discussed previous, the water-soluble QDs has lethal shortcoming in the luminescence through ligand exchange, and is not easily applied in the biological. Hence, we propose an easily method to improve QDs luminescence, which contains the photoactivation and polymer capping under the fluorescent lamp irradiation. The high performance water-soluble QDs would be fabricated and realized into the biosensing system through fluorescent resonance energy transfer (FRET).. 23.
(45) 1.4 Thesis organization In chapter 1, we are given a background introduction, including the basic concepts, definition and indication of quantum dots properties. Then, we have some reviews on the most representative experiments about application on CdSe or CdSe/ZnS QDs. At least, we will have the motivations of this work and thesis organization.. In chapter 2, we will focus on the fabrication water-soluble QDs, with various emissions, through thio group ligand exchange (MSA-QDs). Then, we demonstrate the urea and glucose bioindicator by MSA-QDs, and investigate the luminescence intensity of MSA-QDs during acid or basic environment. We also provide and explain some phenomena, like surface trap or smoothing QDs surface during ions effect.. In chapter 3, we will improve the luminescence intensity of MSA-QDs through photoactivarion. We also point out the mechanism of photoactivation on the MSA-QDs (POD-QDs). Then, we develop the triglyceride bioindicator by POD-QDs and show the sensitive curve by turning buffer capacity in the environment.. In chapter 4, we will progress the solubility of POD-QDs through Poly (diallyldimethylammonium chloride) solution (PDDA) capped on the MSA-QDs (PDDA-QDs) under fluorescent lamp (intensity 8.5 mW/cm2) irradiation. Then, we discuss the surface properties of PDDA-QDs, such as charge, size, surface state, and composition, by analytic instrument. 24.
(46) Finally, we develop the FRET system to sense the biomolecule through high performance luminescence PDDA-QDs. and organic dye. Rhodaminme. Consequently, we discuss the FRET efficiency between PDDA-QDs and Streptavidin-Rhodaminme. In chapter 5, we develop the FRET based system to assay the biomolecule through high performance luminescence PDDA-QDs and organic dye. First at all, we discuss the binding constant between PDDA-QD/△5-3-ketosteroid isomerase (EC 5.3.3.1) and Cholic acidtetramethylrodaminme (CA-TMR). Second, we provide the FRET efficiency between the above systems and discuss the energy phenomena between PDDA-QDs and organic dye. Third, we demonstrated the competition reactions, which obtain Cholic-TMR and 4-Estren-17b-OL-3-ONE (19NT), based on the FRET system with PDDA-QDs.. In chapter 6, we will have a brief conclusion of this work.. 25.
(47) 1.5. Reference. [1] A. P. Alivisatos, Science, 271 (1996) 933. [1] X. Michalet, F. F. Pinaud, L. A. Bentolila, J. M. Tsay, S. Doose, J. J. Li, G. Sundaresan, A. M. Wu, S. S. Gambhir, S. Weiss, Science, 307 (2005) 538. [2] I. L. Medintz, H. T. Uyeda, E. R. Goldman, Nature materials, 4 (2005) 435. [3] M. Bruchez, M. Moronne, P. Gin, S. Weiss, A. P. Alivisatos, Science, 281 (1998) 2013. [4] W. W. Yu, J. C. Falkner, B. S. Shih, V. L. Colvin, Chem. Mater. 16 (2004) 3318. [5] A. A. Guzelian, U. Banin, A. V. Kadavanich, X. Peng, A. P. Alivisatos, Appl. Phys. Lett. 69 (1996) 1432. [6] A. A. Guzelian, J. Phys. Chem. 100 (1996) 7212. [7] W. W. Yu, Y. A. Wang, X. Peng, Chem. Mater. 15 (2003) 4300. [8] W. W. Yu, L. Qu, W. Guo, X. Peng, Chem. Mater. 16 (2004) 560. [9] J. M. Tsay, M. Pflughoefft, L. A. Bentolila, S. Weiss, J. Am. Chem. Soc. 126 (2004) 1926. [10] M. Nirmal, Nature. 383 (1996) 802. [11] J. K. Lorenz, A. B. Ellis, J. Am. Chem. Soc. 120 (1998) 10970. [12] X. Peng, M. C. Schlamp, A. V. Kadavanich, A. P. Alivisatos, J. Am. Chem. Soc. 119 (1997) 7019. [13] B. O. Dabbousi, J. Rodriguez-Viejo, F. V. Mikulec, J. R. Heine, H. Mattoussi, R. Ober, K. F. Jensen, M. G. Bawendi, J. Phys. Chem. B 101 (1997) 9463. [14] W. Guo, J. J. Li, Y. A. Wang, X. Peng, J. Am. Chem. Soc.125 (2003) 3901. [15] P. Reiss, J. Bleuse, A. Pron, Nano Lett. 2 (2002) 781. [16] A. Sukhanova, Anal. Biochem. 324 (2004) 60. [17] L. CA, W.K. Woo, F.V. Mikulec, M.G. Bawendi, J Phys Chem B, 106 (2002) 7619. [18] X. Gao, L. Yang, A. P. John, F. F. Marshall, J. W. Simons , S. Nie, Current Opinion in Biotechnology (2005) 63. [19] W. C. W. Chan, S. M. Nie, Science 281 (1998) 2016. [20] S. Pathak, S. K. Choi, N. Arnheim, M. E. Thompson, J. Am. Chem. Soc. 123 (2001) 4103 26.
(48) [21] S. Kim, M. G. Bawendi, J. Am. Chem. Soc. 125 (2003) 14652. [22] W. Guo, J. J. Li, Y. A. Wang, X. G. Peng, Chem. Mater. 15 (2003) 3125. [23] F. Pinaud, D. King, H. P. Moore, S. Weiss, J. Am. Chem. Soc. 126 (2004) 6115. [24] X. Y. Wu et al., Nature Biotechnol. 21 (2003) 41. [25] X. Gao, Y. Cui, R. M. Levenson, L. W. K. Chung, S. Nie, Nature Biotechnol. 22 (2004) 969. [26] D. Gerion, J. Phys. Chem. B 105 (2001) 8861. [27] B. Dubertret, Science 298 (2002) 1759. [28] X. Gao, W. C. W. Chan, S. Nie, J. Biomed. Opt. 7 (2002) 532. [29] T. Pellegrino, L. Manna, S. Kudera, T. Liedl, D. Koktysh, A. L. Rogach, S. Keller, J. Ra1dler, G. Natile, and W. J. Parak, Nano Lett.,4 (2004) 703. [30] F. Osaki, T. Kanamori, S. Sando, T. Sera, Y. Aoyama, J. Am. Chem. Soc. 126 (2004) 6520. [31] H. Mattoussi, J. Matthew Mauro, E. R. Goldman, G. P. Anderson, V. C. Sundar, F. V. Mikulec, M. G. Bawendi J. Am. Chem. Soc. 122 (2000) 12142. [32] B. Sun, W. Xie, G. Yi , D. Chen , Y. Zhou , J. Cheng, Journal of Immunological Methods 249 (2001) 85. [33] M. A. Petruska, A. P. Bartko, V. I. Klimov, J. Am. Chem. Soc. 126 (2004) 714. [34] Y. Wang, Z. Tang, M. A. Correa-Duarte, I. Pastoriza-Santos,| M. Giersig, N. A. Kotov, L. M. Liz-Marzan, J. Phys. Chem. B , 108 (2004)15461. [35] M. Jones, J. Nedeljkovic, R. J. Ellingson, A. J. Nozik, G. Rumbles, J. Phys. Chem. B , 107 (2003) 11346. [36] G. Gilardi, L. Q. Zhou, L. Hibbert, A. E. Cass, Anal. Chem. 66 (1994) 3840. [37] J. S. Marvin, E. E. Corcoran, N. A. Hattangadi, J. V. Zhang, S. A. Gere, H. W. Hellinga, Proc. Natl. Acad. Sci. U.S.A. 94 (1997) 4366. [38] S. A. Trammell, H. M. Goldston, P. T. Tran, L. M. Tender, D. W. Conrad, D. E. Benson, H. W. Hellinga, Bioconjugate Chem. 12 (2001) 643. [39] D. E. Benson, D. W. Conrad, R. M. De Lorimer, S. A. Tramell, H. W. Hellinga, Science, 292 (2001) 1641. 27.
(49) [40] M. Fehr, W. Frommer, S. Lalonde, Proc. Natl. Acad. Sci. U.S.A. 99 (2002) 9846. [41] M. G. Sandros, D. Gao, D. E. Benson, J. Am. Chem. Soc. 127 (2005) 12198. [42] L. Shi, V. De. Paoli, N. Rosenzweig, Z. Rosenzweig, J. Am. Chem. Soc. 128 (2006) 10378.. 28.
(50) Chapter 2 Synthesis the watersoluble CdSe/ZnS quantum dots and their application Abstract: The mercaptosuccinic acid (MSA), which contains a thio group and two carboxyl groups, are easily to replace and stablize the surface of QDs. Fluorescence emission wavelength can be tuned by modifying the size of QDs particles, and the type of capping molecules, which are responsible for modification of the surface charges for bimolecular coupling. An original and novel assay system with urease or glucose oxidase (GOD) as a catalyst and CdSe/ZnS quantum dots (QDs) as an indicator has been developed for quantitative analysis of urea or glucose. By mixing urease (or glucose oxidase) and QDs, the determination of urea (or glucose) can be performed in a quantitative manner. The detection is based on the enhancement (or quenching) of QD photoluminescence (PL) intensity, which is correlated to the enzymatic degradation of urea (or glucose). The glucose assay system can also provide convenient way to estimate glucose concentration by visualizing the color change of QDs. These newly developed systems possess many advantages, including simplicity, low cost, high flexibility, and good sensitivity.. Furthermore, no chemical modification and enzyme. immobilization were needed in this system.. 29.
(51) 2.1. Introduction Colloidal semiconductor nanocrystals or quantum dots (QDs) have. attracted much interest in the areas of fundamental research and technical applications, because of their tunable photoexcitation depend on the size and emission, which is associated with narrow and symmetric luminescence spectra [1–5]. Advances in surface passivation and additional confinement of excitonic states by coating the native core with a thin layer of a semiconductor with a larger bandgap substantially improve the fluorescence quantum efficiency, such that the resulting core-shell QDs have PL quantum yields that are similar to those of organic dyes [6–14]. Unfortunately, conventional organic dyes used in diagnostics application and biological labeling reagents commonly have characteristics that limit their effectiveness in such applications. Organic fluorophores have narrower excitation bands and broader emission spectra than CdSe QDs. Therefore; QDs have become extremely popular due to their unique optical properties. However, the high quality luminescences QDs were hydrophobic and insoluble into aqueous solution. Using mercaptoacetic acid ligands was one of the first strategies applied to produce water soluble QDs [15]. Since then, a number of other thioalkyl acid ligands including 3-mercaptopropionic acid [16-18] and dihydrolipoic acid [19-21] have been used. Self-assembly of these ligands on the surface of a CdSe/ZnS QD proceeds with a metal–thiol affinity interaction and orients the ligands such that the carboxyl groups are exposed to the surrounding aqueous 30.
(52) solution. Under sufficiently basic conditions, the carboxyl groups are deprotonated and render the QD water-soluble. Other thiol-based approaches. have. been. used,. including. thioglycerol. [22-23],. 2-mercaptoethane sulfonate [24], and thiol-terminated polyethylene glycol [25]. In this study, we use the mercaptosuccinic acid (MSA) to replace the hydrophobic surfactant (HDA) on the QDs surface. The structure of MSA assembled on the surface of QD is shown in Figure 2.1 Considering stability, the MSA would be expected to be the stable since it has two ionizable carboxyl groups. Fluorescence emission wavelength can be tuned by modifying the size of QDs particles, and the type of capping molecules, which are responsible for modification of the surface charges for bimolecular coupling. The hybrid systems containing QDs coupled with various bio-molecules stimulate growing interests in the research areas of biotechnology and nanotechnology.. Figure 2.1 The structure of MSA assembled on the surface of QD. 31.
(53) Through the bioconjugation of QDs, hybrid materials have demonstrated both unique optical properties of QDs and high specificities toward biomolecules, such as oligonucleotides and proteins [16-18]. In addition to application in imaging, QDs were recently demonstrated to be good “indicators” for enzymatic hydrolysis of paraoxon [26-27]. It was found that a subtle change of the surface property of QDs could result in a dramatic change in their optical properties. In principle, this novel feature of QDs can be extended for detecting specific analytes if appropriate conditions are established. Urea in blood or in urine is an important substance in the diagnosis of renal and liver diseases. The detection of urea is performed frequently in the medical care. Normal level of urea in serum is in the range of 2.5-6.7 mM. In patients suffering from renal insufficiency, urea concentration in serum may be as high as 30-80 mM. With such a urea level, hemodialysis is required [28]. For urea detection, biosensors based on the potentiometry and amperometry were previously investigated and reported [29-33]. However, the complexity of sensor fabrication is a common drawback often mentioned in the literature. Determination of glucose concentration takes a relevant place in controlling various food and biotechnological processes as well as in diagnosing many metabolic disorders.. Among various methods. employed to this aim, the utilization of glucose oxidase (GOD) to produce hydrogen peroxide from glucose and further couple with the applications of potentiometry, amperometry, or optical method to analyze the amount of hydrogen peroxide is the most common strategy [34-36].. Using fluorescence technique it is recently developed an 32.
(54) alternative approach to sense glucose.. For example, Schultz and. coworkers developed a competitive glucose assay that does not consume glucose by the optical detection [37-38].. The sensing. principle was based on fluorescence resonance energy transfer (FRET) between a fluorescence donor and an acceptor, each covalently linked to concanavalin A (ConA) or dextran. The presence of glucose resulted in its competitive binding to ConA consequently released from the dye-labeled dextran, thus, decreased in the FRET efficiency.. Although. early results of this technique have gained considerable enthusiasm for fluorescence sensing of glucose [38-40], the complexity of chemical modification on protein is an evident drawback.. Another case of. glucose detection by FRET technique was designed based on spontaneous formation of viologens/pyramine complex, in which the boronic acid-substituted 4,7-phenanthrolinium viologens was used to quench the fluorescence of pyranine.. In the presence of glucose, the. complex dissociates, resulting in a large increase in the fluorescence [41].. Unfortunately, some complicated procedures are required for. synthesizing the counterparts of the complex. In this study, we describe a simple scheme for preparation of a urea-sensing. system,. which. is. composed. of. water-soluble. mercaptosuccinic acid (MSA)-QDs and urease; it allows effective and quantitative detection of urea. Furthermore, a new approach for glucose analysis was designed using QDs as a sensitive “indicator”.. An assay. system containing glucose oxidase (GOD) and CdSe/ZnS quantum dots (QDs) was developed for quantitative analysis of glucose without chemical modification on protein or QDs. 33.
(55) 2.2. Material and Methods. 2.2.1. Instruments and Chemicals. A Hitachi. U-3010A UV-Visible. spectrophotometer. and. a. Jobin-Yvon Spex Fluolog-3 spectrophotometer were used to investigate the fluorescence characteristics of the samples. The pH meter (IQ120) was purchased from IQ Scientific, USA. All chemicals were of analytical grade or highest purity available. Chloroform, methanol (all anhydrous, Aldrich), cadmium oxide (CdO, Aldrich), selenium (Se, Aldrich), tri-n-butylphosphine (TBP, Showa), n-hexadecylamine (HDA, Lancaster), stearic acid (SA, Lancaster), diethyl zinc (1M solution in toluene, Aldrich), sulfur powder (S, Aldrich), D,L-mercaptosuccinic acid (MSA, Acros), and tetramethylammonium hydroxide 25% by weight in methanol (TMAOH, Acros) were used as received. Urease (E.C. 3.5.1.5.), Glucose oxidase (E.C. 1.1.3.4.) and D-glucose were purchased from Sigma. 2.2.2. Synthesis of water-soluble MSA-capped CdSe/ZnS QDs Luminescent CdSe/ZnS QDs were synthesized according to the. previously reported procedures [2, 6, 7].. However, MSA was selected. as the surface-capping reagent to form water-soluble QDs.. 30 mg of. CdSe/ZnS QDs were suspended in 10 mL of methanol and transferred to a reaction vessel.. Then, a separated 50 mL methanolic solution of. 1M MSA was added to the above-mentioned QD-containing solution 34.
(56) and. the. pH. of. the. solution. was. adjusted. tetramethylammonium hydroxide pentahydrate.. to. 11. with. The mixture was then. refluxed at 60˚C overnight under N2, and the sample was stored in the dark.. The QDs were precipitated with anhydrous ether, centrifuged at. 6000 rpm, and the supernatant was decanted to remove the organic solvent.. Methanol was added to wash the precipitant four times.. The. precipitant was re-suspended in a phosphate buffer (10 mM or 30 mM, pH 8.0) and stored in the dark [7,14,42]. 2.2.3. Assay conditions and PL measurements for urea indicator. For studying the pH effect on the PL intensity of the MSA-QD, a series of samples with different basicity (pH 8, 8.4, 9.5, 10.3, 11.0, 11.5) were prepared by adding various amount of NaOH (0.1 M) and water to a 200 µl MSA-QDs solution (20 mM phosphate buffer, pH 8) to reach a final volume of 300 µl and the amount of MSA- QDs employed was controlled by the absorption at 565 nm with final 0.6 OD.. For urea. determination, the assay solutions containing urease (1.33 units), MSA-QD (final 0.3 OD observed at 565 nm), and various concentrations of urea (0-120 mM) were prepared in 300 µl of phosphate buffer (20 mM, pH 8.0).. Reactions were performed for 10. min before spectrophotometric analysis and acidity (pH) measurements. The PL intensity was measured by using the Jobin-Yvon Spex Fluolog-3 spectrophotometer with 365 nm He/Ne light source to excite MSA-QDs.. 35.
(57) 2.2.4. Assay conditions and PL measurements for glucose indicator For all tests and reactions, the experiments were repeated at least 3. times to ensure the accuracy of the measurement.. To study the effect. of pH on the PL intensity of the MSA-CdSe/ZnS QDs, a series of samples with different pH values (pH 3.5~ 11.6) were prepared by adding various amount of HCl (0.1 M) or NaOH (0.1 M) and water to a 200 µL MSA-CdSe/ZnS QDs solution (10 mM phosphate buffer, pH 8.0) to reach a final volume of 300 µL.. Glucose oxidase and glucose. solution were prepared in high concentration in phosphate buffer (10 mM or 30 mM, pH 8.0) for further study. For all experiments, the total volume of the sample was 300µL and the amount of MSA-CdSe/ZnS QDs employed was controlled by the absorption at 574 nm with final 0.3 OD.. For assay system, glucose oxidase (13.5 units) was added to. the solution containing QDs and various concentration of glucose. Reactions were performed for 30 min before spectrophotometric analysis and acidity (pH) measurements.. The PL intensity was. monitored at 586 nm through out all experiments.. The Jobin-Yvon. Spex Fluolog-3 spectrophotometer with excitation wavelength set at 365 nm (He/Ne light source) was employed.. 2.3. Results and discussion. 2.3.1. Optical characterization of MSA capped CdSe/ZnS The water-soluble, MSA functionalized, CdSe/ZnS QDs were 36.
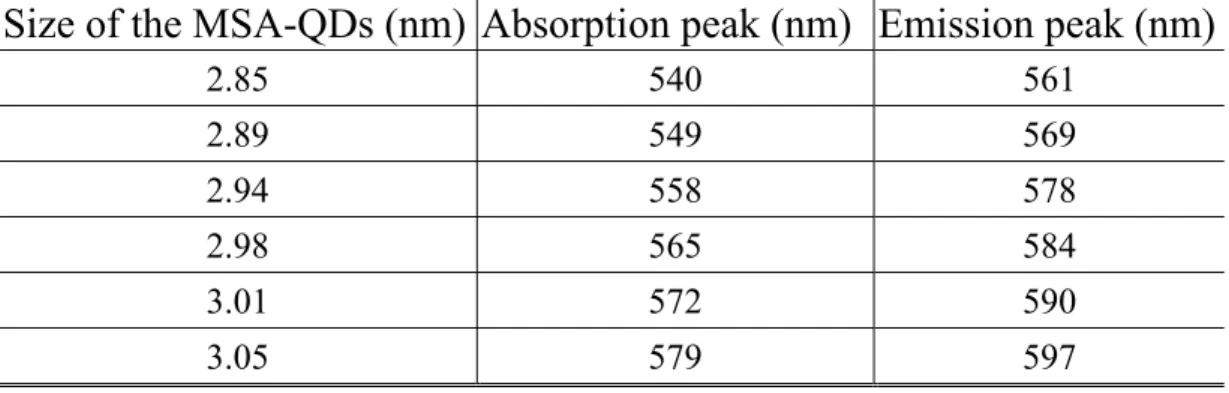
(58) successfully synthesized according to the protocol described in the Material and Methods. The optical properties of MSA-QDs in 50 mM phosphate buffer solution are shown in Figure 2.2 (a-b). The data are summarized in Table 2.1. The optical properties of MSA-QDs have significantly red-shift (~5 nm), which cause from trap-states on the QDs surface, as compared with the HDA capped QDs. Additionally, the photoluminescence peaks are symmetric and, unlike the organic dye, does not exhibit red tails. Full width at half-maximum (FWHM) of 25 nm ± 5 nm are obtained, enabling effective distinction between different colors emission. The narrow emission spectrum indicated that high degree of monodispersity of QDs was present. In the urea and glucose indicator application, we used the MSA-QDs with a characteristic peak at 560 nm (574 nm) and a narrow emission band centered at 580 nm (586 nm), respectively.. (a). (b). Figure 2.2 (a) The absorption spectrum (b) photoluminescence spectrum of MSA-QDs with different size in 50 mM phosphate buffer solution. 37.
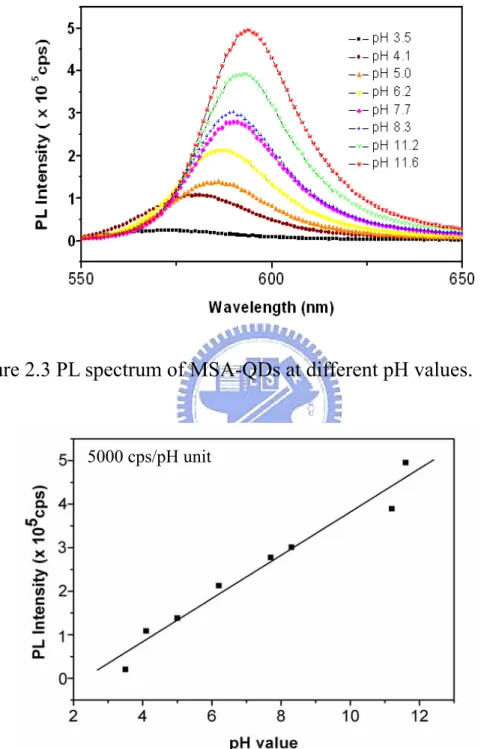
(59) Table 2.1 Summering the characterizations of optical and size with MSA-QDs Size of the MSA-QDs (nm) Absorption peak (nm) Emission peak (nm). 2.3.2. 2.85. 540. 561. 2.89. 549. 569. 2.94. 558. 578. 2.98. 565. 584. 3.01. 572. 590. 3.05. 579. 597. Influence of pH on luminescence of MSA-CdSe/ZnS It has been proposed that the PL intensity of water-soluble. MSA-QDs was sensitive to acidity (or basicity) of the environment [38]. Our investigation confirmed this finding.. A series of fluorescence. spectra of QDs in different pH conditions (3.5 – 11.6) were measured and the results showed that the PL intensity and the emission spectra were significantly perturbed by pH condition. As pH value varied from 8.3 to 3.5, the PL intensity of QDs was quenched and the emission spectrum was blue-shifted (Figure 2.3). The quenching phenomenon and the blue-shifted of emission peak (~10 nm) were very likely due to the etching process occurring on the surface of QDs.. On the other. hand, the PL intensity was found to increase when the pH was increased from 8.3 to 11.6 (Figure 2.3).. The observed PL enhancement might. result from the reduction of non-radiative recombination by minimizing the surface defects of QDs, which consequently confined the wave function of electron-hole pairs inside the nanocrystals. Figure 2.4 38.
(60) exhibited the PL intensity of QDs, which was found to linearly correlate to the pH value with a factor of approximately 5000 cps/pH unit.. Figure 2.3 PL spectrum of MSA-QDs at different pH values.. 5000 cps/pH unit. Figure 2.4 The correlation between pH value and the PL intensity monitored at 586 nm of QDs. 39.
(61) 2.3.3 Photoluminescence spectroscopy for the detection of urea CdSe/ZnS QDs are potentially useful in sensor design, as they possess. a. significant. response. in. fluorescence. and. a. high. surface/volume ratio. Since the PL intensity of QDs was found to correlate with the acidity (or basicity) of the environment, it was expected that QDs could be used as an indicator in monitoring biochemical reactions associated with pH change. For examining the feasibility of such an application, we have designed a system of enzymatic analysis of urea.. Since the urease-catalyzed hydrolysis of. urea releases NH4+, OH- and HCO3- ions as products (see equation 1), the pH value of the assayed sample gradually increases as the urea degradation occurs.. (NH2)2CO + 3 H2O ⎯⎯⎯→ 2NH4+ + OH- + HCO3urease. (1). Figure 2.5 exhibits the variation of PL intensity of MSA-QDs as a function of urea concentrations (0~120 mM) under urease catalysis in 20 mM phosphate buffer with pH 8.0.. The emission spectra were. recorded using the excitation wavelength (λex) of 365 nm.. The results. indicated that the PL intensity of MSA-QDs was enhanced with increasing urea concentration. Figure 2.6 was plotted by the ratio of PL enhancement, (I-Io)/Io, versus urea concentration. An approximately linear relationship can be observed with the urea concentration lower than 100 mM.. Since the PL intensity is perturbed by the acidity, it is. of interest to measure both the change of PL intensity and the final 40.
(62) acidity of a reaction, simultaneously. The response of acidity measured by pH meter was found to be linear at low urea concentration (0-15 mM) and to maintain at pH 9.5 when the substrate concentration was higher than 20 mM. However, interestingly, the PL intensity of MSA-QDs showed approximately linear response for urea concentration up to 100 mM. Clearly, when the acidity of an assay system approaches its thermodynamic steady-state, the micro-environment of MSA-QDs is continuously changed.. One of the possible situations is that the MSA. moiety on the surface of QD may be removed through the substitution reaction of hydroxide, which is produced from the urea degradation. Consequently, the PL intensity is enhanced owing to the increased amount of less MSA-coated QDs, which has been shown to be stronger in fluorescence intensity [15,39].. Figure 2.5 The variation of PL spectra of urease/QDs with urea concentration. Reactions took place in 20 mM pH 8.0 buffer. Note that, the spectra obtained from the reactions with 100 and 120 mM of urea are nearly superimposed.. 41.
(63) Figure 2.6 The variation of pH value and PL intensity with urea concentration. Urea was analyzed by the urease/QDs sensing system in 20 mM pH 8.0 buffer, in which the pH value (□) and the PL perturbation (■) were determined. Io and I represent the PL intensity of MSA-QDs observed at 580 nm with the reaction at zero time and at the end-point, respectively.. In order to evaluate other possible interferences in this system, urease, urea, NaCl, and NH4+ were incubated with MSA-QDs separately. No significant perturbation on PL intensity was observed (data not shown) when urease, urea, NaCl and NH4+ were added up to 2.5 units and 100 mM, 1000 mM, 20 mM, respectively. We concluded that the change of PL intensity of our system is indeed solely owing to the product(s) of the catalytic reaction. With this newly developed system, urea concentration can be analyzed in a broad range (0.01 to 100 mM). The designed system is very promising for urea analysis in biological systems as compared with many other currently existing methods. Table 2.2 summarizes the detection limits of urea with various methodologies 42.
(64) including amperometry, potentiometry and optical spectroscopy and the present study. Clearly, the current method exhibits great potential for urea sensing with a wide detection range.. Table 2.2 Comparison of performance of different urea sensors. Type. Sensing matrix. Linear range. Limiting. (mM). detection. Ref. (mM) Amperometry. Potentiometry. Polytoluidine blue film. 0.02-0.8. 0.02. [29]. PVC ammonium electrode. 15- 80. 15. [30]. PNVK/SA/urease LB film. 0.5-68. 0.5. [31]. Polyvinylalcohol /. 0.089-1.1. 0.089. [32]. 0.2-6. 0.2. [33]. 0.01-120. 0.01. This study. 2-fluoro-1methylpyridiniumtoluene-4sulphonate/urease Urease+ polyurethane-acrylate Optical. Urea/MSA-QDs. 43.
(65) 2.3.4 Influence of GOD on photoluminescence of MSA- QDs For understanding the possible influence of GOD on the PL intensity of QDs, the fluorescence of GOD was investigated.. With. excitation at 365 nm, a broad fluorescence spectrum (410 to 600 nm) with two peaks centered at 450 and 520 nm was observed.. These. characteristic bands confirmed the presence of flavin adenine dinucleotide (FAD, a prosthetic group) in GOD [45-49].. Since the. emission spectrum of FAD was observed to overlap with the absorption band of QDs, the fluorescence resonance energy transfer (FRET) should be taken into account in the assay system (Shown in Figure 2.7).. A. simple examination was performed to evaluate the influence of GOD to the PL intensity of QDs.. As anticipated, the presence of GOD. significantly enhanced the PL intensity of QDs.. Figure 2.8. demonstrated such linear relationship with the increment of 2300 cps per unit of GOD.. Although the PL enhancement may not be solely due. to the process of FRET, it is closely related to the presence of GOD.. 44.
(66) Figure 2.7 UV-Visible and photoluminescence spectra of the MSA-CdSe/ZnS QDs and GOD. The spectra drew by dash line, dot line, and solid line, were the absorption spectrum of QDs, emission spectrum of QDs, and emission spectrum of GOD, respectively. All measurements were performed in 10 mM phosphate, pH 8.0.. The. excitation wavelength was 365 nm.. Figure 2.8 The influence of GOD in PL enhancement of MSA-CdSe/ZnS QDs.. The enhancement of PL intensity was linear. to the added GOD. 45.
(67) 2.3.5. Photoluminescent spectroscopy of the detection of glucose. Since the PL intensity of QDs was found to be sensitively influenced by the acidity (or basicity) of the environment, we proposed that the MSA-CdSe/ZnS QDs should be potentially useful for assays that produce acidic or basic product. To examine the feasibility of such proposal, we designed an assay system specifically for glucose analysis. In this system, GOD was used to catalyze the oxidation of glucose to release H2O2 and gluconolactone.. The latter was then rapidly. hydrolyzed to form D-gluconic acid and, consequently, lowered the pH value of the assay system. The catalytic reactions can be depicted in equations (1) and (2) as represented below GOD D-glucose +O2 ⎯⎯ ⎯→ D-gluconolactone + H2O2. (1). D-gluconolactone + H2O → D-gluconic acid. (2). Figure 2.9 exhibited the variation of fluorescence spectra of various assay reactions as a function of glucose concentration (0.2 to 10 mM).. Note that, the fluorescence spectra, with excitation at 365 nm,. were taken at the end-point of the enzymatic reaction that occurred in 10 mM of phosphate buffer, pH 8.0. The quenching of PL intensity of MSA-CdSe/ZnS concentration.. QDs. was. observed. with. increasing. glucose. The catalytic oxidation of glucose also resulted in. spectral shifts toward shorter wavelengths in the PL spectra.. Since. acids were found to be able to slowly etch QDs [49], the blue-shifted emission spectra were presumably attributed to the particle size reduction as more acid was produced. 46.
(68) Figure 2.9. The emission spectra of the assay samples at the end-point. of the reaction.. The assay system contained GOD, QDs, and the tested. glucose with concentration 0, 0.2, 0.6, 2, 6, 8, 10 mM.. Reactions. were performed at 10 mM phosphate buffer, pH 8.0 for 30 min.. The. emission spectra were recorded under excitation with 365 nm lights.. Figure 2.10 represented the experiments of PL quenching and the pH values as a function of glucose concentrations oxidized in two different buffer systems, 10 mM and 30 mM phosphate, pH 8.0.. The. data obtained from the assay system of 10 mM phosphate, pH 8.0 were directly derived from Figure 2.7. The quench ratio of PL intensity was defined as 100 (Io-I)/Io, where Io and I represented the PL intensity of QDs observed at 586 nm with the reaction at zero time and at end-point, respectively. When the assays were performed in 10 mM phosphate, the quench ratio of PL intensity, [(Io-I)/Io], was found to be proportional to glucose concentration in the range of 0.2 to 10 mM, while at higher glucose concentration (>15 mM) the quenching effect was leveled-off. 47.
(69) (data not shown), suggesting that the capacity of QDs be insufficient to reveal the existing acid.. Figure 2.10 Correlation between the quench ratio of PL intensity, pH perturbation and the tested glucose concentration.. Two assay system,. 10 mM and 30 mM phosphate, pH 8.0, were employed.. The data. obtained from the assay system using 10 mM phosphate were directly derived from fig.6.. The quench ration of PL intensity was defined as. 100 (Io-I)/Io, where Io and I represented the PL intensity of QDs observed at 586 nm with the reaction at zero time and at end-point, respectively. The data shown by open circle (○) and open square (□) were the pH measurements of the reactions assayed in 10 mM and 30 mM phosphate, respectively. The data shown by filled circle (●) and filled square (■) were the quench ratio of PL intensity obtained in 10 mM and 30 mM phosphate system, respectively.. 48.
(70) To solve such a problem, one could use higher concentration of QDs.. Alternatively, increasing buffer concentration was suggested.. For that, the gluconic acid produced at early stage of reaction will be consumed by the buffer and allow QDs to effectively function as an indicator to track and reveal the later stage of reaction.. The assay. system using 30 mM phosphate, pH 8.0 was found to be suitable for glucose concentration ranging from 2 to 30 mM. The pH value of each reaction in both the 10 mM and 30 mM buffer systems also consistently showed the correlation between the fluorescence quenching and the amount of glucose measurement. Our assay system can also provide a convenient way for the determination of glucose concentration by visualizing color change of QDs fluorescence.. Figure 2.11 exhibited series of fluorescence images. for various glucose analytes obtained from 0 to 14 mM in the 10 mM buffer system.. The fluorescence of the reaction samples, irradiated. with 365 nm light, resulted in the color change from pale orange to bright, yellowish green when glucose concentration was increased from 0 to 14 mM.. Two breaking points between 0.6 mM to 2 mM and 10. mM to 12 mM were clearly observed, respectively. With appropriate control of the buffer system, it is feasible to develop a simple assay kit for semi-quantitative determination of glucose without using expensive instrumental setup.. 49.
(71) [Glucose] (mM). Figure 2.11 Fluorescent photos of the assay samples. excited by 365 nm sources.. Samples were. The assay conditions were identical to. those described in Fig. 2.9.. 2.4. Conclusions We have demonstrated that the water-soluble MSA-QDs can be. utilized as a reliable agent for the enzymatic determination of urea and glucose concentration. The MSA-QDs exhibit linear response in PL intensity when urea with concentration ranging from 0.01 to 100 mM was analyzed. Additionally, with this new approach, glucose can be successfully analyzed with wide range of concentration. As compared with other urea and glucose sensors (indicator) reported in the literature, the MSA-QD-based biosensor exhibits several advantages, such as the ease of its fabrication, low cost, no enzyme immobilization process required, high flexibility, and good sensitivity. It offers a persuasive way to determine the urea and glucose concentration without using complicate instrumental application.. 50.
數據
![Figure 1.4 Nanocrystal surrounded by TOPO chains anchored to its surface [12].](https://thumb-ap.123doks.com/thumbv2/9libinfo/8761634.208321/26.892.258.591.192.505/figure-nanocrystal-surrounded-topo-chains-anchored-surface.webp)
![Figure 1.5 Bared CdSe QDs and inorganic surface passivation core/shell QDs (a) organic matrix (b) CdS shell (c) ZnS passivation on CdSe surface [13-15]](https://thumb-ap.123doks.com/thumbv2/9libinfo/8761634.208321/27.892.215.692.324.707/figure-bared-inorganic-surface-passivation-organic-passivation-surface.webp)
+7
![Figure 1.9 Formation of the polymer-QD complex showing an idealized micellar polymer shell (40% octylamine-modified PAA) encapsulating the QDs [34]](https://thumb-ap.123doks.com/thumbv2/9libinfo/8761634.208321/33.892.184.724.480.704/figure-formation-polymer-idealized-micellar-octylamine-modified-encapsulating.webp)
相關文件
A trait implementation class which contains the definitions for the provided methods of the trait, proxy fields for the user of the trait and all used traits, as well as
² Stable kernel in a goals hierarchy is used as a basis for establishing the architecture; Goals are organized to form several alternatives based on the types of goals and
We do it by reducing the first order system to a vectorial Schr¨ odinger type equation containing conductivity coefficient in matrix potential coefficient as in [3], [13] and use
The existence and the uniqueness of the same ratio points for given n and k.. The properties about geometric measurement for given n
• To introduce the use of the LPF as a tool for planning the school English Language curriculum; and
Understanding and inferring information, ideas, feelings and opinions in a range of texts with some degree of complexity, using and integrating a small range of reading
How would this task help students see how to adjust their learning practices in order to improve?..
As each school has its unique school context, including its organisation of the JS and SS curriculum, experience in conducting PL, self-directed learning atmosphere,
Wang, Solving pseudomonotone variational inequalities and pseudocon- vex optimization problems using the projection neural network, IEEE Transactions on Neural Networks 17
