Competitive Adsorption of Ferricyanide and Ferrocyanide
on
γ
-Al
2O
3Surface
Wen Po Cheng,∗,1Chihpin Huang,† and Yi Chuan Chien†
∗Department of Safety, Health and Environmental Engineering, National Lien-Ho Institute of Technology, Miaoli, Taiwan 36012, Republic of China;
and†Institute of Environmental Engineering, National Chiao Tung University, Hsinchu, Taiwan, Republic of China
Received August 9, 1999; accepted December 13, 1999
In the past 3 decades, research has proven the significance of com-petitive adsorption in the equilibrium of pollutants between solid and liquid phases. However, studies on the competitive adsorption of complex ions are very limited in spite of its important role in transporting pollutants in the natural environment. The objective of this study is to derive the thermodynamic parameters of the com-petitive adsorption between ferricyanide and ferrocyanide from the modified Langmuir isotherm and the triple-layer model (TLM) to determine the location of adsorption. The effects of pH, tempera-ture, and ion concentration on competitive adsorption ontoγ-Al2O3 were investigated. The results demonstrate that ferrocyanide is more competitive than ferricyanide. By comparing the derived Kapp with Kint, we inferred that the adsorption of ferricyanide and ferro-cyanide ontoγ-Al2O3was achieved through outer-sphere complex-ation. The negative1H◦indicated that the adsorption was exother-mic. The positive entropy (1S◦) was caused by the replacement and release of a greater number of smaller surface ions by adsorbed ferricyanide and ferrocyanide ions of larger size. °C2000 Academic Press Key Words: competitive adsorption; complexation; ferricyanide; ferrocyanide; inner sphere; outer sphere.
INTRODUCTION
Many new pollutants are being introduced into our environ-ment as the developenviron-ment of the industry continues. Among them, cyanide compounds, which are widely used in the electroplat-ing industry, have received great attention because of their high toxicity. In nature, cyanides exist in either free form or complex forms with metal ions (i.e., Fe, Cu, and Zn). The iron-complexed cyanide compounds are unstable in the sunlight, and the free cyanide is released back into nature through photolysis (1, 2). Therefore, iron–cyanide complexes cannot be considered safe.
In the past few years, studies on competitive adsorption have focused on the behaviors of anions, cations, and organic sub-stances on soil or metal oxides. Lopez-Hernandez et al. (3) ex-amined the competition between organic chelating compounds and phosphate on the soil and discovered that phosphate adsorp-1To whom correspondence should be addressed. Fax: 886-3-7333187. E-mail: [email protected].
tion was reduced, possibly due to the blocking of the surface site by low-molecular-weight aliphatic or aromatic acids. Violant et al. (4) conducted a similar study on oxalate and phosphate and found that the sequence of anion addition strongly influ-enced the adsorption of both anions. Attention has also been drawn to the competitive adsorption of pollutants on activated carbon which is an efficient adsorbent for trace contaminants in water. Gabaldon et al. (5), in the study of the competitive ad-sorption of Cd and Zn onto the granular activated carbon (GAC), found that the removal of both metals decreased in the compet-itive system. By applying the surface complexation constants of individual adsorbates determined with the triple-layer model (TLM), they successfully predicted the removal of Cd and Zn from solutions containing both metal ions.
The surface chemistry of aluminum oxide, Al2O3, has been a
subject of interest, not only because it is one of the most abun-dant oxide minerals in the natural system but also because it constitutes the surface layer of a wide variety of industrial mate-rials. Aluminum oxide has been used in numerous studies about adsorption because of the homogeneity and stability. In particu-lar, the coordination chemistry approach has been successfully applied to explain the interactions between cations and anions under monolayer coverage at the aqueous/oxide interface. The TLM developed by Hayes and Leckie allows metal ions and an-ions to form an inner-sphere complexation at the surface layer (o-plane) or outer sphere at the compact layer (β-plane) (6–9). Kanungo (10) suggested that the location of the ion complex on the oxide surface can be determined by comparing the apparent adsorption constant (Kapp) from the Langmuir isotherm with the
intrinsic adsorption constant (Kint) from the TLM; the Kappand
the Kintdiffer in an electrostatic term [exp(9 F/RT )]. In
gen-eral, for cations adsorption on a metal oxide surface, a greater Kint than Kapp suggests inner-sphere complexation. The Kint
can be calculated from the HYDRAQL developed by Papelis et al. (11).
The objective of this study is to derive the thermodynamic parameters of the competitive adsorption between ferricyanide and ferrocyanide under various pHs temperatures, and ion con-centrations using the modified Langmuir isotherm and the TLM, to determinate the location of the complex ion adsorption.
291 0021-9797/00 $35.00
Copyright°C2000 by Academic Press All rights of reproduction in any form reserved.
MATERIALS AND METHODS Materials
γ -Aluminum oxide (γ -Al2O3), supplied by Japan Aerosol
Co., was produced from the hydrolysis of AlCl3 in the flame
process. The oxide particle was smaller than 1µm in diameter and apparently uniform. The aluminum oxide was pretreated with the procedure suggested by Hohl and Stumm (12). Oxide impurities were first removed with 0.1 N NaOH and followed by washing with Milli-Q distilled water for several times. The solid was dried in an oven at 103◦C overnight. Stock solutions of K4Fe(CN)6 and K3Fe(CN)6 were prepared from analytical
grade reagents (Riedel de Haen). Batch Adsorption
In a 100-ml PE bottle, 0.125 g ofγ -Al2O3in 50 ml of 0.01 M
NaClO4were mixed with an appropriate amount of the complex
ion stock solutions. The initial concentrations of ferricyanide and ferrocyanide were ranging from 0.5 × 10⁻⁴to 4.0 × 10⁻⁴M. The pH was adjusted from 3 to 12 with HNO3 or NaOH, and
the reaction was carried out on a thermostat shaker for 24 h. At the end of the reaction, the pH of the samples was measured and the solid was removed by membrane filtration with a 0.2-µm filter. The filtered supernatant was analyzed for Fe(II) and Fe(III) by ion chromatography with the conductivity detector purchased from DIONEX Co. The ion pair column was MPIC-NS1, and the eluent consisted of 0.002 M TBAOH, 0.0002 M Na2CO3,
and 35% (v/v) acetonitrile with a 1 cm3/min flow rate.
RESULTS AND DISCUSSION Effect of pH on Competitive Adsorption
An equal amount of ferricyanide and ferrocyanide, ranging from 5.0 × 10⁻⁵to 2.0 × 10⁻⁴M, were added to PE bottles con-tainingγ -Al2O3 and the pH was adjusted from 3 to 10. After
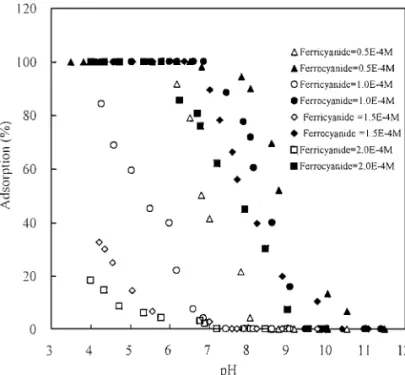
24 h of adsorption, the amount of complex ions left in the solu-tion were determined. In Fig. 1, it shows that the adsorpsolu-tion of both ferricyanide and ferrocyanide decreases with the increas-ing solution pH. This is because that at higher solution pH less AlOH+2 sites on theγ -Al2O3surface are available, and the
sur-face becomes more negatively charged which discourages the adsorption of anions on the oxide surface. When the adsorption percentage was converted to the adsorption capacity (mol/g), as shown in Fig. 2, it is obvious that ferrocyanide is much more competitive than ferricyanide under all experimental conditions due to its higher electric charge. Figure 2 also shows that the adsorption capacity of ferrocyanide increases with the adsor-bate concentration, while the opposite result is observed in that of ferricyanide. This can be explained by the limited adsorp-tion sites at a particular pH. At a higher adsorbate, more surface sites were occupied by the more competitive ferrocyanide which left ferricyanide with less available sites. This phenomenon was especially significant at low pH (<7), where the adsorption of ferrocyanide nearly reached 100%. The temperature effect on
FIG. 1. Sorption percentage of ferricyanide and ferrocyanide ontoγ -Al2O3 as a function of pH and initial concentration.
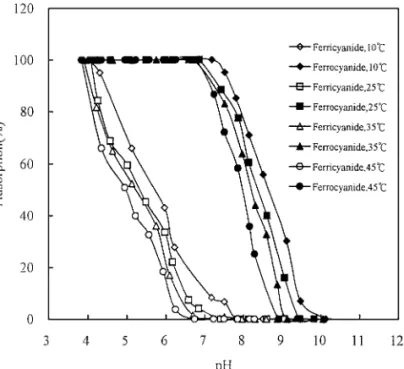
the competitive adsorption of ferricyanide and ferrocyanide was conducted with an initial concentration of 1.0 × 10⁻⁴ M under four temperatures (10, 25, 35, and 45◦C). The result is presented in Fig. 3. A significant decrease in the adsorption ability of both complex ions was observed at a higher solution temperature, which suggested that the adsorption is exothermic.
Modified Langmuir Isotherm
In our previous work (13–15), we studied the individual ad-sorption of ferricyanide (Fe(CN)36−) or ferrocyanide (Fe(CN)46−)
FIG. 2. Sorption capacity of ferricyanide and ferrocyanide ontoγ -Al2O3 as a function of pH and initial concentration.
FIG. 3. Sorption percentage of ferricyanide and ferrocyanide ontoγ -Al2O3 as a function of pH and temperature.
onγ -Al2O3and developed the modified Langmuir isotherm to
accurately predict the equilibrium partition between the metal oxide and liquid phases. The adsorption of ferricyanide and fer-rocyanide onγ -Al2O3can be described as
AlOH+ Fe(CN)n6−+ mH+ ↔ AlOH+ 2---Hm−1Fe(CN) 3(n−m+1)− 6 , [1] Kapp= £ AlOH+2---Hm−1Fe(CN) 3(n−m+1)− 6 ¤ [AlOH]£Fe(CN)n6−¤[H+]m . [2]
where n is 3 and 4 for ferricyanide and ferrocyanide, respec-tively, and Kapp is the apparent adsorption constant. Since the
ferrocyanide (Fe(CN)46−) ion can form conjugate acids, i.e., H Fe(CN)36−, while no conjugate acid of ferricyanide (Fe(CN)36−) was found above pH 1 (16), the m values in Eq. [1] for ferro-cyanide and ferriferro-cyanide are defined as 2 and 1, respectively.
With CSF, CS, CF, and CT representing [AlOH+2---Hm−1
Fe(CN)3(n6 −m+1)−], [AlOH], [Fe(CN)n6−], and the sum of CSF
and CF, Eq. [2] can be rewritten as
CSF= KappC SCT[H+]m 1+ KappC S[H+]m . [3]
Let Cmaxbe the maximum adsorption capacity of CSF;
therefore, CS= Cmax− CSF. [4]
Combining Eqs. [3] and [4] yields
CSF=
KappCFCmax[H+]m
1+ KappC F[H+]m
. [5]
FIG. 4. Langmuir plots for ferrocyanide and ferricyanide adsorption isotherms on theγ -Al2O3 surface at two difference temperatures: (a) 283 K and (b) 298 K.
Equation [5] can be rearranged to CF CSF = 1 KappC max[H+]m + 1 Cmax CF. [6]
By use of a double-reciprocal plot, i.e., CF/CSFvs CF, Cmax,
and Kappcan be obtained from the intercept and the slope for
each pH. Figure 4 is the Langmuir plot for the competitive ad-sorption of ferricyanide and ferrocyanide on theγ -Al2O3surface
at the difference solution temperature. The Cmaxand Kappvalues
obtained from the linear regression for this competitive adsorp-tion system are presented in Table 1. Obviously, Cmaxvalues of
TABLE 1
Cmax and log Kapp of the Langmuir Model for Competitive Adsorption of Ferricyanide and Ferrocyanide at pH 6.5, 283 K, and 298 K
Ferricyanide Ferrocyanide T (K) pH Cmax(10−4M) log Kapp Cmax(10−4M) log Kapp
283 6.5 1.08 10.40 2.88 17.71
TABLE 2
Parameters Used in the TLM forγ-Al2O3a
Specific surface areas (m2/g) 118
Site density (sites/nm2) 1.3
Capacitance C1, C2(F/m2) 1.4, 0.2
pKa1int, pKa2int 7.2, 9.5
pKNaint+, pKClOint− 4
9.1, 8.2
aSource. Hohl and Stumm (12), C
1and C2were from Zhang et al. (17). ferrocyanide and ferricyanide decrease with increasing temper-ature. Previous studies suggested that the dehydrogenation on the oxide surface was an endothermic reaction (14, 17). Thus, increasing the temperature will reduce the amount of the surface AlOH+2 sites at the same pH. If the adsorption of ferrocyanite and fericyanide onto hydrousγ -Al2O3favors the AlOH+2 sites,
a decrease in temperature will enhance the adsorption capacity and Kapp. The much greater C
maxand Kappof ferrocyanide, as
shown in Table 1, also indicate competitiveness in adsorption than the ferricyanide.
TLM Modeling
The HYDRAQL program was applied to simulate the TLM for the competitive adsorption. The parameters used in the sim-ulation are listed in Table 2. By the assumption of TLM, cations or anions if present in the solution are allowed to form surface
FIG. 5. HYDRAQL simulation of competitive adsorption edges of ferrocyanide (solid lines) and ferricyanide (dotted lines) as a function of pH and four different initial concentrations: (a) 0.5 × 10⁻⁴ M, (b) 1× 10⁻⁴M, (c) 1.5 × 10⁻⁴ M, and (d) 2× 10⁻⁴ M (using the outer-sphere complexation model with Kint
Ferrocyanide= 1023and KFerricyanideint = 1012.5).
complexes at either the o-plane (inner-sphere complexation) or
β-plane (outer-sphere complexation). The surface reaction of
ferrocyanide and ferricyanide ions at theβ-plane were written as follows:
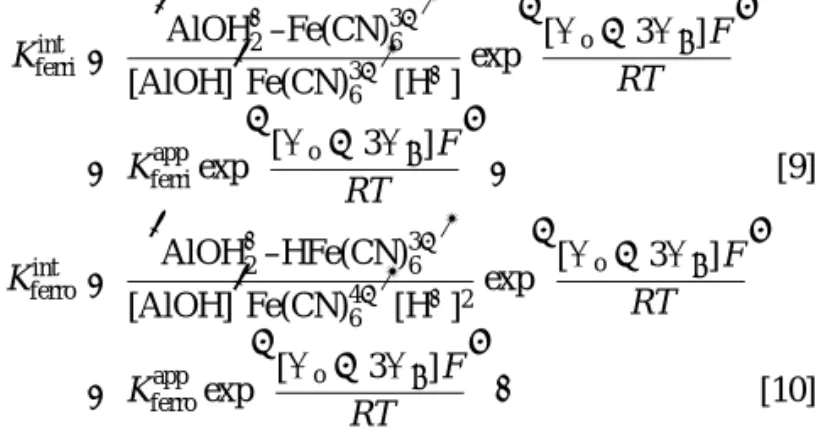
AlOH+ H++ Fe(CN)36− ↔ AlOH+2---Fe(CN)36−, [7] AlOH+ 2H++ Fe(CN)46− ↔ AlOH+2---HFe(CN)36−. [8] Figure 5 indicates that the experimental data fit the model of outer-sphere complexation, as suggested by Eqs. [7] and [8], very well. The Kint values in the simulation using the HYDRAQL program were set as 1012.5 and 1023.0 for
ferri-cyanide and ferroferri-cyanide, respectively. These Kintvalues from
the competitive adsorption agree well with those from the in-dividual adsorption previously obtained (Kint= 1011.0for
ferri-cyanide and Kint= 1021.1for ferrocyanide) (13). The simulation
results suggested that the individual adsorption of ferricyanide and ferrocyanide on the γ -Al2O3 occur in outer-sphere
com-plexation, which also implied that the competitive adsorption of ferrocyanide and ferricyanide on theγ -Al2O3surface used the
outer-sphere complexation. Figure 5d shows that, at the initial concentration of 2× 10⁻⁴M, the experimental data are slightly less than the simulated values. The discrepancy may result from the coagulation by a high concentration of ions during shaking. The Kapp values derived from Table 1 are 1010.27 for ferri-cyanide and 1017.50 for ferrocyanide at 298 K, consistent with
the Kintvalues derived from HYDRAQL (1012.5and 1023.0for
ferricyanide and ferrocyanide, respectively). In solution, the charges of ferricyanide and ferrocyanide ions would not change within the experimental pH range. Therefore, the m values in Eq. [1] remain constant. The Kint and Kapp can be written as
follows:
Kferriint = £
AlOH+2–Fe(CN)36−¤ [AlOH]£Fe(CN)36−¤[H+]exp
½ [9o− 39β]F RT ¾ = Kapp ferriexp ½ [9o− 39β]F RT ¾ , [9] Kferroint = £ AlOH+2–HFe(CN)36−¤ [AlOH]£Fe(CN)46−¤[H+]2exp
½ [9o− 39β]F RT ¾ = Kapp ferroexp ½ [9o− 39β]F RT ¾ . [10]
The difference between the Kintand Kappis by a charge
fac-tor of exp([9o− 39β]F/RT ). This result demonstrates that the
9o− 39β values can be determined by ln Kint− ln Kapp. The
calculated values of9o− 39βare 0.132 V for ferricyanide and
0.325 V for ferrocyanide (by ferricyanide, Kapp= 1010.27 and
Kint= 1012.50; ferrocyanide, Kapp= 1017.50 and Kint= 1023.0).
For comparison, the oxide surface potential were simulated by applying the HYDRAQL program under the assumption of the competitive outer-sphere complexation. The simulated re-sult is shown in Table 3. The9o− 39β values determined by
ln Kint− ln Kappare in the range of results listed in Table 3. Thermodynamic Parameters
The relationship between the reaction constant (Kapp) and temperature (T ) can be expressed with the Gibbs–Helmholtz
TABLE 3
Surface Potential of Aluminum Oxide in the Presence of Fer-ricyanide and Ferrocyanide Adsorption (Outer-Sphere Reaction Model, Data Simulated by HYDRAQL Program)
Initial concentration
(ferricyanide and ferrocyanide) pH 9o 9β 9o− 39β
0.5 × 10⁻⁴M 5 0.143 0.0599 −0.0367 6 0.0843 0.00235 0.07725 7 0.0355 −0.0282 0.1201 1.0 × 10⁻⁴M 5 0.108 −0.03 0.198 6 0.0687 −0.0404 0.1899 7 0.0238 −0.0607 0.2059 1.5 × 10⁻⁴M 5 0.103 −0.0405 0.2245 6 0.0619 −0.0582 0.2365 7 0.020 −0.0722 0.2366 2.0 × 10⁻⁴M 5 0.0726 −0.0922 0.3492 6 0.0406 −0.106 0.3582 7 0.0111 −0.0969 0.3018
FIG. 6. Plots of ln Kappvs 1/T for ferrocyanide and ferricyanide adsorption onγ -Al2O3. equation, ∂ ln Kapp ∂(1/T ) = −1H◦ R , [11]
where R and T are the gas constant and absolute temperature. Thus, from the ln Kappversus 1/T plots, the values of enthalpy
(1H◦) can be determined from the slope. The1H◦of the indi-vidual adsorption of ferricyanide and ferrocyanide onγ -Al2O3
calculated in our previous work are−4.88 and −5.96 kcal/mol, respectively (14). We plotted the data of the competitive adsorp-tion on the regression line of individual adsorpadsorp-tion, as shown in Fig. 6. The agreement between the two sets of data suggests that the calculated 1H◦ of individual and competitive adsorption are the same. The negative1H◦indicates the exothermic nature of the competitive adsorption process. Other thermodynamic pa-rameters, including free energy (1G◦) and entropy (1S◦), can be calculated by using Eqs. [12] and [13]. Table 4 summarizes the results.
1G◦= −RT ln Kapp,
[12]
1G◦= 1H◦− T 1S◦. [13]
The positive standard entropy (1S◦), as shown in Table 4, indicates the increase in disturbance during the adsorption
TABLE 4
Thermodynamic Parameters of Competitive Adsorption onγ-Al2O3
1H◦ 1S◦ 1G◦
pH T (K) (kcal/mol) (cal/mol) (kcal/mol) Ferricyanide 6.5 283 −3.34 35.79 −13.47
298 −3.34 35.84 −14.02
Ferrocyanide 6.5 283 −5.16 62.79 −22.93
process. When the adsorbate was adsorbed onto the oxide sur-face, the counterions or water molecules on the surface were replaced and released. Because of the larger size and higher charge of both ions, adsorption of each complex ion will release a greater number of counterions or water molecules, resulting in a positive value of1S◦.
CONCLUSION
The results in this study demonstrated that the adsorption of ferrocyanide onγ -Al2O3is more competitive than that of
ferri-cyanide due to its greater charge. The effects of pH and adsor-bate concentration on the competitive adsorption are the same as those on the individual adsorption. Applying the modified Langmuir isotherm in competitive adsorptions, we derived the Cmax, Kapp, and thermodynamic parameters, from which the
thermodynamic characteristics was deducted. The difference between the Kint and Kapp can be expressed by the
electro-static charge term, exp(9 F/RT ). The success in substituting Kintwith Kappin the TLM modeling was due to the fact that the
charges of both complex ions do not change within the pH range (pH 6–10) of the experiment. The prediction from the TLM sim-ulation with the HYDRAQL program agrees well with the ex-perimental results, suggesting that the competitive adsorption exists in outer-sphere complexation.
ACKNOWLEDGMENTS
We thank Dr. Jill Ruhsing Pan for critical reading of this manuscript. The authors also appreciate the financial support of the National Science Council,
Republic of China, under Award NSC 88-2211-E-293-005 during this research.
REFERENCE
1. Meeussen, J. C. L., Keizer, M. G., and de Haan, F. A. M., Environ. Sci. Technol. 26, 511 (1992).
2. Meeussen, J. C. L., Keizer, M. G., van Riemsdijk, W. H., and de Haan, F. A. M., Environ. Sci. Technol. 26, 1832 (1992).
3. Lopez-Hernandez, D., Siegert, G., and Rodriguez, J. V., Soil Sci. Soc. Am. J.
50, 1460 (1986).
4. Violante, A., Coolmbo, C., and Buondonno, A., Soil Sci. Soc. Am. J. 55, 65 (1991).
5. Gabaldon, C., Marzal, P., Ferrel, J., and Seco, A., Water Res. 30, 3050 (1996).
6. Hayes, K. F., and Leckie, J. O., J. Colloid Interface Sci. 115, 564 (1987). 7. Hayes, K. F., Papelis, C., and Leckie, J. O., J. Colloid Interface Sci. 125,
717 (1988).
8. Hayes, K. F., Redden, G., Ela, W., and Leckie, J. O., J. Colloid Interface Sci. 142, 448 (1991).
9. Katz, L. E., and Hayes, K. F., J. Colloid Interface Sci. 170, 477 (1995).
10. Kanungo, S. B., J. Colloid Interface Sci. 162, 93 (1994).
11. Papelis, C., Hayes, L. F., and Leckie, J. O., “HYDRAQL,” Technical Report No. 306, Stanford University, 1988.
12. Hohl M., and Stumm, W., J. Colloid Interface Sci. 55, 281 (1976). 13. Cheng, W. P., and Huang, C., J. Colloid Interface Sci. 181, 627
(1996).
14. Huang, C., and Cheng, W. P., J. Colloid Interface Sci. 188, 270 (1997). 15. Cheng, W. P., and Huang, C., J. Colloid Interface Sci. 213, 204 (1999). 16. Eaton, W. A., George, P., and Hanania, G. I. H., J. Phys. Chem. 71, 2016
(1967).
17. Zhang, P., Sparks, D. L., and Scriuner, N. C., J. Colloid Interface Sci. 162, 224 (1994).