國 立 交 通 大 學
生物資訊及系統生物研究所
碩士論文
分析纖維酵素蛋白質結構了解內切及外切纖維酵素
結合位置
Analysis of the cellulase protein structure to understanding the
binding site of endo- and exo-glucanase
研 究 生 :許乃文
指導教授:黃鎮剛 教授
分析纖維酵素蛋白質結構了解內切及外切纖維酵素結合位置
Analysis of the cellulase protein structure to understanding the binding
site of endo- and exo-glucanase
研 究 生 :許乃文
Student : Nai-Wen Hsu
指導教授 :黃鎮剛
Advisor : Jenn-Kang Hwang
國立交通大學
生物資訊及系統生物研究所
碩士論文
A Thesis
Submitted to Institute of Bioinformatics
National Chiao Tung University
In partial Fulfillment of the Requirements
For the Degree of
Master
in
Bioinformatics
July 2010
分析纖維酵素蛋白質結構了解內切及外切纖維酵素結合位置
學生:許乃文 指導教授:黃鎮剛 國立交通大學生物資訊及系統生物研究所碩士班
摘要
纖維素為地球存在量最豐富的有機物並且在工商業產品用途上扮演 重要的角色。然而纖維分解酵素是一群水解酵素,可將不具溶解性纖維 素的β-1, 4鍵水解而分解成單糖。近年纖維分解酵素陸續依蛋白質序列相 似度被分成118個家族,主要的酵素包括內切型纖維素分解酵素(endo-β-1, 4-glucanase ) EC 3.2.1.4和外切型纖維素分解酵素(exo-β-似度被分成118個家族,主要的酵素包括內切型纖維素分解酵素(endo-β-1, 4-glucanase ) EC 3.2.1.91。這兩類酵素若在同家族中作用機制和三級結構上據有相似性。 到目前為止,被發現的纖維素分解酵素大都被分離且純化,且除了酵素 的氨基酸序列,生化特性和作用機轉大部份已被分析討論出來,但卻還 沒有可以利用三級結構來分辨內切型級外切型纖維素分解酵素的方法。 所以為了達成辨認纖維素分解酵素的目的,我們思考是否能利用結合位 置來作區分的橋梁,以至於必須先分析纖維素分解酵素結合位置。我們 應用了已被開發的方法“蛋白質接觸數目模型”來分析是否能預測酵素 的結合位置,然而我們的結果提供了利用蛋白質接觸數目模型對於預測 結合位置是有幫助的。更進一步而言,我們也許在未來預測結合位置上 提供發展新而有效方法並朝著能辨別纖維素分解酵素的目的。Analysis of the cellulase protein structure to understanding the
binding site of endo- and exo-glucanase
Student: Nai-Wen Hsu Advisor: Dr. Jenn-Kang Hwang Institute of Bioinformatics and Systems Biology
National Chiao Tung University
Abstract
Cellulose is a well-known biomass energy and plays an important role due to its abundance source to be used for producing commercially industrial products in the world. However, cellulase (Glycoside hydrolases) is referring to a class of enzymes that hydrolyses the β -1, 4-glycosidic linkages of cellulose. And it has already been classified more than 118 families on amino acid sequence similarities that have been proposed so far, and traditionally divided into two classes denominated “endo-glucanase” (EC 3.2.1.4) and “exo-“endo-glucanase” (EC 3.2.1.91). Both of them utilize the same catalytic mechanisms, and have overall similar structures. In spite of considerable structure of cellulase − function information, mechanistic studies, and catalytic site simulations seems to be well understood in recent works, there is still way to distinguish the structures between endo- and exo-glucanase being researched up to now. Therefore, in order to identify the structures of cellulase, we apply a computational method that had been developed, WCN (Weighted Contact Number) model to analyze the dynamic properties of cellulase. It means that the atom’s thermal fluctuations are in reverse proportion to the protein contact number of this atom, and a residue with lower flexibility is also more compact in proteins. Thus, through WCN
purpose in this work is to realize and analyze binding site of cellulase then maybe we can recognize endo-glucanase and exo-glucanase in further. Our results provide information of cellulase protein binding site prediction. Furthermore, we can get more useful and powerful studies by using the method that we applied in the future.
致謝
謝謝在研究所這段時間一路上很有耐心教導我和幫助我的學長姊們,更 謝謝老師能夠不斷的鼓勵我幫助我讓我能夠找到研究的方向,也分享了很多不 管做研究還是做人處事上應該要有的態度跟觀念,讓我能在原本陌生的領域裡 漸漸摸著頭緒也讓自己學習如何管理自己的人生。 再次感謝同學人維、學妹儷芬、學長志鵬、小操、建華、Kevin、彥龍、 肇基、儼毅、志杰、惟正和小胖士中,不僅在研究上給與的指導、鼓勵和幫助, 和你們一起在實驗室的生活真的很充實。 最後要感謝在我人生中扮演最重要角色的家人,沒有你們一路上的鼓勵 和支持的就沒有現在的我,爸爸媽媽我很愛你們,謝謝你們給了我這麼完整的 家。
CONTENTS
中文摘要... i ABSTRACT...ii 致謝...iv CONTENTS...v TABLE CONTENTS...vi FIGURE CONTENTS...vii 1. Introduction………12. Material and Methods………3
2.1 Dataset of cellulase proteins………3
2.2 Comprehend characteristics of cellulase structure………..4
2.3 Analysis and Classification of binding sites………5
2.3.1 Amino acid type………5
2.3.2 Weighted contact number model (WCN)………...5
2.3.3 Relative Solvent Accessibility (RSA)………..6
2.3.4 Performance measures………..7
3. Results and Discussion………..9
3.1 The dataset………...9
3.2 The prediction performance……….9
3.3 Comprehend analysis of endo- and exo-glucanases………...10
3.3.1 Endo-glucanases………..10 3.3.2 Exo-glucanases………11 4. Conclusion………14 REFERENCES……….15 TABLE……….17 FIGURES……….28
TABLE CONTENTS
Table 1.The dataset of Exo-glucanases from NCBI, CSA………...17
Table 2. The dataset of Endo-glucanases from NCBI, CSA………18
Table 3. Proteins have own catalytic residues data from literature………..20
Table 4. Bindings site residues of each protein from literatures………..20
Table 5.1. The performance measurement of all dataset………..21
Table 5.2. The performance measurement of endo-glucanase……….22
Table 5.3. The performance measurement of exo-glucanases………..23
Table 6. Endo-glucanase 1TML. The comparison with WCN and WCN & RSA included…24 Table 7. Endo-glucanase 2ENG. The comparison with WCN and WCN & RSA included…24 Table 8. Endo-glucanase 1JS4. The comparison with WCN and WCN & RSA included…...24
Table 9. Endo-glucanase 2NLR. The comparison with WCN and WCN & RSA included...25
Table 10. Exo-glucanase 1CEL. The comparison with WCN and WCN & RSA included….25 Table 11. Exo-glucanase 1QK2. The comparison with WCN and WCN & RSA included….25 Table 12. Exo-glucanase 1EXP. The comparison with WCN and WCN & RSA included….26 Table 13. The comparison of WCN with WCN include RSA………..27
FIGURE CONTENTS
Figure 1.The processive synergy mechanism of cellulose hydrolysis………..28
Figure 2.WCN z-score distribution of literature binding site residues……….29
Figure3. The ROC curves-like of cellulase dataset………..30
Figure 4. All of the structure analysis information of 1TML………...31
Figure 5. All of the structure analysis information of 2ENG………...34
Figure 6. All of the structure analysis information of 1JS4……….37
Figure 7. All of the structure analysis information of 2NLR………...40
Figure 8. All of the structure analysis information of 1CEL………43
Figure 9. All of the structure analysis information of 1QK2………45
Figure 10. All of the structure analysis information of 1EXP………..47
Figure 11. The frequency of amino acid type in cellulase experimental binding site compared with our method of binding site prediction base on WCN including RSA………..50
1. Introduction
Annually, plants produce about 180 billion tons of cellulose making it the
largest reservoir of organic carbon on Earth.1 Owing to the population growth goes
with energy crisis that there is not infinite and sufficient resources in our planet progressively, the idea that utilize and convert cellulose effectively into renewable biomass resources for the production of alternative fuels has become significant and attractive. Cellulose itself is a very simple polymer of glucose units joined together by
β-1, 4-glycosidic linkages.2 Coupling of adjacent cellulose molecules by hydrogen
bonds and van der Waal’s forces results in a parallel alignment and a crystalline
structure in order to form homopolysaccharide.3 Two different ending groups are
found in each cellulose chain edge. At one end of each chains, a non-reducing group is show where a closed ring structure. A reducing group with both an aliphatic structure and a carbonyl group is at the other end of the chains. And according to the difference of hydrogen bond pattern, there are two forms discriminated from cellulose: amorphous domain and crystalline domain. The natural consequence of this difference in the crystalline structure is that the hydrolysis rate is much faster for amorphous cellulose than crystalline one.
Cellulase, hydrolysis of cellulose requires the co-operative actions of three classes, namely endo-β-1, 4-glucanases (EC 3.2.1.4), exo-β-1, 4-glucanases (EC
3.2.1.91) and β-glucosidases (EC 3.2.1.21). The CAZy(carbohydrate active enzymes)
classification system collates glycosyl hydrolase (GH) enzymes into families according to sequence similarity, which have been shown to reflect shared structural
consequently new chain ends. Exo-glucanase act in a processive manner on the reducing or nonreducing ends of cellulose polysaccharide chains, liberating either glucose or cellobiose as major product. And β -glucosidases hydrolyze soluble
cellobiose to glucose.5
According to the classification that allows the identification of cellulases with common folds and a similar catalytic mechanism within the same family, a rational method of telling cellulase endo-glucanases and exo-glucanases from structures isn’t established yet. However before accomplish this hard work, the main issue of our present work is to understand the cellulases protein structures and their binding site. We apply the method, WCN (Weighted Contact Number) model, which may provide more information from the binding site of cellulase. Due to a recent study shows that the protein B-factor of the atom is linearly proportional to its squared distance from
the protein centroid. 6,7 In other words, the residues in proximity to the protein
centroid will have lower thermal fluctuation or more rigid than those further residues. Besides, the atom’s thermal fluctuations are linear inverse proportion to the protein contact number of this atom, it account for that a residue has lower flexibility also
more compact in structure.8 Moreover, we add the filter Relative Solvent
Accessibility (RSA) to increase the degree of accuracy. Therefore, binding sites may be able to be confirmed through the characteristic information above mentioned. Consequently, in further work, the purpose we would like to deal with is that whether endo-glucanases and exo-glucanases could be distinguished from their binding site or not, and that would be an interesting issue and great challenge to carry out.
2. Material and Methods
2.1 Dataset of cellulase proteins
The enzyme of cellulase was taken from the National Center for Biotechnology Information (NCBI), we search all endo-glucanases (EC 3.2.1.4) and exo-glucanases (EC 3.2.1.91) by their EC number. There are 154 endo-glucanase proteins, 65 exo-glucanases, and the grand total number of enzyme we obtained is 219, the detail was shown in Table 1, 2. However, we only selected 4 proteins that have their own active site residues literature information from the Catalytic Site Atlas (CSA)-2.2.10 and binding site residues for each glucanases, the list of our dataset
2.2 Comprehend characteristics of cellulase sturcture
Cellulose is a nature polymer composed of repeating glucose units, and each
glucose unit is rotated 180° relative to its neighbors along the main axis.15 Cellulose
exits in a highly crystalline form, therefore, hydrolysis of cellulose requires co-operative activities of three classes of enzymes:
i. Endo-glucanase or 1,4-β-D-glucanhydrolase (EC 3.2.1.4)
ii. Exo-glucanase or 1,4-β-D-glucan cellobiohydrolases (EC 3.2.1.91) iii. β-glucosidases or β-glucoside glucohydrolases (EC 3.2.1.21)
The structures of endo-glucanases are commonly characterized by a groove or a cleft to bind a linear cellulose chain in order to fit in a random manner at amorphous sites. Generally, exo-glucanases or cellobiohydrolases (CBH) possess tunnels-like active
sites, which can only accept a substrate chain via its terminal regions.16 These tunnels
proved to be essential to the cellobiohydrolases for the processive cleavage of cellulose chains from the reducing or nonreducing ends. The Cellulose degradation
2.3 Analysis and Classification of binding sites
2.3.1 Amino acid type
Different amino acids apparently have various propensities to be binding site residues. Binding site residues are classified according to the 20 standard amino acid one letter abbreviation from hydrophobic group, hydrophilic one to Charged type as follows, i.e., G, A, V, L, I, M, P, F, W, Y, C, S, T, N, Q, D, E, H, R and K.
2.3.2 Weighted contact number model (WCN)
It has recently been shown that in proteins the atomic mean-square displacement (or B-factor) can be related to the number of the neighboring atoms (or protein contact number) and the square distance from the center of mass of a
protein.18 Here, we will refer this method as the contact number (CN). This method
can be further improved if the protein CN is scaled down by the square of the distance between the contacting pair. To consider the distance factor, a distance-dependent
contact number will defined by weighting the integral contact number with the
factor which is the distance between Cα atoms of i and j residues.
vi = 1 rij2 j ≠1 N
∑
(1) ! vi ! 1/rijwhere N is total residue numbers of the protein, and we refer is as the weighted CN model (WCN). The CN (or WCN) profile of protein of N residues is defined as
(2)
where is defined as the reciprocal contact number, i. e., .
For the purpose of easy comparison, we will normalize to its Z-scores:
(3)
where and are the mean and the standard deviation of . Here designates .
2.3.3 Relative Solvent Accessibility (RSA)
The surface area is an important structure characteristic in binding a non-protein molecule (such as the substrate or cofactor) and in non-protein-non-protein complexes
interaction.19 Thus, the binding site residues are generally more exposed to solvent
than others. Amino acid relative accessibility is the degree to which a residue in a protein is accessible to a solvent module. The relative solvent accessibility is computed by
(4)
where is the solvent accessibility of a residue was assigned by using the program
DSSP, given in Å2 units. is the maximal accessibility for the amino acids
given by B. Rost et al.20 A residue is considered as accessible if its relative accessible
! w = ("1,"2,…"N) ! "1 ! "i = 1/#i ! vi ! zxi= x
(
i" x)
/#x ! vi ! "x ! x ! x ! " ! Re lAcc(%) = 100 " Acc MaxAcc(%) ! Acc MaxAccsurface area (RSA) ≥ 5%, a cut-off devised and optimized by Miller et al.21 If a residue is accessible in the protomer it is in the protein surface, otherwise it is core. i < 5% means Buried, ≥ 5% means Exposed. Therefore, the thresholds that
we selected are the same as those in Rost and Miller.20,21
2.3.4 Performance measures
The performance measurements of sensitivity and specificity are measured by true positive rate (TPR) and false positive rate (FPR). The TPR is given by
(5)
And the FPR is given by
(6)
Where TP is the number of true positives, TN is the number of true negatives, FP is the number of false positives, and FN is the number of false negatives. The sensitivity value is equal to TPR, and the specificity value is given by
(6)
In order to reconfirm the WCN (z-score) threshold to predict binding site, our calculation is in the process of drawing a diagram of TPR and FPR. For testing case, the WCN (z-score) outputs the probabilities of endo-glucanase and exo-glucanase. Consequently, the decision threshold we selected for endo-glucanase is less than -0.5, ! Re lAcc ! TPR = TP TP + FN ! FPR = FP FP + TN ! Specificity = 1 " FPR
for exo-glucanase is smaller then -0.8, thus the class with higher specificity is the predicted of the WCN.
3. Results and Discussion
3.1 The dataset
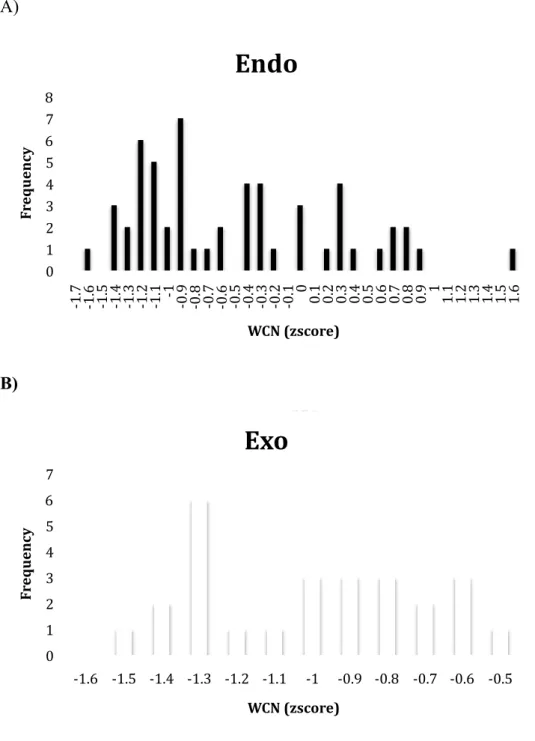
We analyzed the WCN (z-score) distribution of cellulase binding site residues that we can find from literature. Figure 2 shows the frequency of endo-glucanase binding residues (black) compared exo-glucanase binding residues (white). From the distribution, we can see WCN (z-score) of cellulase that most of the binding residues are between -1.6 ~ 0.9. After that, making statistics to measure sensitivity and specificity in order to decide the proper WCN threshold to predict binding site as follow.
3.2 The prediction performance
In this statistic, we calculate various WCN z- score threshold values to verify the sensitivity and specificity with respect to each threshold value. Besides, the threshold ranges from -1.6 to 0.9, increasing by 0.1 each time. If the residues we selected under threshold and also match the literature binding site residues, it is considered as “positive”; otherwise, it is considered as “negative”. Therefore each threshold value will produce a group of TPR and FPR, which decides a point on the diagram in Figure 3 and the list in Table 5. Figure 3(A)(B)(C) from top to the bottom shows all dataset cellulase diagram, endo-glucanase group diagram and exo-glucanase group diagram. Based on the measurement of sensitivity, specificity and the diagram
of a relationship TPR and FPR, we decide the suitable WCN z- score binding site threshold for endo-glucanases is < – 0.5 and for exo-glucanase is < -0.8.
3.3 Comprehend analysis of endo- and exo-glucanases
Despite the good prediction performance of WCN model, the sensitivity and specificity for predicting cellulase binding sites are need to improve, so we add a filter RSA to raise the values of specificity. The RSA threshold we selected (≥ 5%) based
on Rost and Miller.20,21
3.3.1 Endo-glucanases
In this study, the endo-glucaase dataset we selected is as follows, PDB id 1TML, 2ENG, 1JS4 and 2NLR. The Figure 4(A) shows the WCN model of enzyme 1TML structure, Figure 4(B) shows the WCN z- score distribution of 1TML, Figure 4(C) compares Figure (D)(E) shows the experimental binding site residues colored in red, the residues under the WCN threshold (< -0.5) colored in orange and then selected residues that are exposed colored in orange, all of them are surface form and Figure (F) compares Figure (G)(H) shows the cartoon protein structure form, Figure 4(E)(H) means that we pick the residues that conform to WCN and RSA at the same time. And the comparison method WCN with WCN included RSA of sensitivity and specificity is shown in Table 6. Figure 5(A) to (H) shows the information of enzyme 2ENG structure like as Figure 4, the comparison method WCN with WCN included RSA of sensitivity and specificity is shown in Table 7. Figure 6(A) to (H) shows the information of enzyme 1JS4 structure like as Figure 4 enzyme 1TML, the comparison
method WCN with WCN included RSA of sensitivity and specificity is shown in Table 8. Figure 7 (A) to (H) shows the information of enzyme 2NLR structure like as Figure 4 enzyme 1TML, the comparison profile of endo-glucanase 2NLR method WCN with WCN included RSA of sensitivity and specificity is shown in Table 9. Above-mentioned the relationship of performance, we combine two methods WCN and WCN include RSA, we can figure out the residues under WCN z-score threshold of enzymes we selected are much more than the method include RSA, although the sensitivity value will decrease, however we can lower the false positive value and enhance the true negative value then our specificity value will increase much more. It is clear that the binding site residues tend to have lower WCN z-score value and exposed according to our comparison with performance profile results.
3.3.2 Exo-glucanases
In this study next to the endo-glucanases, the exo-glucaase dataset we selected is as follows, PDB id 1CEL, 1QK2, 2HIS and 1EXP. Because of the enzyme 2HIS and 1EXP are in the same family, we select 1EXP for discussing only. The Figure 8(A) shows the WCN model of enzyme 1CEL structure, Figure 8(B) shows the WCN z- score distribution of 1CEL, Figure 8(C) compares Figure (D)(E) shows the experimental binding site residues colored in red, the residues under the WCN threshold (< -0.8) colored in orange and then selected residues that are exposed colored in orange, all of them are cartoon form, Figure 8(D)(E) means that we pick the residues that conform to WCN and RSA at the same time. And the comparison method WCN with WCN included RSA of sensitivity and specificity is shown in
Figure 8, the comparison method WCN with WCN included RSA of sensitivity and specificity is shown in Table 11. Figure 10(A) to (H) shows the information of enzyme 1EXP structure like as Figure 8 enzyme 1CEL, the comparison method WCN with WCN included RSA of sensitivity and specificity is shown in Table 12. Above-mentioned the relationship of performance, we also combine two methods WCN and WCN include RSA, we can figure out the residues under WCN zscore threshold (≤ -0.8) of enzymes we selected are much more than the method include RSA, although the sensitivity value will decrease, however we can lower the false positive value and enhance the true negative value then our specificity value will increase much more. It is clear that the binding site residues tend to have lower WCN z-score value and exposed according to our comparison with performance profile results.
Figure 11 shows the frequency of amino acid type in cellulase experimental binding site compared with our method of binding site prediction base on WCN including RSA, we expect that experimental and our work would be have similar amino acid type on binding substrates. However, the experimental frequency of hydrophobic, hydrophilic and charged amino acid type in endo-glucanases binding site are 35%, 35% and 31%; in exo-glucanases are 23%, 38% and 38%. And in our work, the frequency of hydrophobic, hydrophilic and charged amino acid type in endo-glucanases binding site are 41%, 34% and 25%; in exo-endo-glucanases are 45%, 24% and 31%. There is no significant correlation with the frequency of amino acid type in binding substrate between experimental and our work. However, we still can figure out the performance values of endo-glucanases and exo-glucanases show in Table 12, that values are increasing in specificity, through different WCN z- score threshold and RSA included. It means that enzymes are very specific, and the binding sites of enzyme are especially less flexible than other residues. The WCN is used for indicate
structure rigidity. However, there are complementary relationships between structural characteristics of binding sites and based on the method WCN. The WCN z- score threshold for endo-glucanases is larger than exo-glucanases, it means that most of endo-glucanases binding substrate structure are flexible, and exo-glucanases are more rigid for cellulose hydrolyze. It is reasonable that endo-glucanses need more space for hydrolyzing cellulose. Thus, using WCN and RSA may help understanding and finding binding site residues of cellulase as more as possible.
4. Conclusion
In this work, we present a structural analysis of cellulase binding sites using a dataset of 219 enzymes which was chosen from NCBI and CSA. This dataset is nonredundant, and we selected 4 enzymes for each endo-glucanase and exo-glucanase, total 8 enzymes that have their own experimental catalytic residues data form literature. The conclusion that we analysis is that through our methods, the WCN (z- score) threshold for endo-glucanases is larger than exo-glucanases, it is reasonable that endo-glucanses need more space for hydrolyzing cellulose. Besides, the performance value of predicting binding sites let us know that we can increase the specificity values based on WCN and RSA. It means that most of binding sites are rigid than other residues and exposed although they are hydrophobic.
Based on all these characteristics with binding sites may enable people to understand more information for structure- function relationships; furthermore, it will be helpful for predicting binding sites in cellulase of unknown function from protein structures and maybe we could tell endo-glucanase and exo-glucanase by their binding sites in the further work.
REFERENCES
1. Richmond T. Higher plant cellulose synthases. Genome Biol
2000;1(4):REVIEWS3001.
2. Sulzenbacher G, Mackenzie LF, Wilson KS, Withers SG, Dupont C, Davies
GJ. The crystal structure of a 2-fluorocellotriosyl complex of the Streptomyces lividans endoglucanase CelB2 at 1.2 A resolution. Biochemistry
1999;38(15):4826-4833.
3. Zhang YH, Lynd LR. Toward an aggregated understanding of enzymatic
hydrolysis of cellulose: noncomplexed cellulase systems. Biotechnol Bioeng 2004;88(7):797-824.
4. Cantarel BL, Coutinho PM, Rancurel C, Bernard T, Lombard V, Henrissat B.
The Carbohydrate-Active EnZymes database (CAZy): an expert resource for Glycogenomics. Nucleic Acids Res 2009;37(Database issue):D233-238.
5. Lynd LR, Weimer PJ, van Zyl WH, Pretorius IS. Microbial cellulose
utilization: fundamentals and biotechnology. Microbiol Mol Biol Rev 2002;66(3):506-577, table of contents.
6. Lu CH, Huang SW, Lai YL, Lin CP, Shih CH, Huang CC, Hsu WL, Hwang
JK. On the relationship between the protein structure and protein dynamics. Proteins-Structure Function and Bioinformatics 2008;72(2):625-634.
7. Shih CH, Huang SW, Yen SC, Lai YL, Yu SH, Hwang JK. A simple way to
compute protein dynamics without a mechanical model. Proteins-Structure Function and Bioinformatics 2007;68(1):34-38.
8. Lin CP, Huang SW, Lai YL, Yen SC, Shih CH, Lu CH, Huang CC, Hwang JK.
Deriving protein dynamical properties from weighted protein contact number. Proteins-Structure Function and Bioinformatics 2008;72(3):929-935.
9. Zou JY, Kleywegt GJ, Stahlberg J, Driguez H, Nerinckx W, Claeyssens M,
Koivula A, Teerii TT, Jones TA. Crystallographic evidence for substrate ring distortion and protein conformational changes during catalysis in
cellobiohydrolase Cel6A from Trichoderma reesei. Structure with Folding & Design 1999;7(9):1035-1045.
10. Russell RB. Detection of protein three-dimensional side-chain patterns: New
examples of convergent evolution. Journal of Molecular Biology 1998;279(5):1211-1227.
11. Notenboom V, Birsan C, Nitz M, Rose DR, Warren RAJ, Withers SG.
Insights into transition state stabilization of the beta-1,4-glycosidase Cex by covalent intermediate accumulation in active site mutants. Nature Structural Biology 1998;5(9):812-818.
12. Sakon J, Irwin D, Wilson DB, Karplus PA. Structure and mechanism of
endo/exocellulase E4 from Thermomonospora fusca. Nature Structural Biology 1997;4(10):810-818.
13. Davies GJ, Tolley SP, Henrissat B, Hjort C, Schulein M. Structures of
oligosaccharide-bound forms of the endoglucanase V from Humicola insolens at 1.9 angstrom resolution. Biochemistry 1995;34(49):16210-16220.
14. Spezio M, Wilson DB, Karplus PA. Crystal-Structure of the Catalytic Domain
15. Grassick A, Murray PG, Thompson R, Collins CM, Byrnes L, Birrane G, Higgins TM, Tuohy MG. Three-dimensional structure of a thermostable native cellobiohydrolase, CBHIB, and molecular characterization of the cel7 gene from the filamentous fungus, Talaromyces emersonii. European Journal of Biochemistry 2004;271(22):4495-4506.
16. Divne C, Stahlberg J, Teeri TT, Jones TA. High-resolution crystal structures
reveal how a cellulose chain is bound in the 50 angstrom long tunnel of cellobiohydrolase I from Trichoderma reesei. Journal of Molecular Biology 1998;275(2):309-325.
17. Beguin P, Gilkes NR, Kilburn DG, Miller RC, Oneill GP, Warren RAJ.
Cloning of Cellulase Genes. Crc Critical Reviews in Biotechnology 1987;6(2):129-162.
18. Halle B. Flexibility and packing in proteins. Proceedings of the National
Academy of Sciences of the United States of America 2002;99(3):1274-1279.
19. Samanta U, Bahadur RP, Chakrabarti P. Quantifying the accessible surface
area of protein residues in their local environment. Protein Engineering 2002;15(8):659-667.
20. Rost B, Sander C. Conservation and prediction of solvent accessibility in
protein families. Proteins 1994;20(3):216-226.
21. Miller S, Lesk AM, Janin J, Chothia C. The Accessible Surface-Area and
TABLES
Table1. The dataset of Exo-glucanases from NCBI, CSA
PDB GH Catalytic Residues
1BVW 6 Y174 R179 D180 D226 align 1qk2
1CB2 6 F169 R174 D175 D221 align 1qk2
1GZ1 6 Y174 R179 D180 D226 align 1qk2
1HGW 6 Y169 R174 A175 D221 align 1qk2
1HGY 6 Y169 R174 A175 D221 align 1qk2
1OC5 6 Y174 R179 D180 D226 align 1qk2
1OC6 6 Y174 R179 D180 D226 align 1qk2
1OC7 6 Y174 R179 D180 D226 align 1qk2
1OC8 6 Y174 R179 D180 D226 align 1qk2
1OCJ 6 Y174 R179 D180 D226 align 1qk2
1OCN 6 Y174 R179 D180 D226 align 1qk2
1QJW 6 F169 R174 D175 D221 align 1qk2
1QK0 6 Y169 R174 D175 D221 align 1qk2
1QK2 6 Y169 R174 D92 D139
2BVW 6 Y174 R179 D180 D226 align 1qk2
3A64 6 Y96 R101 D102 D150 align 1qk2
3A9B 6 Y96 R101 D102 D150 align 1qk2
3ABX 6 Y96 R101 D102 D150 align 1qk2
3CBH 6 Y169 R174 D175 D221 align 1qk2
1CEL 7 E212 D214 E217 H228
1DY4 7 E212 D214 E217 H228 align 1cel
1EGN 7 E212 D214 E217 H228 align 1cel
1GPI 7 E207 D209 E212 H223 align 1cel
1H46 7 E207 D209 E212 H223 align 1cel
1Q2B 7 E212 D214 E217 H228 align 1cel
1Q2E 7 E212 D214 E217 H228 align 1cel
1Q9H 7 E209 D211 E214 H225 align 1cel
1Z3T 7 E207 D209 E212 H223 align 1cel
1Z3V 7 E207 D209 E212 H223 align 1cel
1Z3W 7 E207 D209 E212 H223 align 1cel
2CEL 7 E212 D214 E217 H228 align 1cel
2RFW 7 E212 D214 E217 H228 align 1cel
2RFY 7 E212 D214 E217 H228 align 1cel
2RFZ 7 E212 D214 E217 H228 align 1cel
2RG0 7 E212 D214 E217 H228 align 1cel
2V3I 7 E212 D214 E217 H228 align 1cel
3CEL 7 E212 D214 E217 H228 align 1cel
4CEL 7 E212 D214 E217 H228 align 1cel
5CEL 7 E212 D214 E217 H228 align 1cel
6CEL 7 E212 D214 E217 H228 align 1cel
7CEL 7 E212 D214 E217 H228 align 1cel
1RQ5 9 D383 D386 Q795 align 1js4
1EXP 10 E127 H205 E233 D235
1FH7 10 E127 H205 E233 D235 align 1exp
1FH8 10 E127 H205 E233 D235 align 1exp
1FH9 10 E127 H205 E233 D235 align 1exp
1FHD 10 E127 H205 E233 D235 align 1exp
1J01 10 E127 H205 E233 D235 align 1exp
2EXO 10 E127 H205 E233 D235 align 1exp
2HIS 10 A127
2XYL 10 E127 H205 E233 D235 align 1exp
3CUF 10 E127 H205 E233 D235 align 1exp
Table2. The dataset of Endo-glucanases from NCBI, CSA
PDB GH Catalytic Residues
1A3H 5 N138 E139 H200 Y202 E228 align 1bqc
1CEC 5 N139 E140 H198 Y200 E280 align 1bqc
1CEO 5 E140 E247 align 1cz1
1E5J 5 N138 E139 H200 Y202 E228 align 1bqc
1ECE 5 N161 E162 H238 Y240 E282 align 1bqc
1EDG 5 N169 E170 H254 Y256 E307 align 1bqc
1EGZ 5 N132 E133 H192 Y194 E220 align 1bqc
1G01 5 N372 E373 H442 Y444 E485 align 1bqc
1G0C 5 N372 E373 H442 Y444 E485 align 1bqc
1GZJ 5 N132 E133 H198 Y200 E240 align 1bqc
1H11 5 N138 E139 H200 Y202 E228 align 1bqc
1H1N 5 N132 E133 H198 Y200 E240 align 1bqc
1H2J 5 N138 E139 H200 Y202 E228 align 1bqc
1H5V 5 N138 E139 H200 Y202 E228 align 1bqc
1HF6 5 N138 E139 H200 Y202 E228 align 1bqc
1LF1 5 N138 E139 H200 Y202 E228 align 1bqc
1OCQ 5 N138 E139 H200 Y202 E228 align 1bqc
1QHZ 5 N138 E139 H200 Y202 E228 align 1bqc
1QI0 5 N138 E139 H200 Y202 E228 align 1bqc
1QI2 5 N138 E139 H200 Y202 E228 align 1bqc
1TVN 5 N134 E135 H194 Y196 E222 align 1bqc
1TVP 5 N134 E135 H194 Y196 E222 align 1bqc
1VJZ 5 R42 E139 E259 align 1fhl
1VRX 5 N161 E162 H238 Y240 E282 align 1bqc
1W3K 5 N138 E139 H200 Y202 E228 align 1bqc
1W3L 5 N138 E139 H200 Y202 E228 align 1bqc
2A3H 5 N138 E139 H200 Y202 E228 align 1bqc
2CKR 5 R185 E263 Q355 align 1fhl
2CKS 5 N262 E263 H328 Y330 E355 align 1bqc
2V38 5 N138 E139 H200 Y202 E228 align 1bqc
2ZUM 5 N200 E201 H297 Y299 E342 align 1bqc
2ZUN 5 N200 E201 H297 Y299 E342 align 1bqc
3A3H 5 N138 E139 H200 Y202 E228 align 1bqc
4A3H 5 N138 E139 H200 Y202 E228 align 1bqc
5A3H 5 N138 E139 H200 Y202 E228 align 1bqc
6A3H 5 N138 E139 H200 Y202 E228 align 1bqc
7A3H 5 N138 E139 H200 Y202 E228 align 1bqc
8A3H 5 N138 E139 H200 Y202 E228 align 1bqc
1DYS 6 Y86 R91 D92 D139 align 1qk2
1TML 6 D117 D265
2BOD 6 Y73 R78 D110 D117 align 1qk2
2BOE 6 D117 D265 align 1tml
2BOF 6 D117 D265 align 1tml
2BOG 6 D117 D265 align 1tml
1A39 7 E197 D199 E202 H213 align 1cel
1DYM 7 A197 D199 E202 H213 align 1cel
1EG1 7 E196 D198 E201 H212 align 1cel
1OJI 7 S197 D199 E202 H213 align 1cel
1OJJ 7 S197 D199 E202 H213 align 1cel
1OJK 7 S197 D199 E202 H213 align 1cel
1OVW 7 E197 D199 E202 H213 align 1cel
2A39 7 E197 D199 E202 H213 align 1cel
2OVW 7 E197 D199 E202 H213 align 1cel
3OVW 7 E197 D199 E202 H213 align 1cel
4OVW 7 E197 D199 E202 H213 align 1cel
1CLC 9 D198 D201 E555 align 1js4
1G87 9 D55 D58 E420 align 1js4
1IA6 9 D56 D59 E410 align 1js4
1IA7 9 D86 D89 E410 align 1js4
1JS4 9 D55 D58 E424 1K72 9 D55 D58 E420 align 1js4 1KFG 9 D55 D58 E420 align 1js4 1KS8 9 D54 D57 E412 align 1js4 1KSC 9 D54 D57 E412 align 1js4 1KSD 9 D54 D57 E412 align 1js4 1TF4 9 D55 D58 E424 align 1js4
1UT9 9 D383 D386 E555 align 1js4
3EZ8 9 D143 D146 E515 align 1js4
3GZK 9 D143 D146 E515 align 1js4
3H2W 9 D143 D146 E515 align 1js4
3H3K 9 D143 D146 E515 align 1js4
4TF4 9 D55 D58 E424 align 1js4
2DEP 10 E185 H264 E293 D295 align 1exp
1H8V 12 E116 align 2nlr
1KS4 12 E116 align 2nlr
1KS5 12 E116 align 2nlr
1NLR 12 E120 align 2nlr
1OA2 12 E116 align 2nlr
1OA3 12 E116 align 2nlr
1OLQ 12 E116 align 2nlr
1OLR 12 E120 align 2nlr
1QA3 12 E116 align 2nlr
1QA4 12 E120 align 2nlr
1UU4 12 E120 align 2nlr
1UU5 12 E120 align 2nlr
1UU6 12 E120 align 2nlr
1W2U 12 E120 align 2nlr
2BW8 12 E124 align 2nlr
2BWA 12 E124 align 2nlr
2BWC 12 E124 align 2nlr
2JEM 12 Q155 align 2nlr
2JEN 12 A155 align 2nlr
2NLR 12 E120
3B7M 12 E114 align 2nlr
2UWA 16 E94 D96 E98 align 2ayh
2UWB 16 E94 D96 E98 align 2ayh
2UWC 16 E94 D96 E98 align 2ayh
2VH9 16 E94 D96 E98 align 2ayh
2E0P 44 E186 align 1pz3
2E4T 44 E186 align 1pz3
2EEX 44 E186 align 1pz3
2EJ1 44 E186 align 1pz3
2EO7 44 E186 align 1pz3
2EQD 44 E186 align 1pz3
3FW6 44 E221 align 1pz3
3II1 44 E221 align 1pz3
1HD5 45 D10 D122 align 2eng
1L8F 45 D10 D120 align 2eng
1QA7 45 D10 D120 align 2eng
1QA9 45 D10 D120 align 2eng
2ENG 45 D10 D121
3ENG 45 D10 D121 align 2eng
4ENG 45 D10 D121 align 2eng
Table3. Proteins have own catalytic residues data from literature
PDB GH Catalytic Residues
1JS4 9 D55 D58
1TML 6 D117 D256
2ENG 45 D10 D121
2NLR 12 E120
1CEL 7 E212 D214 E217 H228
1EXP 10 E127 H205 E233 D235
1QK2 6 Y169 R174 D175 D221 2HIS 10 A127
Table4. Bindings site residues of each protein from literatures
PDB Binding Residues
1JS49 H125 W128 F205 W209 W256 D261 W313 R317
R378 Y429
1TML10 W41 Y73 D117 D155 H159 W162 S189 W231 E263
D265 A271
2ENG11 T6 R7 Y8 D10 K13 W18 A19 K21 S45 E82 S110 H119 D121 G127
G128 V129 Y147 G148 D178 N179 Endo-
glucanase
2NLR12 F8 N22 W24 H65 Y66 N100 D104 W106 E120 M122
N155 S157 Q199 E203 1CEL15 N141 Y145 E217 H228 W367
1EXP15 W84 N126 Y171 H205 E233
1QK216 W135 D137 Y169 R174 D175 D221 H266 W269 N305 R353 W376 K395 E399 D401 Exo- glucanase 2HIS17 A127 H205
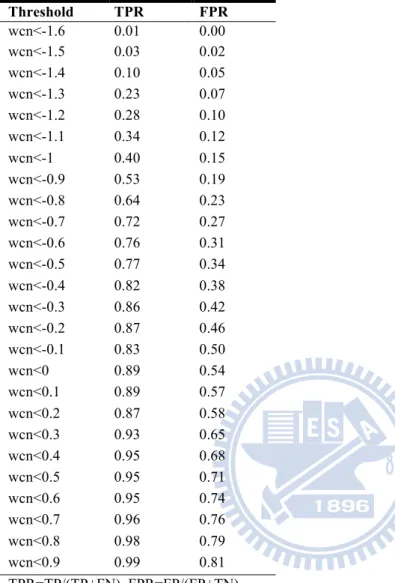
Table 5.1. The measurement of all dataset
Threshold TPR FPR wcn<-1.6 0.01 0.00 wcn<-1.5 0.03 0.02 wcn<-1.4 0.10 0.05 wcn<-1.3 0.23 0.07 wcn<-1.2 0.28 0.10 wcn<-1.1 0.34 0.12 wcn<-1 0.40 0.15 wcn<-0.9 0.53 0.19 wcn<-0.8 0.64 0.23 wcn<-0.7 0.72 0.27 wcn<-0.6 0.76 0.31 wcn<-0.5 0.77 0.34 wcn<-0.4 0.82 0.38 wcn<-0.3 0.86 0.42 wcn<-0.2 0.87 0.46 wcn<-0.1 0.83 0.50 wcn<0 0.89 0.54 wcn<0.1 0.89 0.57 wcn<0.2 0.87 0.58 wcn<0.3 0.93 0.65 wcn<0.4 0.95 0.68 wcn<0.5 0.95 0.71 wcn<0.6 0.95 0.74 wcn<0.7 0.96 0.76 wcn<0.8 0.98 0.79 wcn<0.9 0.99 0.81 TPR=TP/(TP+FN), FPR=FP/(FP+TN) TP: true positive, TN: true negative, FN: false negative, FP: false positive.
Table 5.2. The measurement of endo-glucanase
Threshold TPR FPR wcn<-1.6 0.02 0.00 wcn<-1.5 0.02 0.02 wcn<-1.4 0.08 0.05 wcn<-1.3 0.11 0.08 wcn<-1.2 0.20 0.11 wcn<-1.1 0.29 0.13 wcn<-1 0.32 0.15 wcn<-0.9 0.47 0.18 wcn<-0.8 0.49 0.22 wcn<-0.7 0.51 0.26 wcn<-0.6 0.54 0.30 wcn<-0.5 0.54 0.33 wcn<-0.4 0.63 0.38 wcn<-0.3 0.72 0.42 wcn<-0.2 0.74 0.46 wcn<-0.1 0.66 0.50 wcn<0 0.78 0.54 wcn<0.1 0.78 0.57 wcn<0.2 0.80 0.61 wcn<0.3 0.87 0.65 wcn<0.4 0.89 0.68 wcn<0.5 0.89 0.72 wcn<0.6 0.89 0.74 wcn<0.7 0.93 0.76 wcn<0.8 0.96 0.78 wcn<0.9 0.98 0.81
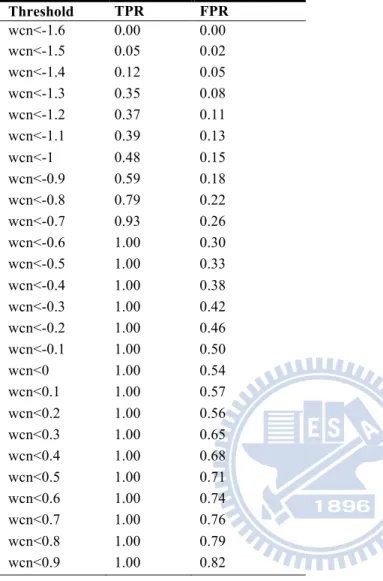
Table 5.3. The measurement of exo-glucanases
Threshold TPR FPR wcn<-1.6 0.00 0.00 wcn<-1.5 0.05 0.02 wcn<-1.4 0.12 0.05 wcn<-1.3 0.35 0.08 wcn<-1.2 0.37 0.11 wcn<-1.1 0.39 0.13 wcn<-1 0.48 0.15 wcn<-0.9 0.59 0.18 wcn<-0.8 0.79 0.22 wcn<-0.7 0.93 0.26 wcn<-0.6 1.00 0.30 wcn<-0.5 1.00 0.33 wcn<-0.4 1.00 0.38 wcn<-0.3 1.00 0.42 wcn<-0.2 1.00 0.46 wcn<-0.1 1.00 0.50 wcn<0 1.00 0.54 wcn<0.1 1.00 0.57 wcn<0.2 1.00 0.56 wcn<0.3 1.00 0.65 wcn<0.4 1.00 0.68 wcn<0.5 1.00 0.71 wcn<0.6 1.00 0.74 wcn<0.7 1.00 0.76 wcn<0.8 1.00 0.79 wcn<0.9 1.00 0.82
Table 6. Endo-glucanase 1TML. The comparison with WCN and WCN & RSA included.
1TML TP FP FN TN Sensitivity (%) Specificity (%)
WCN (< -0.5) 7 94 4 181 64 66
WCN (< -0.5) & RSA (≥ 0.05) 5 24 6 251 45 91
TP: true positive, FP: false positive, FN: false negative, TN: true negative, Sensitivity: TP/(TP+FN), Specificity: 1-(FP/(FP+TN)), All statistical measures are percentage value (%).
Table 7. Endo-glucanase 2ENG. The comparison with WCN and WCN & RSA included.
2ENG TP FP FN TN Sensitivity (%) Specificity (%)
WCN (< -0.5) 10 63 10 122 50 66
WCN (< -0.5) & RSA (≥ 0.05) 9 19 11 167 47 90
TP: true positive, FP: false positive, FN: false negative, TN: true negative, Sensitivity: TP/(TP+FN), Specificity: 1-(FP/(FP+TN)), All statistical measures are percentage value (%).
Table 8. Endo-glucanase 1JS4. The comparison with WCN and WCN & RSA included.
1JS4 TP FP FN TN Sensitivity (%) Specificity (%)
WCN (< -0.5) 4 220 6 375 40 63
WCN (< -0.5) & RSA (≥ 0.05) 3 52 7 543 30 91
TP: true positive, FP: false positive, FN: false negative, TN: true negative, Sensitivity: TP/(TP+FN), Specificity: 1-(FP/(FP+TN)), All statistical measures are percentage value (%).
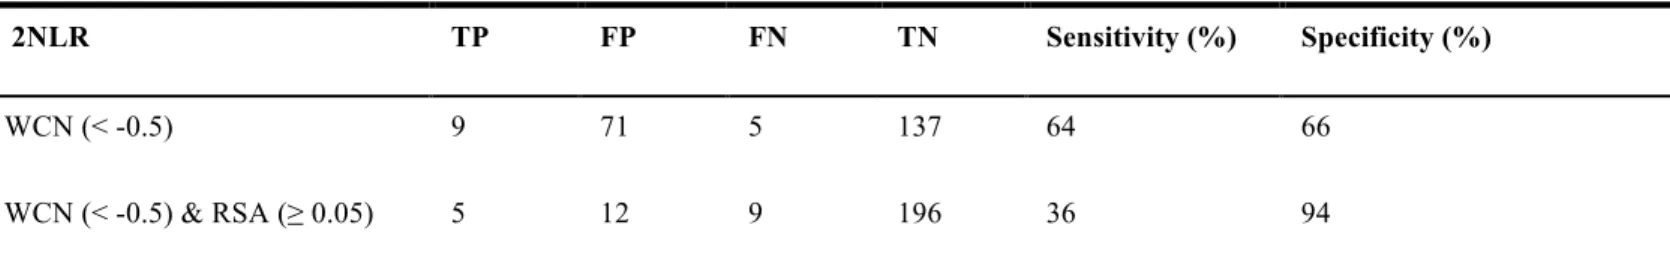
Table 9. Endo-glucanase 2NLR. The comparison with WCN and WCN & RSA included.
2NLR TP FP FN TN Sensitivity (%) Specificity (%)
WCN (< -0.5) 9 71 5 137 64 66
WCN (< -0.5) & RSA (≥ 0.05) 5 12 9 196 36 94
TP: true positive, FP: false positive, FN: false negative, TN: true negative, Sensitivity: TP/(TP+FN), Specificity: 1-(FP/(FP+TN)), All statistical measures are percentage value (%).
Table 10. Exo-glucanase 1CEL. The comparison with WCN and WCN & RSA included.
1CEL TP FP FN TN Sensitivity (%) Specificity (%)
WCN (< -0.8) 5 96 0 333 100 78
WCN (< -0.8) & RSA (≥ 0.08) 3 19 2 410 60 96
TP: true positive, FP: false positive, FN: false negative, TN: true negative, Sensitivity: TP/(TP+FN), Specificity: 1-(FP/(FP+TN)), All statistical measures are percentage value (%).
Table 11. Exo-glucanase 1QK2. The comparison with WCN and WCN & RSA included.
1QK2 TP FP FN TN Sensitivity (%) Specificity (%)
WCN (< -0.8) 9 74 5 275 64 79
WCN (< -0.8) & RSA (≥ 0.08) 8 8 6 314 57 97
TP: true positive, FP: false positive, FN: false negative, TN: true negative, Sensitivity: TP/(TP+FN), Specificity: 1-(FP/(FP+TN)), All statistical measures are percentage value (%).
Table 12. Exo-glucanase 1EXP. The comparison with WCN and WCN & RSA included.
1EXP TP FP FN TN Sensitivity (%) Specificity (%)
WCN <-0.8 5 67 0 240 100 78
WCN (< -0.8) & RSA (≥ 0.08) 4 6 1 301 80 98
TP: true positive, FP: false positive, FN: false negative, TN: true negative, Sensitivity: TP/(TP+FN), Specificity: 1-(FP/(FP+TN)), All statistical measures are percentage value (%).
Table 13. The comparison of WCN with WCN include RSA
Sensitivity (%) Specificity (%) Endo-glucanase (< -0.5) 79 78 Exo-glucanase (< -0.8) 54 65 WCN Average 67 72 Endo-glucanase (< -0.5) 40 92 Exo-glucanase (< -0.8) 65 97 WCN & RSA Average 51 94
FIGURES
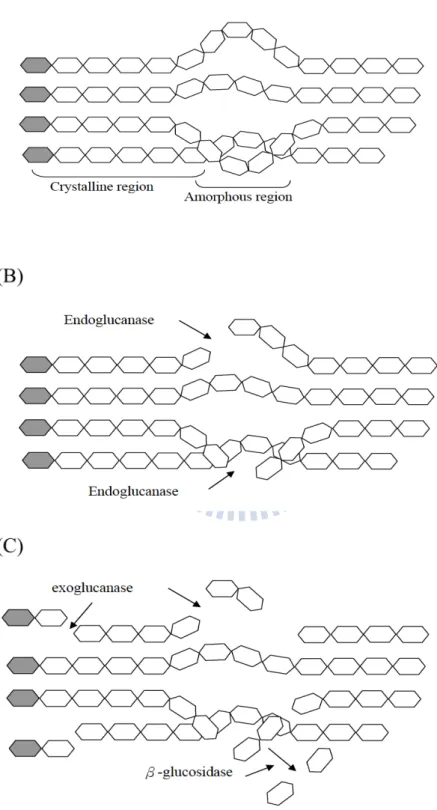
Figure 1.The processive synergy mechnism of cellulose hydrolysis. (A) Cellulose
consist crystalline region and amorphous region. (B) Endo-glucanase cut at the
internal amorphous sites. (C) Exo-glucanase acts on the reducing or nonreducing ends of chains. β-glucosidases hydrolyze soluble cellodextrins and cellobiose to glucose.
(A)
(B)
Figure 2.WCN z-score distribution of literature binding site residues. The frequency
of endo-glucanase (A) binding residues colored in black compared with exo-glucanase (B) binding residues colored in white.
0 1 2 3 4 5 6 7 8 -‐1.7 -‐1.6 -‐1.5 -‐1.4 -‐1.3 -‐1.2 -‐1.1 -‐1 -‐0.9 -‐0.8 -‐0.7 -‐0.6 -‐0.5 -‐0.4 -‐0.3 -‐0.2 -‐0.1 0 0.1 0.2 0.3 0.4 0.5 0.6 0.7 0.8 0.9 1 1.1 1.2 1.3 1.4 1.5 1.6 Fr eq u en cy WCN (zscore)
Endo
0 1 2 3 4 5 6 7 -‐1.6 -‐1.5 -‐1.4 -‐1.3 -‐1.2 -‐1.1 -‐1 -‐0.9 -‐0.8 -‐0.7 -‐0.6 -‐0.5 Fr eq u en cy WCN (zscore)Exo
(A) (B) (C)
Figure3. The diagram of relationship TPR and FPR from top to the bottom are (A) all selected cellulase dataset, (B) endo-glucanase group, (C) exo-glucanase group. 0.00 0.20 0.40 0.60 0.80 1.00 0.00 0.20 0.40 0.60 0.80 1.00 TPR FPR 0.00 0.20 0.40 0.60 0.80 1.00 0.00 0.20 0.40 0.60 0.80 1.00 TPR FPR 0.00 0.20 0.40 0.60 0.80 1.00 0.00 0.20 0.40 0.60 0.80 1.00 TPR FPR
(A) (B)
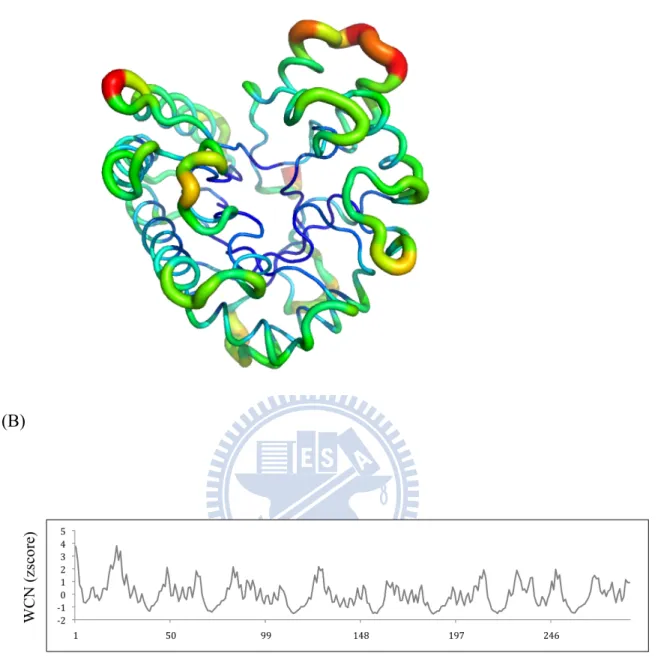
Figure 4. (A) 1TML protein WCN model in putty form. (B) The WCN z- score distribution of protein 1TML.
(C)
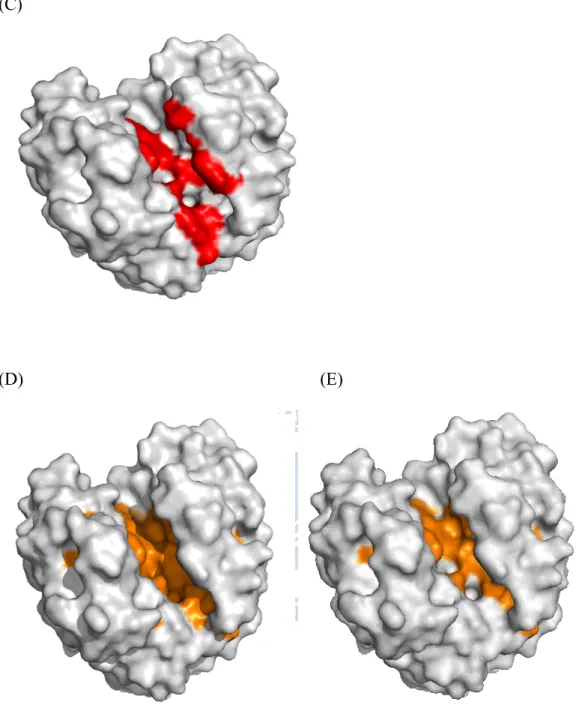
(D) (E)
Figure 4. Proteins are surface form. (C) 1TML experimental binding site residues colored in red. (D) The residues under WCN threshold (< -0.5) are colored in orange. (E) The residues selected include WCN and RSA threshold are also colored in orange.
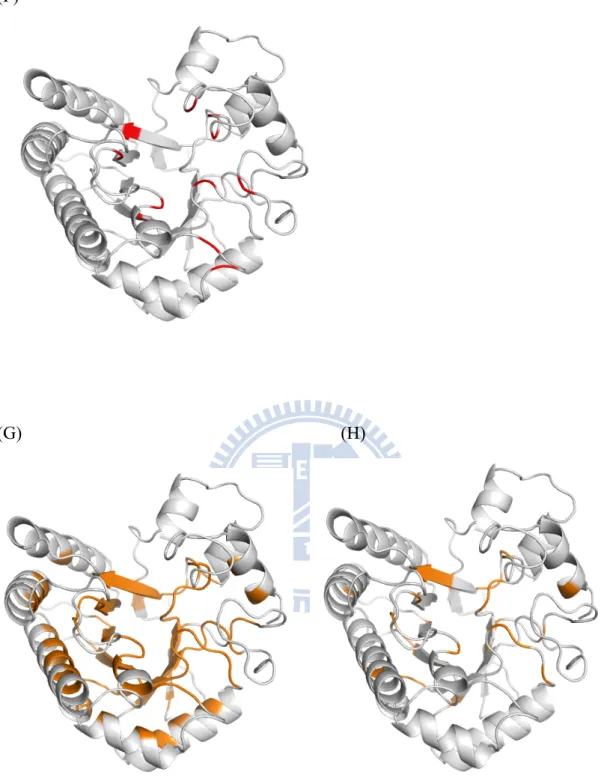
(F) (G) (H)
Figure 4. Proteins are cartoon form. (F) 1TML experimental binding site residues colored in red. (G) The residues under WCN threshold (< -0.5) are colored in orange. (H) The residues selected include WCN and RSA threshold are also colored in orange.
(A)
(B)
Figure 5. (A) 2ENG protein WCN model in putty form. (B) The WCN z- score distribution of protein 2ENG.
(C)
(D) (E)
Figure 5. Proteins are surface form. (C) 2ENG experimental binding site residues colored in red. (D) The residues under WCN threshold (< -0.5) are colored in orange. (E) The residues selected include WCN and RSA threshold are also colored in orange.
(F)
(G) (H)
Figure 5. Proteins are cartoon form. (F) 2ENG experimental binding site residues colored in red. (G) The residues under WCN threshold (< -0.5) are colored in orange. (H) The residues selected include WCN and RSA threshold are also colored in orange.
(A)
(B)
Figure 6. (A) 1JS4 protein WCN model in putty form. (B) The WCN z- score distribution of protein 1JS4.
(C)
(D)
(E)
Figure 6. Proteins are surface form. (C) 1JS4 experimental binding site residues colored in red. (D) The residues under WCN threshold (< -0.5) are colored in orange. (E) The residues selected include WCN and RSA threshold are also colored in orange.
(F)
(G)
(H)
Figure 6. Proteins are cartoon form. (F) 1CEL experimental binding site residues colored in red. (G) The residues under WCN threshold (< -0.5) are colored in orange. (H) The residues selected include WCN and RSA threshold are also colored in
(A)
(B)
Figure 7. (A) 2NLR protein WCN model in putty form. (B) The WCN z- score distribution of protein 2NLR.
(C) (D) (E)
Figure 7. Proteins are surface form. (C) 2NLR experimental binding site residues colored in red. (D) The residues under WCN threshold (< -0.5) are colored in orange. (E) The residues selected include WCN and RSA threshold are also colored in orange.
(F)
(G) (H)
Figure 7. Proteins are cartoon form. (F) 2NLR experimental binding site residues colored in red. (G) The residues under WCN threshold (< -0.5) are colored in orange. (H) The residues selected include WCN and RSA threshold are also colored in orange.
(A)
(B)
Figure 8. (A) 1CEL protein WCN model in putty form. (B) The WCN z- score distribution of protein 1CEL.
(C)
(D) (E)
Figure 8. Proteins are cartoon form. (C) 1CEL experimental binding site residues colored in red. (G) The residues under WCN threshold (< -0.8) are colored in orange. (H) The residues selected include WCN and RSA threshold are also colored in orange.
(A)
(B)
Figure 9. (A) 1QK2 protein WCN model in putty form. (B) The WCN z- score distribution of protein 1QK2.
(C)
(D) (E)
Figure 9. Proteins are cartoon form. (C) 1QK2 experimental binding site residues colored in red. (G) The residues under WCN threshold (< -0.8) are colored in orange. (H) The residues selected include WCN and RSA threshold are also colored in orange.
(A)
(B)
Figure 10. (A) 1EXP protein WCN model in putty form. (B) The WCN z- score distribution of protein 1EXP.
(C) (D) (E)
Figure 10. Proteins are surface form. (C) 1EXP experimental binding site residues colored in red. (D) The residues under WCN threshold (< -0.8) are colored in orange. (E) The residues selected include WCN and RSA threshold are also colored in orange.
(F)
(G) (H)
Figure 10. Proteins are cartoon form. (C) 1EXP experimental binding site residues colored in red. (G) The residues under WCN threshold (< -0.8) are colored in orange. (H) The residues selected include WCN and RSA threshold are also colored in orange.
(A) (B) (C) (D)
Figure 11. The frequency of amino acid type in cellulase experimental binding site compared with our method of binding site prediction base on WCN including RSA. Figures (A) to (D) show as follows, Endo-glucanases, Exo-glucanases in experimental and Endo-glucanases, Exo-glucanases based on our method.
-‐1 4 9 14
G A V L I M P F W Y C S T N Q D E H R K
Fr eq u en cy -‐1 4 9 14
G A V L I M P F W Y C S T N Q D E H R K
Fr eq u en cy -‐1 4 9 14
G A V L I M P F W Y C S T N Q D E H R K
Fr eq u en cy -‐1 4 9 14
G A V L I M P F W Y C S T N Q D E H R K
Fr eq u en cy