在低頻寬網路環境中利用內容感知之視訊調整
71
0
0
全文
(2) 在低頻寬網路環境中利用內容感知之視訊調整 Content-Aware Video Adaptation in Low Bit-rate Constraint. 研 究 生:周冠宏. Student:Kuan-Hung Chou. 指導教授:李素瑛 教授. Advisor:Prof. Suh-Yin Lee. 國 立 交 通 大 學 資 訊 工 程 系 碩 士 論 文. A Thesis Submitted to Department of Computer Science and Information Engineering College of Electrical Engineering and Computer Science National Chiao Tung University in partial Fulfillment of the Requirements for the Degree of Master in. Computer Science and Information Engineering June 2005 Hsinchu, Taiwan, Republic of China. 中華民國九十四年六月.
(3) 在低頻寬網路環境中利用內容感知之視訊調整. 研究生:周冠宏. 指導教授:李素瑛 教授. 國立交通大學資訊工程研究所. 摘. 要. 隨著無線網路的發展與可攜式隨身裝置能力的提升,視訊傳遞的應 用越來越廣泛。在有限的資源和與生俱來的限制下,如何適當地調整視 訊成為無線多媒體應用相關領域一個最重要且富挑戰性的議題。在這篇 論文中,我們提出了一個以內容為依據的視訊調整方法,讓資源能夠有 效地利用,並提高影片的視覺品質。藉由分析影片中物件的亮度、位置、 移動向量與能量等屬性,配合客戶端裝置能力與關聯性統計模型取得場 景中較吸引注意的部分。利用區域加權速度失真模型、位元配置與視訊 調整方法,動態地從物件、畫面與 GOP 三個層面來做視訊串流的調整。 從實驗結果可以看出所提出的方法相當實用並可達到較好的品質。. i.
(4) Content-Aware Video Adaptation in Low Bit-rate Constraint. Student: Kuan-Hung Chou. Advisor: Prof. Suh-Yin Lee. Institute of Computer Science and Information Engineering National Chiao Tung University. Abstract With the development of wireless and the improvement of mobile device capability, video streaming is more and more widespread applied in such environment. Under the limited resource and inherent constraints, appropriate video adaptation has become one of the most important and challenging issues in wireless multimedia application related areas. We propose a novel approach to adapt video based on content information in order to effectively utilize resource and improve visual perceptual quality in this thesis. According to the analyzed characteristics of brightness, location, motion vector, and energy features, combined with capability of client device and correlational statistic model, the attractive or interesting regions of video scene are derived. Therefore, the Region Weighted Rate-Distortion is used for adjusting the bit allocation. Video adaptation scheme dynamically adapt video bitstream through object, frame, and GOP levels. Experimental results show that the proposed scheme is efficient and achieves better visual quality.. ii.
(5) Acknowledgment I greatly appreciate the kind guidance of my advisor, Prof. Suh-Yin Lee. Without her graceful encouragement and conscientiously guidance, I would not complete this thesis. Besides, thanks are extended to all the members in the Information System Laboratory for their suggestion and instruction, especially Mr. Duan-Yu Chen, Mr. Ming-Ho Hsiao, Mr. Yi-Wen Chen and Miss Hui-Chun Wu. Finally, I would like to express my appreciation to my family and my friends for their supports and consideration. This thesis is dedicated to them.. iii.
(6) Table of Contents Abstract (in Chinese) ............................................................................................................... i Abstract (in English)............................................................................................................... ii Acknowledgment.................................................................................................................... iii Table of Contents ................................................................................................................... iv Lists of Tables ......................................................................................................................... vi Lists of Figures ...................................................................................................................... vii Chapter 1 Introduction........................................................................................................... 1. 1.1 Motivation................................................................................................................... 1 1.2 Problem Statement ...................................................................................................... 2 1.3 Organization................................................................................................................ 2 Chapter 2 Background ........................................................................................................... 3. 2.1 Overview of MPEG Standard ..................................................................................... 3 2.2 Related Work............................................................................................................... 6 2.2.1 General Video Adaptation Concepts ................................................................ 6 2.2.2 Video Compressed-Domain Features............................................................... 8 2.2.3 Content-based Video Adaptation ................................................................... 10 Chapter 3 Content-Aware Video Adaptation in Low Bitrate Constraint ........................ 14. 3.1 Overview of the Proposed Scheme ........................................................................... 14 3.2 Video Analyzer.......................................................................................................... 15 3.2.1 Data Extraction .............................................................................................. 15 3.2.2 "Information Object" (IO) Derivation............................................................ 17 3.2.3 Feature Selection for Visual Effect ................................................................ 19 3.3 Adaptation Decision.................................................................................................. 29 3.3.1 Content........................................................................................................... 30 iv.
(7) 3.3.2 Device Capability........................................................................................... 30 3.3.3 Correlational Statistic Model ......................................................................... 34 3.3.4 Decision Principle.......................................................................................... 36 3.4 Bitstream Adaptation ................................................................................................ 38 3.4.1 Region Weighted Rate-Distortion Model ...................................................... 38 3.4.2 Bit Allocation Scheme ................................................................................... 40 Chapter 4 Experimental Results and Discussion ............................................................... 43 Chapter 5 Conclusion and Future Work ............................................................................ 58 Bibliography .......................................................................................................................... 59. v.
(8) Lists of Tables Table 3-1. The input data of video analyzer. .......................................................................... 16 Table 3-2. The video types are classified according to motion vector. .................................. 25 Table 3-3. The importance of feature in different video classes. ........................................... 37 Table 4-1. Test sequences of Motion Class. ........................................................................... 53 Table 4-2. The accuracy of Motion Class............................................................................... 53. vi.
(9) Lists of Figures Fig. 2-1. An example of I-, P-, and B-structure in MPEG coding............................................ 4 Fig. 2-2. Block diagram of a typical encoding sequence using the DCT. ................................ 5 Fig. 2-3. Block-based motion compensation. ........................................................................... 6 Fig. 2-4. Illustration of common video transcoding operations................................................ 8 Fig. 2-5. Simulation results utilizing perceptual video streaming by adaptive spatial-. temporal scalability. ................................................................................................. 12 Fig. 2-6. Static attention model generate Saliency Map. ........................................................ 13 Fig. 3-1. The architecture of the proposed system.................................................................. 15 Fig. 3-2. An example of the content representation model..................................................... 19 Fig. 3-3. Utilizing brightness to derive IO.............................................................................. 20 Fig. 3-4. Perceptual distortion comparison between different brightness. ............................. 20 Fig. 3-5. Location based brightness histogram. ...................................................................... 22 Fig. 3-6. Comparison of the IO derived from brightness. ...................................................... 22 Fig. 3-7. Location weighting map and adapted video. ........................................................... 23 Fig. 3-8. An example of edge field. ........................................................................................ 26 Fig. 3-9. Horizontal and vertical edge features of DCT coefficients in an 8x8 block. ........... 27 Fig. 3-10. The 64 (8 x 8) DCT basis images........................................................................... 27 Fig. 3-11. Comparison of the visual distortion in different edge energy regions. .................. 28 Fig. 3-12. The energy attention model.................................................................................... 29 Fig. 3-13. Deliver media content through various network channels matching the. diversity of devices. ............................................................................................... 31 Fig. 3-14. Resolution-considered adaptation. ......................................................................... 32 Fig. 3-15. Information Object correlation............................................................................... 34 Fig. 3-16. The Information Object in distinct videos. ............................................................ 35 vii.
(10) Fig. 3-17. The relation between densities of IO and centricity regions.................................. 36 Fig. 3-18. The candidates of location weighting map and the suitable video. ....................... 36 Fig. 3-19. Frame based dynamic bit allocation scheme.......................................................... 42 Fig. 4-1. Interface of Video Analyzer. .................................................................................... 44 Fig. 4-2. Information Object results of Video Analyzer.. ....................................................... 46 Fig. 4-3. Information Object results of Video Analyzer in later frames. ................................ 47 Fig. 4-4. Comparison of visual quality influenced by resolution. .......................................... 48 Fig. 4-5. The PSNR and MPSNR in different bitrate constraints........................................... 49 Fig. 4-6. Comparison of visual quality in very low bitrate constraint.................................... 50 Fig. 4-7. The videos used in analyzing Motion Class process................................................ 51 Fig. 4-8. Motion magnitude mean of four Motion Class videos. ........................................... 51 Fig. 4-9. Motion magnitude variance of four Motion Class videos........................................ 51 Fig. 4-10. Percentage of zero motion of four Motion Class videos........................................ 52 Fig. 4-11. Motion direction histogram of videos belonging to Motion Class 3 and 4............ 52 Fig. 4-12. Motion Classification results of test sequences. .................................................... 53 Fig. 4-13. Example of Bit allocation scheme. ........................................................................ 54 Fig. 4-14. Comparison of visual quality. ................................................................................ 57. viii.
(11) Chapter 1 Introduction 1.1 Motivation With the development of wireless and the improvement of mobile device capability, the desire for mobile users to access video is becoming stronger. These devices including cellphone (smart phone), PDA, and laptop have enough computing capability to decode and display video and receive video via wireless channel, like 802.11. However, due to some inherent constraints in wireless multimedia application, like limited bandwidth in wireless and high variation in device resource, how to adequately utilize such resource to get better quality is an important issue. Video adaptation is usually used in response to the huge variation of resource constraints. In traditional video adaptation, the adapter considers available bit rate and network buffer occupancy to adjust the transmitted data while streaming video. Although the viewpoint of Information Theory, same bitrates deliver same amount of information, it may be not true for human visual perception. When viewing video presentations, viewers can only be attracted to a relatively small part of the video display with acuity drop-off in peripheral areas at any point in time. Accordingly, by adjusting allocation of bitrate from peripheral regions of the frame to regions-of-interest, viewers can get better visual perceptual quality. So, in opposition to traditional video adaptation, content-based video adaptation can effectively utilize content information of video in bit allocation and adaptation and is a promising research direction. In this thesis, a content aware video adaptation is proposed based on visual attention model. It first analyzes the content of video to derive the important regions which have high degree of attraction level; then allocate bitrate and assign adapting scheme according 1.
(12) to the content information in order to acquire better visual quality and avoid unnecessary resource waste in low bitrate constrain.. 1.2 Problem Statement The problem addressed in this thesis is to utilize content information for improving the quality of a transmitted video bitstream subject to low bit-rate constraints, which especially applies to mobile device in wireless network environment. In this thesis, three major issues are considered: (1) How to quickly derive the important object from video. (2) How to adapt video streams according to content and mobile device condition. (3) How to find an appropriate video adaptation approach or combination to get the better quality. In the following chapters, we will analyze related issues through theory and experiments and thereupon present a system to deal with it.. 1.3 Organization The rest of this thesis is organized as follows. In Chapter 2, we introduce some background knowledge required for video technology. We also survey the previous research works on content analysis techniques and video adaptation methods. In Chapter 3, we propose the design issues of content aware video adaptation in low bitrate constraint, including video analyzer, adaptation decision, and bitstream adaptation. The experimental results and discussion will be presented in Chapter 4. Finally, we conclude the thesis and describe the future works in Chapter 5.. 2.
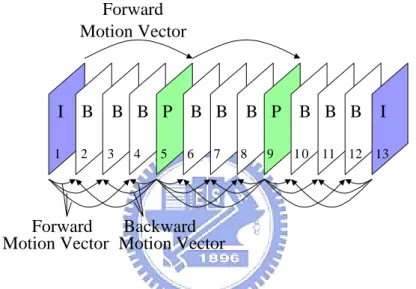
(13) Chapter 2 Background In Chapter 2, we introduce the background knowledge related to video content analysis and video adaptation. Section 2.1 presents a brief overview of MPEG standard. In Section 2.2, we describe some research efforts for traditional video adaptation, video compressed domain features, and content-based video adaptation.. 2.1 Overview of MPEG Standard MPEG is the international standard [1] [2] for moving picture video compression, which is an acronym for Moving Picture Experts Group. The MPEG activities cover video signal compression, digital audio signal compression and the issue of audio-visual synchronization. For saving transmission bandwidth and data storage, multimedia processing systems require data compression. The processing of video in the proposed approach is in compressed domain, because MPEG standard provides good compression. Since the research of the thesis is about video data, we focus on the overview of the video compression in this section. The MPEG Video standard specifies the video bitstream syntax and the corresponding video decoding process. The MPEG Video syntax supports three types of coded frames or pictures, intra (I-) pictures, coded separately by themselves; predictive (P-) pictures, coded with respect to the immediately previous I- or P-picture; and bidirectionally predictive (B-) pictures, coded with respect to the immediately previous I- or P-picture as well as the immediately next P- or I-picture.. 3.
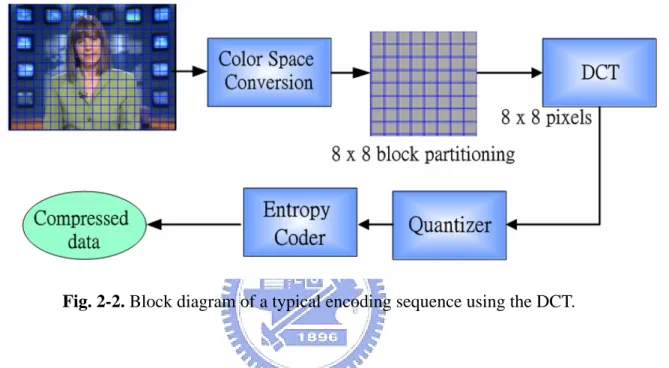
(14) Fig. 2-1 shows an example picture structure in MPEG video coding that uses three B-pictures between two reference (I- or P-) pictures. In MPEG video coding, an input video sequence is divided into groups of pictures (GOPs), where each GOP typically starts with an I-picture and the rest of the GOP contains an arrangement of P-pictures and B-pictures. A GOP serves as a basic access unit, with the I-picture serving as the entry point to facilitate random access.. Forward Motion Vector. I. B. 1. 2. B B P 3. 4. 5. B B 6. 7. B P 8. 9. B B B. I. 1 0 11 12 13. Forward Backward Motion Vector Motion Vector. Fig. 2-1. An example of I-, P-, and B-structure in MPEG coding.. There are some core techniques used in MPEG standard, such as block-based transform coding, predictive coding, entropy coding, motion-compensated interpolation, etc. The most important ones are block-based transform coding and motion compensation. Block-based transform coding reduces the spatial redundancy in digital video. The substantial correlation between neighboring pixels is greatly reduced in transformed coefficients. These coefficients need not be coded with full accuracy and can be entropy-coded efficiently for compression. The 8x8-block discrete cosine transform (DCT) is popularly used for its near-optimal performance and high speed using fast. 4.
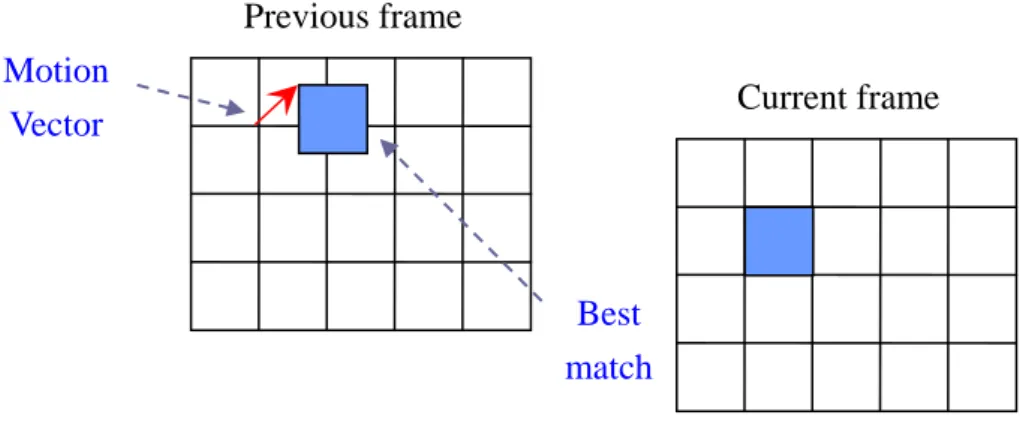
(15) algorithms. A typical encoding sequence using the DCT is illustrated in Fig. 2-2. Note that in video compression other techniques are also involved, so that the actual encoder diagram is much more complex. The DCT is also used to encode differential data and residue errors after motion compensation.. Fig. 2-2. Block diagram of a typical encoding sequence using the DCT.. Block-based motion compensation significantly reduces the temporal redundancy in digital video, as shown in Fig. 2-3. A best match of the same dimension is found for each block in the current frame, thus only the difference (residue error) between the block and its match needs to be coded. In MPEG-1 and MPEG-2, backward and bi-directional motion compensations are also used. These techniques provide a much higher coding efficiency than encoding each frame without looking at its adjacent frames for similarities. The unit of motion compensation is usually 16x16 blocks, termed macroblocks (MB) in MPEG video. The frequency of motion compensation and how it is done are flexible to allow for the tradeoff between encoding complexity and performance.. 5.
(16) Previous frame Motion Vector. Current frame. Best match. Fig. 2-3. Block-based motion compensation.. 2.2 Related Work In this section, we briefly describe several existing methods related to our research. In Section 2.2.1, we review the related concepts for video adaptation. Section 2.2.2 describes the content features of video compressed-domain. Finally, in Section 2.2.3, we introduce the related approaches for content-based video adaptation.. 2.2.1 General Video Adaptation Concepts In pervasive media environments, users may access multimedia content on different types of terminals and networks with the development of multimedia systems and the advancement of information technology. There are many critical needs in such ubiquitous media access environments, and the most important issues are the ability to handle the huge variation of resource constraints and adequately utilize such resource to get better quality. Video adaptation is an emerging field that includes a body of knowledge and techniques responding to the above challenges. It transforms the input video to an output video or augmented multimedia form by manipulating at multiple levels (signal, structural, or semantic) in order to meet diverse resource constraints and user preferences. 6.
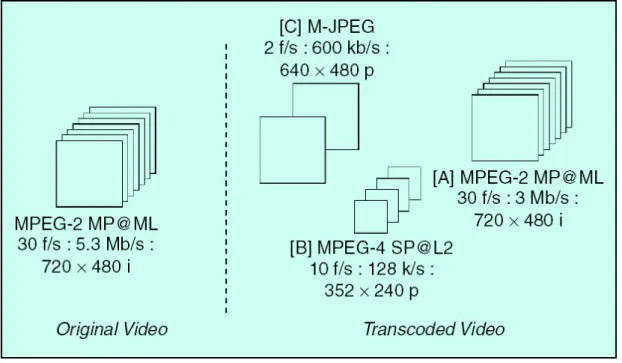
(17) while optimizing the performance of the video. Its objective is to maximize the quality of the adapted presentation while satisfying various constraints. There has been a vast amount of activity in research and standard development in this filed. Earlier works such as [3] and [4] explored some interesting aspects of adaptation like bandwidth reduction, format conversion, and modality replacement for Web browsing applications. As time moved on and mobile devices with limited display and processing power became reality, video adapting to achieve spatial resolution reduction and temporal resolution reduction has also been studied. Recently, international standards such as MPEG-7 [5], MPEG-21 [6], W3C, and TV-Anytime have developed related tools and protocols to support development and deployment of video adaptation applications. Despite the bourgeoning activities and advances, this field is in need of an analytical foundation. [7] presented a general framework that defines the fundamental entities and important concepts related to video adaptation. Furthermore, the authors indicate that most innovative and advanced open issues about video adaptation require joint consideration of adaptation with several other closely related issues, such as analysis of video content, understanding and modeling of users and environments. [8] provided an overview of the video transcoding and introduced some transcoding schemes, such as bit-rate reduction, spatial and temporal resolution reduction, and error resilient transcoding. Some of these common video adaptations are illustrated in Fig. 2-4. In [A] of Fig. 2-4, the transcoded video reduces the bit rate. Fig. 2-4 [B] shows that original video is converted to a MPEG-4 video with low frame rate and low spatial resolution. Transformation of original video to another format is demonstrated in Fig. 2-4 [C].. 7.
(18) Fig. 2-4. Illustration of common video transcoding operations.. 2.2.2 Video Compressed-Domain Features We choose to derive content features from compressed domain because our application scenario need to avoid expensive computation and time consumption involved in decoding and/or re-encoding. [9] provided a comprehensive and high-level review of audio-visual features that can be extracted from the standard compressed domains. Low-level features like color, brightness, edge, texture, and motion are usually extracted from the key frames for representing video content information. Color feature is usually used for representing the video content, such as color (YUV) histogram, DC YCbCr vector, and dominant color. Although color feature is efficient for video content representation, it may be indistinguishable while several shots of different kind of videos have the same color scheme. Moreover, it is highly susceptible to the global color variation caused by different encoding device or lighting changes.. 8.
(19) Brightness or intensity feature which is subset of color feature sometimes is used instead of color, especially human is more sensitive to the luminance rather than the chrominance. Generally speaking, brighter regions in a frame have more attraction for viewer. So, brightness feature plays an influential role in video analysis process. Edge or texture feature which can be extracted from AC coefficients is another noticeable characteristic often used for representing the video content, such as edge direction histogram described in MPEG-7, AC energy, and edge map. In compressed domain, the edge feature can just coarsely estimate the texture and derive rough edge direction and edge distribution. Motion vectors can be extracted easily from motion field of compressed domain, while much motion information, such as camera operation, object moving, and statistical information of motion vectors can be obtained by analyzing motion vectors. However, motion vectors are just a rough and sparse approximation to real optical flows, and are prone to be inaccurate when used to indicate real motion of macroblocks. [10] presented a visual attention model to simulate how viewers’ attention are attracted based on analyzing low level features of video content without fully semantic understanding of video content. Dynamic features such as motion intensity, motion spatial coherence, and motion temporal coherence as well as static features such as color contrast, intensity contrasts, and orientation contrasts are taken into account. Besides, the dominant face and camera motion are also utilized to analyze the degree of attention. Their proposed approach model the visual effects based on motion, static, face, and camera attention. Although their application scenario is used for video summarization, the proposed video attention model is useful in content-based video adaptation.. 9.
(20) 2.2.3 Content-based Video Adaptation Today's mobile and wireless users access multimedia content from different types of networks and terminals. Such user platforms often add peculiar constraints on media consumption — limited user time, low transmission bandwidth, low power, and low-resolution display. Furthermore, different tasks influence different user preferences, while different contents attract different degree of attention. Most traditional video communication systems consider videos as low-level bit streams, ignoring the underlying visual content information. Content analysis plays a critical role in developing effective solutions in meeting unique resource constraints and user preferences in such usage environments. Content analysis provides a promising direction for finding optimal adaptation methods under various resource-utility constraints. In the following, we will review the related works of video adaptation using content based information. [11] proposed a content-aware framework for video communication. The content-aware framework is based on the recognition of strong correlation among video content, required bandwidth resources, and the resulting video quality. The video content is analyzed in several feature domains including texture, motion, and size of object. Then, the content-based classifier is used to group video described by a set of content features into a finite number of categories. It is reasonable to assume videos belonging to the same class exhibit similar behaviors of resource constraints due to their similar features. Finally, the authors demonstrated advantages of the content-aware approaches in two applications. First, content-based bandwidth prediction was used for dynamic resource allocation. It is able to trace changes in visual content and therefore change bit allocation scheme while the discontinuities of visual content are detected. This is in contrast to traditional schemes that consider only bit rate and network buffer occupancy in their heuristic segmentation and resource prediction algorithms. Second, the content-aware framework was used for real-time generation of the utility function. They demonstrated a new system for speedup 10.
(21) of generation of utility function based on content-based classification technique that allowed estimation of utility in real-time. [12] presented brief overviews of such emerging, fruitful content-based video adaptation research area and indicated promising research directions. It is justifiable to assume that any given adaptation operation has similar effects on resource/utility regarding contents with similar characteristics. [12] showed that optimal tradeoffs of frame rate dropping and spatial quality reduction can be accurately predicted using computable video features (e.g., motion, spatio-frequency features) and statistical classification techniques. [13] also considered the tradeoff between spatial quality (image clarity) and temporal quality (motion smoothness) under a limited bandwidth to maximize user satisfaction in video streaming. They presented a visual perception model to predict viewer’s satisfaction given the perceived spatial quality and temporal quality measured by their introduced method. Based on this visual perception model, an adaptive video streaming system was proposed to maximize the visual quality of the delivered video stream which can automatically choose dropping frames (decrease temporal quality) or cutting the scalable bitstream (decrease spatial quality) when the bandwidth is insufficient for transmitting full quality and frame rate video stream. Fig. 2-5 shows 2 frames of the delivered video sequence by their proposed scheme. Fig. 2-5 (a) cuts FGS layer to decrease perceived spatial quality but keep full frame rate to maintain smooth motion due to the high motion of the interval. Fig. 2-5 (b) drops 2/3 frames and get the best perceived spatial quality due to the slight motion of the interval and all B frames can be dropped without introducing evident motion jitter.. 11.
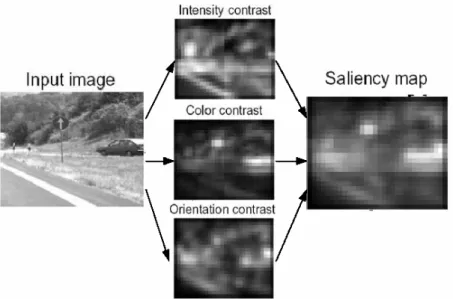
(22) (a). (b). Fig. 2-5. Simulation results utilizing perceptual video streaming by adaptive spatial-temporal scalability.. [14] proposed a content-based video streaming method based on visual attention model to efficiently utilize network bandwidth and achieve better subjective video quality. First, visual attention model is exploited to segment the Regions of Interest (ROI) in video frames. Features like motion, static, face, and camera motion are utilized to model the visual effects. In static attention model, a saliency map as shown in Fig. 2-6 is generated from each frame by the 3 channel saliency maps computation: color contrasts, intensity contrasts, and orientation contrasts. Motion attention model is built based on intensity, spatial coherence, and temporal coherence of motion vector field. Besides, face and camera motion are considered because the appearance of dominant faces in frames certainly attracts viewers' attention and camera motions are always utilized to emphasize or neglect certain objects. Then, considering the ROI is more sensitive to coding error than other regions, a region-weighted rate-distortion model is developed to allocate suitable bits for all ROI and non-ROI regions.. 12.
(23) Fig. 2-6. Static attention model generate Saliency Map.. 13.
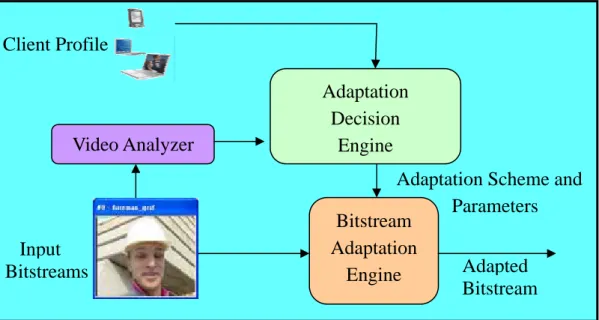
(24) Chapter 3 Content-Aware Video Adaptation in Low Bitrate Constraint In this chapter, we will present the design issues on content-aware video adaptation in low bitrate constraint. In Section 3.1, we introduce the overview of the proposed architecture and scheme. A novel video content analyzer is presented in Section 3.2 and a hybrid feature-based model for video content adaptation decision is illustrated in Section 3.3. Finally, Section 3.4 describes the bitstream adaptation approaches we proposed.. 3.1 Overview of the Proposed Scheme Fig. 3-1 shows the architecture of the proposed content-aware video adaptation scheme. Initially, video streams are processed by video analyzer to derive the content features of each frame/GOP and the important regions which have high degree of attraction. Subsequently, the adaptation decision engine determines the adaptation scheme and parameters according to the content information derived from video analyzer, device capability obtained from profile, correlational statistic model, and region weighted rate-distortion model. Finally, the bitstream adaptation engine adapts video based on the bit allocation scheme.. 14.
(25) Client Profile Adaptation Decision Engine. Video Analyzer. Adaptation Scheme and Parameters Bitstream Adaptation Adapted Engine Bitstream. Input Bitstreams. Fig. 3-1. The architecture of the proposed system.. 3.2 Video Analyzer In this section, we describe the first component of the proposed system. Video Analyzer is used to analyze features of video content for deriving meaningful information. Section 3.2.1 describes the data we use for Video Analyzer. In Section 3.2.2, we import the concept of Information Object to represent the content of video. Finally, we introduce the relation of selected features with visual perception effects in Section 3.2.3.. 3.2.1 Data Extraction A video bitstream contains a lot kinds of information that can be extracted from pixel or compressed domain. As described above, we consider only the features that can be derived from data in compressed domain since fast processing is required to suit the presented application scenario. Processing in the compressed domain reduces computation because frames do not need to be converted back to the uncompressed (pixel) domain. Here, we discuss the compressed-domain data extraction issues.. 15.
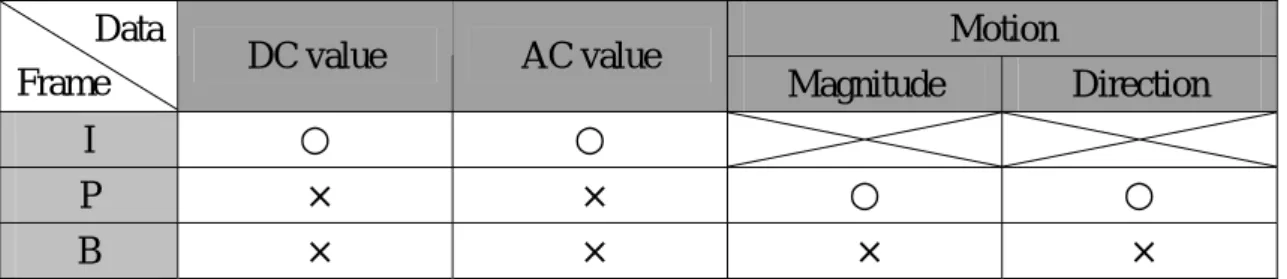
(26) In Section 2.1, we have already briefly described the overview of MPEG which is the international video compression standard. After compressing, the raw data are transformed from pixel domain to compressed domain. So, we can directly extract data in compressed domain including DC and AC values of I, P, and B frames, plus motion magnitude and direction of P and B frames. To reduce the computational complexity and maintain the adaptation scheme consistency, it is reasonable to neglect the analysis of the B frame. The DC and AC values of P or B frames are less meaningful because they are motion residuals. If we want to make them significant, they are needed to process motion compensation first. But it wastes too much time to do this process. Besides, the distance between I and P frames (i.e. number of B frame between I and P frame) usually is small while the video bitstream have strongly temporal coherence. Generally, the B frame content is similar to the adjacent P or I frame. Additionally, neglecting analysis of B frames also avoids the large change of adaptation decision during short period, which will cause jitter effect. In view of the above-mentioned reasons, we choose the DC and AC values of I frames plus motion magnitudes and motion directions of P frames as input data of our video analyzer. These input data can be easily extracted from compressed video sequences. Many features can be derived from these data, including brightness, color, edge, energy, motion, and so on. The relations of features with data will be described in the following section.. Table 3-1. The input data of video analyzer. Data Frame. DC value. AC value. I. ○. ○. P. ×. B. ×. Motion Magnitude. Direction. ×. ○. ○. ×. ×. ×. 16.
(27) 3.2.2 "Information Object" (IO) Derivation [15] presented a theoretical framework and a set of novel methods for maximizing information throughput for multimedia browsing on small displays. Although their methods mainly deal with adapting general multimedia content including images and web pages for browsing on small-resolution devices, these concepts can be extended and be employed in video adaptation. First, we will briefly describe the framework of [15] in the following. Later, the “Information Object” concept, which is a modification of [15], will be presented. Different parts of content have different importance values. Attention-based selection [15] allows only attention-getting parts be presented to the user without affecting much user experience. For example, human faces in a home photo are usually more important than the other parts. A piece of media content P usually consists of several information objects Bi. An information object is an information carrier that delivers the author’s intention and catches part of the user’s attention as a whole. For example, Information Object may be a picture, a flash, or a title sentence in different types of multimedia. Since each Information Object has different importance values, the property IMP is introduced as a quantified value of the weight of each object in contribution to the whole information. Besides IMP indicator, the minimal perceptible size (MPS) denotes the minimal allowable spatial area of an information object. The alternative (ALT) is a substitute of the original content. However, not all of the aforementioned approaches and features are suitable for video adaptation, we will present a modified model which utilizes the “Information Object” concept.. 17.
(28) Our proposed Information Object model for video content is defined as below. Definition 1: The basic content representation model for a video shot S is defined as a set which has three relative hierarchical levels of Information Objects: S = {H i }. 1≤ i ≤ 3. (1). and. H i = {B j } 1 ≤ j ≤ N. (2). B j = (IMPj , CON j ). (3). and. where Hi,. is the perception of object, frame, or GOP level of S, respectively. Bj,. is the jth information object in Hi of S. IMPj, is the importance value of Bj and CONj, describes the members the Information Object contained. Fig. 3-2 is a content representation model example consisted of some Information Objects. The Information Objects generated by content analyzer are basic units of video adaptation.. : Frame based IO : non-Frame based IO. (a). 18.
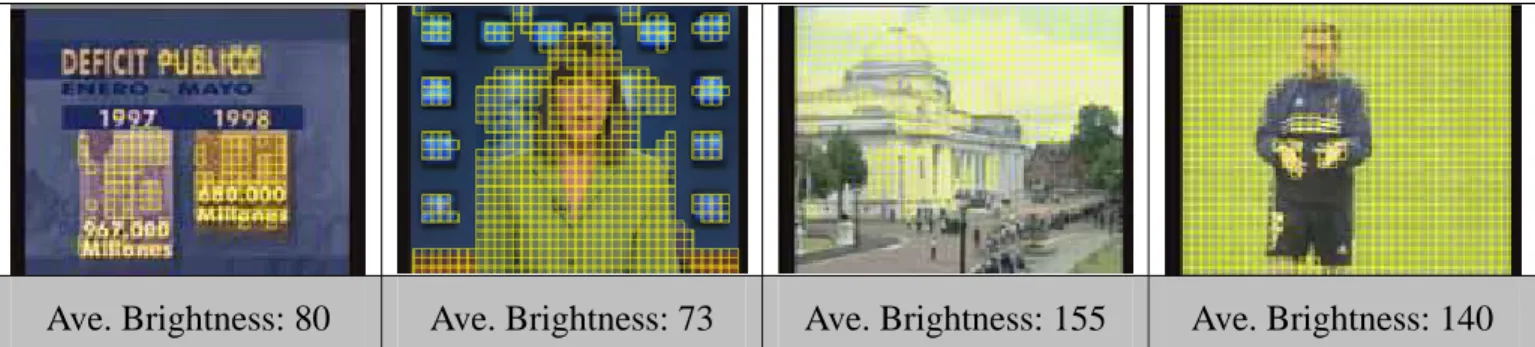
(29) (b) Fig. 3-2. An example of the content representation model.. (a) frame based IO (b) object based IO. 3.2.3 Feature Selection for Visual Effect Visual effect is considered in four feature domains — brightness, spatial location, motion, and energy. For each feature, we briefly discuss the extraction methods (i.e. the relationship with data extraction), visual perceptive effect, and possible limitation caused by certain video content. Some features may be meaningless for some kinds of videos, such as motion feature for rather smooth scenes or no motion videos.. Brightness:. Generally speaking, the human perception is always attracted by the brighter part, which is referred to as brightness attraction property. For example, the brightly colored, or strongly brightness contrasted parts of a video frame, even in the background, always have high attraction. So, the brightness characteristic is an important feature to identify the Information Objects. Here, we use the DC value of the luminance of I frame to derive the block brightness. Some results of Information Objects derived in view of brightness are illustrated in Fig. 3-3. We can discover the brightness attraction property may lose its reliability when the overall frame/scene has higher brightness. Moreover, in some special cases, the region with large brightness value does not cause human attention, such as the 19.
(30) scene has the white wall background, the cloudy sky, the vivid grasslands, and so on. Integrating the preceding analysis with an observation in Fig. 3-4: even the same bit rate are assigned, the visual distortion of the dark regions is more unobvious. Consequently, our brightness attention model containing mean of brightness, variance of brightness, and location based brightness histogram will be presented in the following.. Ave. Brightness: 80. Ave. Brightness: 73. Ave. Brightness: 155. Ave. Brightness: 140. Fig. 3-3. Utilizing brightness to derive IO. We can discover the higher brightness. average is, the more unreliable the derivation result is.. (a). (b). Fig. 3-4. Perceptual distortion comparison between different brightness.. The visual distortion of brighter regions is more obvious than darker regions. (a) An adapted frame using uniform quantization parameter, (b) Original frame.. 20.
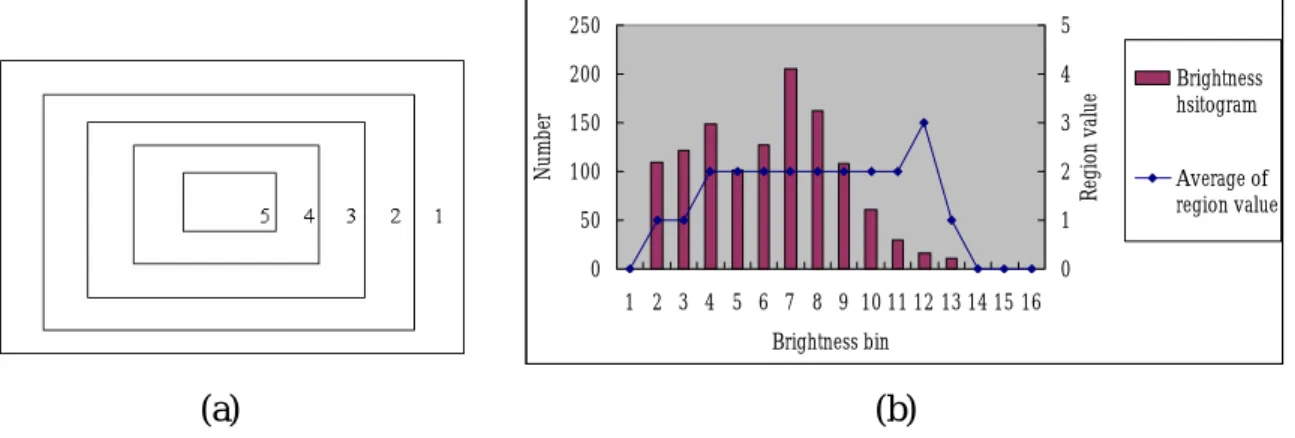
(31) According to our basic assumption, we define the brightness attention B as following: B=. DCvalue × B _ var , B _ level. (4). where DCvalue is the DC value of luminance, B_level is obtained from the average luminance of the previous calculated frame, and B_var denotes the DC value variance of current and surrounding eight blocks. Besides, in order to improve the brightness attention model in response to attraction, we design a location based brightness histogram which utilizes the correlation between brightness and distribution to identify the important brightness bin and roughly discriminate foreground from background. The module calculates mainly distribution of each brightness bin to decide whether the degree of brightness is attractive. For instance, the same brightness distributed over center regions or peripheral regions will cause different degree of attention, even if they both are quite bright. We will apply the average region value of the brightness bin to adjust the B obtained from Eq. (4) when the proportion of the brightness bin is greater than certain degree. The function of adjustment is as follows: ⎧0 ⎪B − 1 ⎪⎪ B' = ⎨B ⎪B + 1 ⎪ ⎪⎩5. if lbbh( B) ≤ 1 if 2 ≤ lbbh( B ) < 1 if 3 ≤ lbbh( B) < 2. (5). if 4 ≤ lbbh( B) < 3 if lbbh( B) > 4. where B’ is the adjusted brightness attention value using location based brightness histogram model, and the lbbh() function denotes the average region value of the brightness bin. In Fig. 3-6, we can evidently discover that the results of the location based brightness histogram have large refinement against pure brightness attention model.. 21.
(32) 5. 200. 4. 150. 3. 100. 2. 50. 1. 0. Region value. Number. 250. Brightness hsitogram. Average of region value. 0 1 2 3 4 5 6 7 8 9 10 11 12 13 14 15 16 Brightness bin. (a). (b). Fig. 3-5. Location based brightness histogram.. (a) The centricity region used to estimate the distribution of brightness bin. (b) An example of location based brightness histogram.. Ave. Brightness: 140. Ave. Brightness: 155. Ave. Brightness: 109. Ave. Brightness: 74. Fig. 3-6. Comparison between the IO derived from brightness without (first row). and with combining the location based brightness histogram (second row).. 22.
(33) Location:. Human usually pay more attention to the region near the center of a frame, referred to as location attraction property. On the other hand, the cameramen always operate the camera to focus on the main object, i.e. put the primary object on the center of the camera view, in the technique of photography. So, the closer to the center the object is, the more important the object is. Even the same objects may have different important values due to their location of appearance. To get better subjective perceptual quality, the frames can be generated adaptively by emphasizing the regions near the important location and deemphasizing the rest regions. The location related information can be generated automatically according to the centricity. We introduce a weighting map in accordance with centricity to reflect the location characteristic. Fig. 3-7 illustrates the weighting map and the adapted result based on the location factor. But, for different type videos, the centricity of attraction may be different. A dynamic adjustment of location weighting map will be introduced in Section 3.3.3 according to the statistic information of IO distribution.. Fig. 3-7. Location weighting map and adapted video according to the location feature.. Motion:. After extensive observation of a variety of video shots, the relation between the camera operation and the object behavior in a scene can be classified into four classes. The first class, the camera is fixed and all the objects in the scene are static, such as 23.
(34) partial shots of documentary or commercial scenes. The percentage of this type of shots is about 10~15%. The second class is fixed camera and some objects moving in the scene, like anchor person shots in the news, interview shots in the movie, and surveillance video. This type of shots is about 20~30%. The third class, the camera move while no change in the scene, is about 30~40%. For instance, some shots of scenery scene belong to this type. The fourth class, the camera is moving while some objects move in the scene, such as object tracking shots. The proportion of this class is also about 30~40%. Because the meaning and the importance degree of the motion vector feature are dissimilar in the four classes, it is beneficial to first determine what class a shot belongs to while we derive Information Objects. We can utilize the different representations in the motion vector field to distinguish the target video shot into applicable class. In the first class, all motion vectors are almost zero motions because the adjacent frames are almost the same. In the second class, there are partial zero motions due to the fixed camera and partial similar motion patterns attributed to moving objects, so that the average and the variance of motion magnitude are small and the zero motion have a certain degree proportion. In the third class, all motions have similar motion patterns when the camera moves along the XY-plane or Z-axis, while the magnitudes of motions may have larger variance in other camera motion cases. However, the major direction of motion vectors has a rather large proportion in this class. In the fourth class, the overall motions may have large variation while some regions belonging to the same object have similar motion patterns. According to the above discussions, we use the mean of motion magnitude, the variance of motion magnitude, the proportion of zero motion, and the histogram of motion direction to determine the video type, as shown in Table 3-2.. 24.
(35) Table 3-2. The video types are classified according to motion vector.. Motion magnitude Class Camera 1. Fixed. 2. Fixed. 3. Moving. 4. Moving. Object. Mean. Variance. Static. near 0. quite small. Moving smaller Smaller Static. larger. Moving larger. Zero motion. Maximum motion. (%). direction proportion. near 100% middle. middle/larger. small. quite large. Larger. small. Smaller. People usually pay more attention to the large motion objects or objects which have different motion activity from others, referred to as motion attraction property. Besides, motion feature has different importance degree and meaning according to their motion class. So, our motion attention model will depend on the above-mentioned motion class and is illustrated as the following. In Motion Class 1 and 2: Mattention =. magnitude × MA α −β. when α ≥ magnitude ≥ β ,. (6). when α ≥ magnitude ≥ β ,. (7). In Motion Class 3 and 4: Mattention =. magnitude × (1 − 0.5 − MA ) α −β. where Mattention is the motion attention value, magnitude denotes motion magnitude, MA represents the bin proportion of the motion angle histogram for each block, and α,β are two thresholds for noise elimination and normalization.. Energy:. Another influence on perceptual attention is the texture complexity, i.e. the distribution of edges. Fig. 3-8 is an example of the edge extracted from a video frame. People usually pay more attention to the objects which have greater or less magnitude of 25.
(36) edge than average [16], referred to as energy attraction property. For example, the object with complicated texture in smooth scene is more attractive, and vice versa. Most edge detection methods work on the assumption that there is a very steep gradient in the image. By using a weighted mask accordingly, it is possible to detect edges in the pixel domain.. (a). (b). Fig. 3-8. An example of edge field. (a) Original frame, (b) Edge field.. Although our approach considers issues in the compressed domain, it is reasonable to extract edges using the AC coefficients in DCT transformed domain. We use the predefined two edge features [19] to derive edges. The two horizontal and vertical edge features can be formed by two-dimensional DCT of a block. As shown in Fig. 3-9, the two edge feature sets [20] can be used to represent the edges in an 8x8 block. Horizontal Feature : H = { H i : i = 1,2,...,7}. Vertical Feature : V = {V j : j = 1,2,...,7}. (8). in which H i and V j correspond to the DCT coefficients Fu , 0 and F0,v for u, v = 1, 2, …, 7. Eq. (9) describes the AC coefficients of DCT: Fu ,v =. 2 MN. M −1 N −1. ∑∑ x i =0 j =0. i, j. cos. (2i + 1)uπ cos (2 j + 1)vπ 2M. 2N. ,. where u = 1, 2, …, M-1, and v = 1, 2, …, N-1. Here M = N = 8 for an 8x8 block.. 26. (9).
(37) Vertical feature DC. V1. V2. V3. V4. V5. V6. V7. H1 H2 H3. Horizontal feature. H4 H5 H6 H7. Fig. 3-9. Horizontal and vertical edge features of DCT coefficients in an 8x8 block.. In the DCT domain, the edge pattern of a block can be characterized with only one edge component, which is represented by projecting components in the vertical and horizontal directions, respectively. The edge features from the DCT basis images is shown in Fig. 3-10.. Fig. 3-10. The 64 (8 x 8) DCT basis images.. 27.
(38) The gradient energy of each block is computed as: E = H 2 +V 2. (10a). 7. 7. i =1. j =1. H = ∑ Hi , V = ∑ Vj. (10b). where Hi is the horizontal feature and Vj is the vertical edge feature. The gradient energy of I frame is then obtained which is represented as the edge energy feature.. However, as our observation, the influence of perceptual distortion in parts with large edge energy or small edge energy is little, as shown in Fig. 3-11. Although we have explained that objects which have greater or less magnitude of edge than average attract more human attention. On the contrary, the visual perceptual distortion introduced by quantization is small in extremely high or low energy cases. Accordingly, our energy model combined the above two aspects is illustrated as below.. (a). (b). Fig. 3-11. Comparison of the visual distortion in different edge energy regions.. (a) The original frame. (b) The uniform quantization adapted frame. We can discover high energy regions like tree have less visual distortion than other regions like walking person in (b).. 28.
(39) We introduce four thresholds which are derived from the mean and variance of energy of the previous calculated frame. According to the energy E obtained from Eq. (10a), assign each block the energy attention value, as shown in Fig. 3-12. When the energy E is near the energy mean of the frame, we assign the block medium energy attention value. When the block energy belongs to higher or lower regions, we assign the block high energy attention value. In extreme energy case, we assign such blocks the lowest energy attention value because their visual distortion is unobvious. Low energy. 0. 2. High energy. 1. 2. 0. Fig. 3-12. The energy attention model.. 3.3 Adaptation Decision In this section, we describe the second component of the proposed system. Adaptation Decision Engine is used to determine video adaptation scheme and adaptation parameters for subsequent Bitstream Adaptation Engine to obtain better visual quality. We describe adaptation approaches according to the video content in Section 3.3.1, while we present device capability-related adaptation in Section 3.3.2. In Section 3.3.3, we propose the concept of correlational statistic model to improve the content aware video adaptation system. Finally, we introduce the decision principle for video adaptation in Section 3.3.4.. 29.
(40) 3.3.1 Content Our content-related adaptation decision is based on the discussion in the Section 3.2. We utilize brightness, location, motion, and energy features to derive the Information Object of video content. A lot of factors affect human perception. We adopt integration model to aggregate attention values from each feature, instead of intersection model. One object gaining quite high scores in one feature may attract viewers while another object gaining medium high scores in several features may also attract viewers. For example, a quite high-speed car appeared in the scene will attract viewers’ attention, while a brightly, slowly walking person appearing in the center of the screen also attract people. In addition, due to large diverseness in all kinds of video content, it is impossible to use the same formula to determine the content-related adaptation decision. We utilize the feature characteristic to roughly discriminate content into several classes, and thus a more suitable weighted principle is applied to each class, as described in Section 3.3.4.. 3.3.2 Device Capability In order to reduce the unnecessary waste and increase the utilization of resource, it is needed to consider the device capability in adapting video. Especially, as a great amount of new devices with diverse capabilities are making a popular boom; their limited resolution size, available bandwidth, weaker display support, and relatively powerless computation are still obstacles to streaming video against traditional environments. Without appropriately adapting video, the resource can not be efficiently utilized and the received visual quality may be quite poor. Fig. 3-13 is an example of such delivery scenario and shows that the role of video adaptation is important and challenging. In our video adaptation scheme related to client device capability, we consider the spatial resolution, color depth, brightness, and computation of the received device. In the following, we will describe the adjusting methods according to different aspects. 30.
(41) Media Server. Various Network Channels Diversity of Devices. Fig. 3-13. Deliver media content through various network channels matching the. diversity of devices.. Spatial resolution. In the recent years, there are more and more various computing devices which have enough power and storage to display video. However, in such hand-held devices, there is one common characteristic or shortcoming: small resolution. If we transmit a higher resolution video, like 320x240, to a lower resolution device, like 240x180, it is easy to understand that much unnecessary resource is wasted with quite little quality gain or just the same quality. Besides, [17] represented that picture resolutions of video streams need not be equal to the screen resolutions of multimedia devices. When the device resolution is larger than the video resolution, the device can easily zoom the pictures by interpolation. Under the same bitrate constraint, on the one hand higher resolution video streams certainly need to use larger quantization parameter, and on the other smaller resolution video streams naturally can use smaller quantization parameter. Actually, it is a tradeoff between picture resolution and quantization precision. [17] concluded that appropriately lower picture resolution combined with decent interpolation algorithms can achieve higher subjective quality in a given bitrate constraint. However, their proposed 31.
(42) tradeoff principle used to determine the appropriate picture resolution is heuristic and computation-intensive, which requires pre-encoding attempt. Consider our research scenario, some experiments related to determine appropriate resolution will be described in the Chapter 4. According to experimental analysis, we present the conclusion as following. If we can find a resolution that the distortion introduced by down-sampling, encoding quantization, and then decreased by interpolation is smaller than the distortion of original resolution by encoding quantization in the same bit rate constraint, as Fig. 3-14 illustrated, the ideas which utilize the down-sampling approach is beneficial to obtain better visual quality.. (a). (b). Fig. 3-14. The above yellow process (a) is the resolution-considered adaptation.. The below blue process (b) is the original encoding process. The q2 of process (b) is much larger than q1 of process (a) due to the same bit rate constraint.. 32.
(43) Color depth. The reason for considering the color depth of the device capability is similar to the spatial resolution. Some hand-held devices may not support full color depth, i.e. eight bits for each component of color space. To avoid unnecessary resource waste, we may utilize the color depth information of the device in video adaptation. For example, avoid wasting resource to transmit video streams with 24 color depths to the device with only 16 color depths. The effect of reducing the color depth is similar to the quantization. Therefore, it is not necessary to consider reducing color depth further than client capability. Naturally, the rate controller will choose higher quantization when the bit rate is insufficient.. Brightness. Because the variation of extreme of the brightness is not sensitive to visual perception and some restrictions are inherent in hand-held device display screens, such as low brightness contrast, it is reasonable to remove the extreme value without influencing viewers’ experience. Although the improvement in the utilization of resource based on extreme brightness remove property is pretty limited, the entropy of encoding is reduced without perceived distortion.. Computation. Due to the weak computation capability of mobile devices, there may be not enough time to decode and display video at the frame rate used in the encoder. Appropriately reducing the transmitted frame rate can not only avoid the asynchronous problem but also exploit the saving bit rate in spatial quality. Another advantage is to extend the power consuming time of hand-held devices. In opposition to general computer, mobile devices have a significant difference, i.e. their power source is limited. If we lower the requirement of the computation, like reducing 33.
(44) the temporal quality, certainly the power consumption rate will also slow down. This is quite beneficial for mobile device.. 3.3.3 Correlational Statistic Model We consider the correlational statistic model due to the high correlation between adjacent frames. The location which has higher importance value in the preceding frames will have higher probability of being Information Object. Similarly, the frame which preceding frames have higher importance value will have higher probability of being Information Object. So, we analyze the interdependence of Information Objects in spatial and temporal domain. From the experimental result of Information Object derived from above-mentioned Video Analyzer shown in Fig. 3-15, our opinion can be proven explicitly. Based on the above observation, we can predict Information Object utilizing the temporal information when the motions of a shot are small, for reducing computation.. Correlation. 100.00%. 100.00%. 80.00%. 80.00%. 60.00%. Correlation. Correlation. Correlation. c41. 40.00% 20.00%. 60.00%. c41. 40.00% 20.00% 0.00%. 0.00% 1. 2. 3. 1. 4. 2. 3. 4. Frame Number. Frame Number. (a). (b). Fig. 3-15. (a) Information Object correlation of adjacent frames in the GOP. (b) Information Object correlation of adjacent GOPs.. 34.
(45) Furthermore, the correlational statistic model is also used in other aspects, such as statistic of each feature value of content, IO distribution, IO density, and Motion Class to determine the weight of each content feature and to adjust adaptation decision principle. The statistic of each feature value of content, like mean, variance, histogram, and so on, used in Video Analyzer have been described in Section 3.2. The statistic of Motion Class used in Video Analyzer also has been introduced in Section 3.2 and decision of adaptation principle will be presented in Section 3.3.4. In the following, we will describe the purpose of the statistic of Information Object. Observing the dispersedness of Information Objects in a frame, we can discover large variation in distinct videos. For instance, the density and centricity of Information Object in Fig. 3-16 (a) and (b) are eminently different. We import the centricity region of Fig. 3-5 (a) to calculate the percentage of Information Object in each region, as Fig. 3-17 shown. Therefore, we will dynamically adjust the weighting map of the location feature, which has five candidates as Fig. 3-18 (a) shown, according to the statistic of the IO density. When the IO is centralized, the candidate (5) is used. On the contrary, the candidate (1) is used.. (a). (b). Fig. 3-16. The IO regions are marked as yellow masks in distinct videos.. (a) video c41 (b) video c162. 35.
(46) Fig. 3-17. The relation between densities of IO and centricity regions as shown in Fig. 3-5. (a). Six testing sequences are observed, including c9 (anchor person), c162 (full court football), c171 (close-up football), c41 (dense objects), c130 (large object), and speedway.. (1). (4). (2). (5). (3). (a). (b). Fig. 3-18. (a) The candidates of location weighting map (b) the suitable one for each video.. 3.3.4 Decision Principle As our preceding description, we take two aspects into consideration to adapt video, content information and client device capability. For the first aspect, we adopt content features that have explicit visual effect to attract viewer attention, including brightness, color, location, motion, and edge energy, to determine Information Object. For the second aspect, we consider the spatial resolution, color depth, brightness, and computation 36.
(47) capability of client device to influence on the resource utilization and video perception quality. The motion class described in Section 3.2.3 is useful not only for deriving the Information Object by motion feature but also for determining the adaptation scheme. Due to vast variety in video content, the decision principle for adaptation scheme must be adjustable according to the content information. For example, it is impossible to use the same principle for adapting in no motion video and high motion video. In our opinions, the Motion Class is a good classification to determine the weight of each feature in the Information Object derivation process. Table 3-3 shows the detail of the selected features in each Motion Class. In the first class, due to the motions are almost zero motions and meaningless, we do not need to consider the motion factor. In the second class, the motion is the dominant feature because the moving objects are especially attractive in this class. Although, in the third class the features we considered, i.e. brightness, location, and energy while motion ignored, are the same as the first class, the adaptation schemes are entirely different. In the first class, the frame rate can be reduced considerably without introducing the motion jitter. Nevertheless, whether the frame rate can be reduced in the third class it depends on the speed of the camera motion.. Table 3-3. The importance of feature in different video classes.. Class. Camera. Object. Brightness. Location. 1. Fixed. Static. ◎. ◎. 2. Fixed. Moving. 3. Moving. Static. ◎. ◎. 4. Moving. Moving. ◎. ◎. Motion. Energy ◎. ◎. 37. ◎ ◎. ◎.
(48) Besides, as the above description in Section 3.2.2, the Information Objects are derived from three relative hierarchical levels, object level, frame level, and GOP level, respectively. In object level, the adaptation is based on the IMP of each block to adjust individually. In frame level, the whole frame adjustment utilizes the aggregation of the IMP in a frame to judge the importance of the frame [17]. Finally, the wide concept is used to adjust in GOP level which aggregate the IMP of frames to obtain the importance value of GOP. The detailed bit allocation schemes of the three levels will be described in Section 3.4.2.. 3.4 Bitstream Adaptation In this section, we describe the third component of the proposed system. Bitstream Adaptation Engine is used to control the bit rate and adapts the bitstream based on Video Analyzer and Adaptation Decision Engine. In Section 3.4.1, we introduce the concept of Region Weighted Rate-Distortion Model used to execute rate control. Subsequently, we present bit allocation scheme of our content aware adaptation in Section 3.4.2.. 3.4.1 Region Weighted Rate-Distortion Model Rate control is a fundamental technique in the coding process, which is based on the rate distortion theory. Based on the fact that regions with different attention level have different sensitivity to coding error, [14] proposed a video region-weighted rate-distortion (R-D) function: Di ( Ri ) = wi *σ i2 * e −γRi ,. (11). where Di denotes the mean square value of the error of Regions-of-Interesti (ROIi) between decoded video frame and original video frame, wi denotes the weight coefficient 38.
(49) of ROIi, which is determined by the attention level Ai of ROIi, γ is a constant number,. σ i2 is the variance of the encoding signal, and Ri is the bit rate (bits/pixel) used to encode the ROIi. Here, the background region excluding all the ROIs is considered as a least ROI region. Since the constraint of total bandwidth is the same, so the sum of all regions (1, 2,…, N) bit rate is a constant: S1 ⋅ R1 + S 2 ⋅ R2 + K + S N ⋅ RN = R, S. (12). where Si denotes the area size of ROIi, S is the whole frame size, and R denotes the total bit rate for the whole frame. The essence of the problem of rate allocation is a global optimization issue and can be described by the following equation: S S1 D1 ( R1 ) + L + N DN ( RN ) S S , N Si −γRi 2 = ∑ ⋅ wi ⋅ σ i ⋅ e i =1 S. D( R1 , R2 ,K, RN ) =. (13). where D( R1 , R2 ,K, RN ) denotes the total degree of distortion of the whole frame. In order to minimize the total distortion D( R1 , R2 ,K, RN ) , Lagrange multiplier method is applied to solver it, and derives the following function: g ( R1 , R2 ,K, RN ) = D( R1 , R2 ,K, RN ) − λ ( R −. S1 ⋅ R1 + S 2 ⋅ R2 + K + S N ⋅ RN ) S. (14). Then, to make g ( R1 , R2 ,K, RN ) get its minimum value, assign the differential to be zero as the following: dg dg dg dg = =L= = =0 dR1 dR2 dRN dλ. (15). Solve Eq. (15) to get: Ri = R +. w σ 2 1 S j ⋅ log i + S j ⋅ log i (i = 1,2,K, N ) ∑ ∑ wj γNS j ≠i σ j γNS j ≠i. (16). Assume the variance of the encoding signal in one frame is equal at all spatial. 39.
(50) regions: σ i = σ j . The result can be simplified to: Ri = R +. w 1 S j ⋅ log i (i = 1,2,K, N ) ∑ wj γNS j ≠i. (17). By the theory of acoustics, the human’s perception of sound, sonority S, is a logarithmic form of the energy of sound E. The same discipline is for light. The attention level of ROIi, Ai, represents the human’s visual perception. The weight coefficient wi represents the weight of luminance (energy of light), so Ai is a logarithmic form of wi, while wi is an exponential form of Ai. Assume wi has an exponential form as: Ai k. wi = C ⋅ e ,. (18). where Ai is attention value of ROIi , k and C are constants. The ROIs are encoded by different quantization parameter QPi, to meet the target bit rate Ri, according to the R-Q model [18]: R = α − β log QP ⇒ QPi = e. α − Ri β. (19). where, αandβare parameters, αaccounts for overhead bits. Based on the analysis of the region weighted RD model, we can obtain the appropriate bit rates and quantization parameters of each attention level region for content aware bitstream adaptation.. 3.4.2 Bit Allocation Scheme Based on the attention analysis results, we establish a content-aware video adaptation model. When the bandwidth is insufficient for the transmission of original full quality video stream, the adaptation system must have an efficient scheme to modulate video according to certain principle, such as high resource utilization, better temporal quality, better spatial quality, and/or low computation complexity. In our allocation scheme, we. 40.
(51) consider two major principles: improve visual perceptual quality and avoid unnecessary resource waste. For the first principle, we shift the bit rate from the non-attention regions to the attention regions, which are discriminated by Video Analyzer. In order to consolidate the effect of adaptation, our bit allocation scheme is also divided into three relative hierarchical levels, i.e. object, frame, and GOP levels as the adaptation decision principle. In the following we will describe the GOP, frame, and object level bit allocation scheme, respectively. In GOP level, we consider the GOP based Importance Value, average motion mean, and average motion variance to determine adapted scheme. For example, when the motion of video is slight, more frames can be dropped without producing motion jitter and keeping acceptable temporal quality. Besides, when the GOP based Importance Value is small, the same approach will be used to shift resource to more significant parts. There are three schemes as the following. (1) Full frame rate. No frames are dropped to maintain full temporal quality. (2) 1/3 frame rate. Suppose the GOP structure of compressed video stream is “IBBPBBPBBPBBPBB”. All the B frames are dropped, and all the saving bitrate is assigned to I/P frames. (3) Skip all frame except I frame. It is used in very motionless video.. In frame level, we utilize variable frame type to dynamically adjust I, P, and B frames. In traditional video coding, the frame structure of the GOP and frame type are predetermined before the actual encoding process, so they have nothing to do with video contents. If we change such parameters based on video content analysis, i.e. dynamic frame type adjustment as shown in Fig. 3-19, we can expect higher coding efficiency and higher quality [17]. 41.
(52) Fig. 3-19. Frame based dynamic bit allocation scheme.. In object level, we utilize the above-mentioned region-weighted RD model to adjust the quantization parameters in different attention Information Object regions. The bit allocation in object level must base on the GOP level determination. The R in Eq. (12) is varied with the GOP level adaptation scheme determination. For the second principle, we consider the capability of client device in order to avoid transmitting the redundant or useless data. For example, the mobile device is weaker in spatial resolution, color depth, computation power, and so forth. According to the profile of the client device to adapt the video to be transmitted as described in Section 3.3.2, the utilization of the resource is more effective.. 42.
(53) Chapter 4 Experimental Results and Discussion The proposed approach of content-aware video adaptation is applied to various kinds of videos. The contents of testing video sequences mainly include news, interview, walking person, soccer, baseball, tennis, and scenery. We present the experimental results, including Information Object masks region of content analysis, influence of device capability, Motion Class, bit allocation scheme, and visual perceptual quality as following.. IO mask region (content analysis). First, we experiment on the performance of Information Object derived from Video Analyzer. The Fig. 4-1 is our graphical user interface of Video Analyzer. In the process of modeling the Video Analyzer, we control the (a) part of the Fig. 4-1 to observe the influence of each content feature. The setting button of the top of the Fig. 4-1 is used to set the analysis feature and the device profile. After the modeling process, the Video Analyzer will automatically derive Information Object without user setting involving, including the parameter of each feature, feature weight, and so on. The image shown in center of the Fig. 4-1 is the result of Information Object which marked as yellow mask in Video Analyzer.. 43.
(54) Set device profile. Display result. (a) Feature parameter control area. Message area. (b) Analysis and display controller. Fig. 4-1. Interface of Video Analyzer.. Many previous researches about Video Analyzer major suit to one or two class videos, such as static background video analysis, like surveillance video analysis, and restricted domain video analysis, like tennis video analysis. Our Video Analyzer is more general for content type of videos. The four types of Motion Class as we described above are used to verify the accuracy of our Video Analyzer. Some experimental results of Video Analyzer are demonstrated in Fig. 4-2.. 44.
(55) (a) c84.mpg. (b) c41.mpg. (c) c15.mpg. (d) c9.mpg. (e) c130.mpg. (f) c207.mpg. 45.
(56) (g) c24.mpg. (h) c5.mpg. (i) c1.mpg. (j) 104.mpg. (k) 162.mpg. (l) d17.mpg. Fig. 4-2. Information Object results of Video Analyzer.. (a) belongs to the Motion Class 1, fixed camera and static object. (b)-(e) are Motion Class 2, fixed camera and moving objects. (f)-(g) are Motion Class 3, moving camera and static scene. (h)-(l) are Motion Class 4, moving camera and moving objects, i.e. object tracking.. 46.
(57) In order to further improve the Video Analyzer, we proposed the Correlational statistic model in Section 3.3.3. Based on this model, the information of the foregoing frames will be utilized in the later analysis. Accordingly, we can obtain better performance in later frames, as Fig. 4-3 illustrated.. (a) c15.mpg. (b) c130.mpg. (c) c5.mpg. (d) c104.mpg. Fig. 4-3. Information Object results of Video Analyzer in later frames. We can. compare with Fig. 4-2 to discover the efficiency of Correlational statistic model.. 47.
(58) Influence of device capability. In the influence of device capability, we discuss the tradeoff between the appropriate picture resolution with quantization precision. In our simulation, the original video resolution is 320x240, and the device resolution is 240x180. We observe the quality of the different resolutions and different bitrates under the same constraint. Due to the dissimilar behavior in different bitrate environments, the bandwidth constraint of our experiments vary from high to very low, i.e. 1152 kbps to 52 kbps. The resolution we considered is varied from original (320x240) to quarter (80x60). The Fig. 4-4 shows the visual result of experiments.. Fig. 4-4. Comparison of visual quality. The resolution is equal in the same column and. decreasing in x-axis. The bandwidth is equal in the same row and increasing in y-axis.. 48.
(59) For objective quality, we use the PSNR and MPSNR to compare the distortion in different bitrate constraints, as illustrated in Fig. 4-5. Owing to PSNR the same resolution considered, we modify the definition to reasonably show the objective quality by linear interpolation before imitating the PSNR, which we refer to as MPSNR.. Fig. 4-5. The PSNR and MPSNR in different bitrate constraints. The x-axis is the. percentage of original video resolution.. 49.
數據
+7

相關文件
Specifically, in Section 3, we present a smoothing function of the generalized FB function, and studied some of its favorable properties, including the Jacobian consistency property;
Specifically, in Section 3, we present a smoothing function of the generalized FB function, and studied some of its favorable properties, including the Jacobian consis- tency
批判性思考 + 創造力 創造力示例二 創造力 創造力 示例二 示例二: 示例二 : :環境調查 : 環境調查 環境調查 環境調查..
Create and present information and ideas for the purpose of sharing and exchanging by using information from different sources, in view of the needs of the audience.
Create and present information and ideas for the purpose of sharing and exchanging by using information from different sources, in view of the needs of the audience.
The school practises small class teaching with the number of school places for allocation being basically 25 students per class. Subject to the actual need at the Central
In addition, based on the information available, to meet the demand for school places in Central Allocation of POA 2022, the provisional number of students allocated to each class
Secondly, the key frame and several visual features (soil and grass color percentage, object number, motion vector, skin detection, player’s location) for each shot are extracted and
