國立交通大學
資訊科學與工程研究所
碩 士 論 文
利用群聚法分析網路記錄
Network Security Management with Traffic Pattern
Clustering
研 究 生:邱韜瑋
指導教授:蔡錫鈞 教授
利用群聚法分析網路記錄
Network Security Management with Traffic
Pattern Clustering
研 究 生:邱韜瑋
Student : Tao-Wei Chiou
指導教授:蔡錫鈞
Advisor : Shi-Chun Tsai
國立交通大學
資訊科學與工程研究所
碩士論文
A Thesis
Submitted to Institute of Computer Science and Engineering College of Computer Science
National Chiao Tung University in partial Fulfillment of the Requirements
for the Degree of Master
in
Computer Science and Engineering November 2013
Hsinchu, Taiwan, Republic of China
摘
要
本篇論文藉由觀察網路用戶的連線行為,結合殭屍網路的連線特徵尋找校園網路內潛 在中電腦病毒的受害機器以及由Domain Generating Algorithm(DGA)產生的惡意網域, 我們針對無法連接的網域(NXdomains)提出了一個分辨一般網域以及由DGA產生惡意網 域的特徵叫做Popular 2gram(兩個連續的英文單字),並且透過群聚法以及分類法找 到受害的機器以及惡意的網域。我們另外觀察受害機器的連線目標並且計算每一個受 害機器的連線相似程度去法絕這些機器在一起行動時的行為模式。為了加快分析的時 間,我們使用Hadoop的技術去分析大量的網路紀錄。本論文提出的方法可以提供中毒 機器的連線行為模式,惡意的網域以及IP的資訊給網路管理人員,使網路管理人員能 做出相應的措施此殭屍網路所造成的傷害降低。 關鍵詞:殭屍網路、動態網域產生演算法、群聚法、機器學習、分散式阻斷攻擊、海量 資料、網域名稱系統。
Abstract
Profiling network traffic pattern is an important approach for tackling net-work security problem. Based on campus network infrastructure, we propose a new method based on connection behavior of botnet to identify randomly generated malicious domain names and pinpoint the potential victim groups. We characterize normal domain names with the so called popular 2gram (2 con-secutive characters in a word) to distinguish between active and nonexistent domain names and classify the clients as victims or not with the spectral clustering method. We also track the destination IPs of sources IPs and analyze their similarity of connection pattern to uncover potential anomalous group network behaviors. We apply the Hadoop technique to deal with the big data of network traffic. Our approach can give information about connection pattern of victims, malicious domains and malicious IPs, which is can help network administrators to mitigate the effect of botnet
Keywords: Botnet, Domain Generating Algorithm, Clustering, Machine learning, Denial of service, Big data, Domain Name System.
Acknowledgments
首先我要感謝蔡錫鈞教授每個禮拜的個別指導,老師在我做研究期間給我很多有用的 建議,並且在我研究完成時耐心地修改我的論文。我也得感謝我的好夥伴智誼,程式 能力極強的智誼除了給我很多實作上的建議之外,他也是Hadoop Cluster的管理人員, 真的很感謝他在Hadoop Cluster壞掉的時候放下他手邊的工作,就是為了讓我早一點 跑實驗,真的很感激他,另外也得謝謝名全學長在我機器學習理論碰到理論上的瓶頸 的時候,願意跟我討論數學的證明,而且學長也常常幫我修投影片與報告。還有蘇俊 憲學長也教導我DNS log和PA的log的知識,並且也是因為蘇學長給我存取DNS log的權 限,我才有機會完成這一份論文。我也要感謝煥博,裕堡,上全,大慶,韋翔學弟以 及奕任在研究上的討論,很多討論的結果都給我在研究上的啟發。最後我也要謝謝我 的父母以及室友,在我研究期間也曾沮喪過低潮過,謝謝他們一直支持我,使我能度 過一次次在研究上的低潮,使我能完成碩士的學業。Contents
1 Introduction 1 2 Analysis of DNS log 7 2.1 Notations . . . 7 2.2 Workflow . . . 7 3 Traffic analysis 24 4 Conclusion 30List of Tables
2.1 Comparsion of different popular 2gram sizes . . . 12 2.2 Simulation on Zbot . . . 23
List of Figures
1.1 The infect stage and attack stage of command-and-control server. 2
1.2 Victims infected by DGA-based malware connect to C&C server . . 4
1.3 System overview . . . 6
2.1 DGA detection workflow . . . 8
2.2 Unique stage pseudo code . . . 8
2.3 Domain extraction stage pseudo code . . . 11
2.4 Pseudo code for computing popular 2gram ratio . . . 12
2.5 Pseudo code for building Trie . . . 13
2.6 Longest meaningful substring . . . 14
2.7 The ROC curve for our approach and approach from [2] . . . 15
2.8 Finding connected components: (a) initial step. (b) send index to neighbors. (c) update index. (d)(e) repeat until no node can be updated . . . 18
2.9 Pseudo code for Join Stage . . . 20
2.10 Pseudo code for Victim Group Detector . . . 21
2.11 Theta measurement . . . 22
3.1 Scan Activity: (a)The ordinary clusters. (b) The clusters when scan happened (c) The summary of one cluster . . . 26
3.2 Json file to specify the connections behavior in one period . . 28
Chapter 1
Introduction
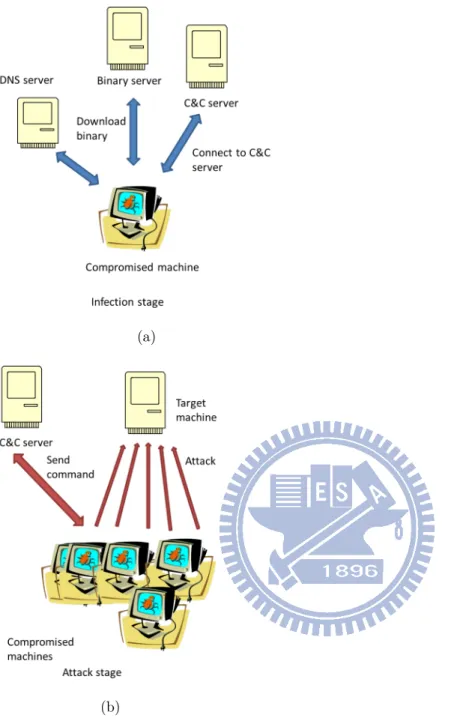
There are many malware flooding in the Internet today. It’s an important and difficult task for network administrator to know which client has been infected by malware. Botnet is a collection of compromised machines, called victims and controlled by a botmaster, which controls the compromised computers by command-and-control (C&C) server. Botnet causes many security problems, such as DDoS attacks, spam mail, phishing, click fraud, information leakage, etc. With the rapid growth rate of the network complexity and traffic size, it is important to build a system to detect victims infected by malware and provide stable IT service. However, it is a challenge to build such a system, because of the huge traffic size and diversity of end-hosts. Even the infected victims are identified, we may not be able to defuse the problem in time, because of the shortage of network facility crew. In this paper, we show a network alarm system, that can detect the potential victim group and monitor group activity when the botnet launches a massive attack.
(a)
(b)
Figure 1.1: The infect stage and attack stage of command-and-control server.
The behavior of C&C server consists of infection stage and attack stage as shown in Fig. 1.1. During the infection stage, when a system is infected and becomes a victim, it will try to find the C&C server by querying the DNS server with some specific domain names. The infected computer will download and execute malicious codes for identity theft, backdoor codes, etc. The victims connect to C&C server via randomly generated domain names to avoid detection, such as the notorious bot Conficker [1], whose infected victims will randomly generate tens of thousands domain names with the domain generation algorithm (DGA) [1, 2, 5, 6]. While only very few of the domains are registered and can be used
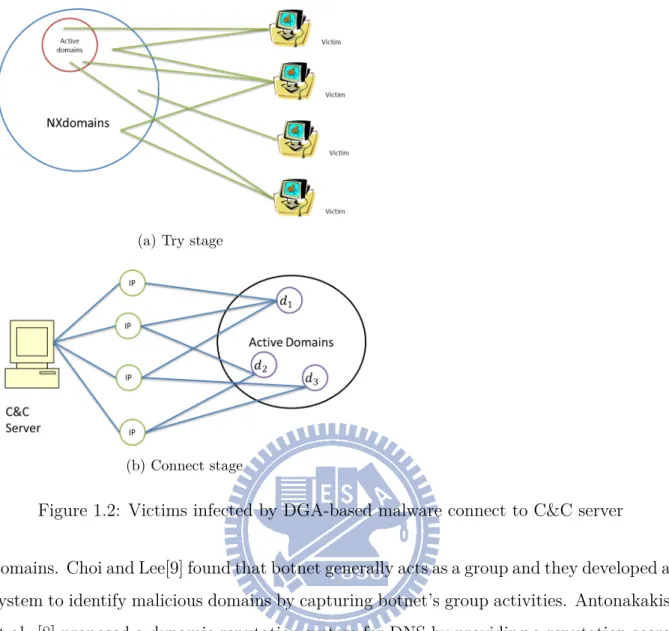
to connect to C&C server. DGA could evade the blacklist and counter measurement, since the botmaster could change the active domains rapidly. The procedure that victims connect to C&C server is shown in Fig. 1.2. We can split the procedure into two stages: try stage and connect stage. In try stage, victims generate a set of domains and the botmaster already has registered a subset of these domains. Victims do not know which domains are registered, and thus select domains from the list randomly and try to connect to C&C server one by one. Note that when these victims try to find the registered domains, they might query the same unregistered domains (NXdomains). We extract from the NXdomains which look like DGA domains by using 2 features: popular 2gram and longest meaning substring, and group these domains into a number of clusters called
NX group. NXDomains in the same NX group indicate that these domains look like
random string and are queried by common clients. After these victims find the active domains, domain name server would return one or multiple IPs which can connect to C&C server. Because these domains belong to the same botmaster, they might share some resolve IPs, because of the limit of available IPs. We consider the domains and IPs as a bipartite graph G = (D, P ) where D is a set of domains and P is a set of IPs. If there is a query on domain d ∈ D for it’s IP and the returned IP address is p ∈ P, then we construct an edge for (d, p). We perform a Hadoop job proposed by [7] on G to find connected components to group active domains called active group. The domains in the same active group indicate that these domains belong to the same network. The detecting intuition is that only victims infected by the same malware connect to the same NXdomains (NXdomains queried by infected clients), and most of these victims would connect to the same active component which others clients never connect with. In other words, it can be observed that one NX group and one active group serve the same clients, which is an unusual event. We build a detection system to analyze DNS log, find DGA-based domains and discover victims infected by the malware DGA-based on this observation. We will discuss the details in Section II.
Many malicious malwares, such as botnet, spyware, spammer etc., abuse DNS to carry out their misconduct. For example, the botmaster, such as Conficker [1] and Torpig [6], usually registers some domains and the compromised computer systems will connect to the C&C server through these domains and start a joint massive attack later. Many researchers [2, 3, 4, 5, 8, 9, 10] have applied machine learning techniques to identify these
(a) Try stage
(b) Connect stage
Figure 1.2: Victims infected by DGA-based malware connect to C&C server domains. Choi and Lee[9] found that botnet generally acts as a group and they developed a system to identify malicious domains by capturing botnet’s group activities. Antonakakis et al. [8] proposed a dynamic reputation system for DNS by providing a reputation score from 35 features for each new domain. Yadav et al. [5] determined malicious domains by domain’s zone features. Some of the domain names are generated by DGA. Yadav et al. also leveraged the fact that the alphanumeric distribution of algorithmically generated domain is very different from those generated by human.
After we got the victims, we consider botnet group activity during the attack stage, the infected computers will execute the instructions downloaded from C&C server and usually target at certain systems to block normal service, conduct click fraud, send spam mails, etc. It means that connection behaviors of these victims are similar because vic-tims connect to the same destination. We build the Traffic log monitor system to capture the group activity and report the destinations where they want to connect and the cor-responding source and destination ports. Then Network administrator could build the access control rules with the obtained information and block the botnet attack.
Xu et al. [12] extracted source and destination IPs from backbone network traffic, and explored the behavior similarity of end-hosts with the same prefix and grouped together the end-hosts with high similarity by the spectral clustering method [11]. The end-hosts in the same cluster means that these clients have similar connection behavior in the time window. Particularly, the cluster is very sensitive to massive activity, such as DDoS attack and scanning. Once we obtain the victim group after inspecting the DNS logs, we use spectral clustering method to analyze the relation between source and destination IPs. As in the work by Xu et al.[12], we can model the relation as a bipartite graph, where the analysis unit is the IPs of victim groups. Then we can identify effectively the security related problems, such as DDoS, scan activity. We will discuss it in Section III.
Since the size of DNS logs and traffic data is huge, it is already a challenge to move the big data around efficiently, let alone processing the data. To this end, we use Hadoop [13] technique to handle the humongous data size. Hadoop is a Java-based platform, which supports big data computation and storage. The MapReduce computation model is adopted in Hadoop, which processes a job in two phases, i.e., Map phase and Reduce phase. While in Map phase it splits input data into chunks and processes them in parallel, and in Reduce phase it collects outputs from Map phase and combines them into the final answer.
Our system overview is as shown in Fig. 1.3. We consider clients in campus network and network traffics pass through the firewall PA [14] and the router, then directed to two collectors, i.e., DNS log collector and PA-Traffic collector. DNS log collector collects the log if a client requests to the domain name server on campus. DNS log collector records the client, queried domains and the corresponding timestamp. PA-Traffic collector collects packet information about source IP, destination IP, source port, and destination port, but PA-Traffic collector does not collect the payload. We apply the DNS Log Analyzer to detect victim group and malicious domains, and store them into Victim Group Database with MongoDB[15]. Finally we use network traffic log to monitor botnet group activity. Network administrator can leverage the information about victims’ malicious domains and results of victim behavior to construct control access rules or simply block the botnet activity.
We summarize our contributions as follows.
Figure 1.3: System overview
• We propose a system for detecting (1) DGA-based malicious domains, (2) corre-sponding IPs, which can connect to C&C server, (3) the victims infected by these malwares, and (4) the victim behavior when acting together.
The rest of the paper is organized as follows. In section II, we show the details of capturing the victims, DGA-based domain names and victim groups from the DNS log. In section III, we show the network behavior analysis with spectral clustering method. We conclude the paper in section IV.
Chapter 2
Analysis of DNS log
In this section we introduce our DNS log analysis workflow.
2.1 Notations
First we introduce some notation. For a DNS record r, we define r.c as the client’s IP which was queried to DNS server by the domain r.d. Note that we only focus on A type query. For example, a DNS record r is as in the following form 29-Oct-2013
15:14:53.722 queries: info: client 140.113.xx.xx#61974: query: ssl.gststic.com IN A +.
It means client 140.113.xx.xx queries for domain ssl.gststic.com with port 61974,, i.e.,
r.c = 140.113.xx.xx and r.d = ssl.gstatic.com.
A domain d can be separated into several parts by dot. The right most part of a domain is called top-level domain (TLD(d)), and the second part is called second-level domain (2LD(d)), and so on. For example, the top-level domain of mail.google.com is
com, the second-level domain is google, and the third level domain is mail.
2.2 Workflow
Our DNS log analysis workflow is shown in Fig. 2.1. There are seven stages: Unique
Stage, DNS Query Stage, DGA domain detection Stage, Join Stage, Spectral Clustering Stage, Connected Component Stage, and Victim Group Detector. We now describe how
they work.
Figure 2.1: DGA detection workflow
in one day. The input of Unique Stage is the raw data of DNS log and white list domains. For each record r in DNS log, this process removes duplicate records and records with r.d in the white list, then output a list of distinct domains queried in a day. The algorithm is shown in Fig. 2.2. In practice, we confront the problem of the huge size of DNS log. Therefore, we adopt Hadoop [13] technique to parallelize this process. Mappers extract
r.d from DNS log and send the (r.d, null) key/value to the Reducers. Reducers receive
the domains list from Mappers, filter out the domains in white list and output the unique domain list.
Input : The DNS l o g DN S ={r1, r2, ..., rn} , white l i s t domains W = {d1, d2, ..., dm}
Output : The unique domain l i s t D
Unique ( DN S ) D =∅ fo r each r∈ DNS i f r.d /∈ D and r.d /∈ W D = D∪ {r.d} end i f end fo r return D
Figure 2.2: Unique stage pseudo code
Stage into two classes: active domains and NX domains. For each domain d, we query
world-wide domain name servers to resolve the domain. If we receive the IP list P =
{p1, p2, ...pN} from world-wide domain name servers, it means that this domain is active
domain, and we add this domain and the corresponding IPs into Active Domains List. On
the other hand, if the domain is a failure domain or expired domain, then we add these domains into NX Domains List. Note that when we query to some domain name servers with NXDomains, the domain servers would return a specific IP. For example, OpenDNS [16] would return 67.215.65.132 if the domain is NXDomain. We prepare an IP list that represents the NXDomain from the report on the internet [17]. If domain name server returns an IP appearing in the list, then we add the domain into NX Domains List.
(3) DGA Detection Stage: In NX Domains List, there are some type error domains like yqhoo.com or expired domains or DGA domains queried by victims. This stage is responsible for classifying the domains from DGA and other NX domains. To classify these domains, we choose six features and adopt the Alternating Decision Tree (ADT) [18] to classify domains. Antonakakis et al. [2] used a similar approach to classify domains from DGA and benign domains. Intuitively, legitimate domain names are usually easy to memorize or spell. While the names generated by botnet, such as Conficker, are usually hard to pronounce. To quantify this observation, we use two features, popular 2-gram (two consecutive alphanumeric characters) and longest meaningful substring (longest substring which can be found in dictionary). For example, the longest meaningful substring of
getsomeinformation is information. To determine the longest meaningful substring, we
define that a string is meaningful if the string appears in English dictionary. Benign domains tend to have longer LMS than DGA domains. The idea of longest meaningful substring was proposed by Bilge et al. [19]. They query strings on google search engine, and define a string to be meaningful, if the number of results returned by google is larger than a threshold. We use the English dictionary from Debian GNU/Linux 6.0.4 (/usr/
share/dict/american-english). We build a trie data struct [20] to store and match words. Trie is a prefix tree which can be used to store a set of strings and can be looked up
efficiently.
Google scanned over two trillions of English words and computed the frequency of each pair of consecutive letters [21]. The frequency list of 2gram is shown on the webpage:
called popular 2grams. We will argue why 250 is a reasonable choice later. The popular 2grams help us pinpoint the random domains generated by algorithms. For example, consider a well known domain name wordpress, whose 2gram set is: { wo, or, rd, dp, pr,
re, es, ss} and popular 2gram set is { wo, or, rd, pr, re, es, ss}, i.e., over 80% of the
2grams are popular. While the domain name jsgjeyxsko, generated by Conficker, has the popular 2gram set {je, ey, sk, ko}, which is less than 50% of its 2gram set.
Note that there are 2grams not popular in English but may be popular in other countries. We include three non-popular 2grams: ku, ko, ao, which are common in Chinese and Japanese domain names.
For each domain d, we extract the following features for classification. 1. Length of 2LD(d)
2. Length of 3LD(d)
3. Ratio of popular 2gram in 2LD(d) 4. Ratio of popular 2gram in 3LD(d) 5. Longest meaningful substring in 2LD(d) 6. Longest meaningful substring in 3LD(d)
We collect many DGA-based domains from Threat Expert [22], and other malware reports [1, 23, 24]. We got domains from Conficker, Zbot, Srizbis, Bobax, Kraken. We randomly choose 4/5 of these domains as training DGA domains, and collect the top 10000 domains from Alexa [25] website http://www.alexa.com/ as training benign domains, and build an ADT by these training data. To verify the classifier, we use Receiver operating
charac-teristic (ROC) curves [26] to measure the accuracy of a model. We used top 10000 ~
12000 domains from alexa.com and the remaining 1/5 DGA domains as testing data. We measure the ROC curve for different popular 2gram definitions (used top 100, 150, 200, 250, 300 as popular 2gram). With the result shown in Table 2.1, we choose the top 250 most frequent 2gram as our popular 2gram. The domain features extraction procedure is shown in Fig. 2.3.
Recently, [2] Antonakakis et al. proposed a method to classify a group of domains whose size is equal to γ as DGA domain group or benign group by ADT. We focus on
Input : a domain d , pop2gram i s a s e t o f p o p u l a r gram , W i s a s e t o f d i c t i o n a r y words . Output : an a r r a y o f d o u b l e r e p r e s e n t t h e f e a t u r e s o f domain d
DOMAIN_EXTRACT( d , pop2gram , W ) Let f eatures[0..5] be a new a r r a y .
missing =−1 Let s2 be 2Ld ( d ) s3 = NIL i f 3LD( d ) e x i s t s3 = 3Ld ( d ) end i f Let S ={s2, s3} // l e n g t h f e a t u r e s index = 0 for i = 2 t o 3 i f si == NIL f eatures[index] = missing e l s e f eatures[index] = si.length end i f index = index + 1 end fo r // compute r a t i o o f p o p u l a r 2gram fo r i = 2 t o 3 i f si == NIL f eatures[index] = missing e l s e f eatures[index] = POP2GRAM_RATIO( si) end i f index = index + 1 end f o r // compute LMS t = B u i l d T r i e ( W ) fo r i = 2 t o 3 i f si == NIL f eatures[index] = missing e l s e maxString = LMS( si, t ) f eatures[index] = maxString.length end i f index = index + 1 end for return 11
Size ROC curve % 0 94.2% 50 95.6% 100 96.1% 150 96.2% 200 95.9% 250 96.3% 300 95.9% Use All 94.5%
Table 2.1: Comparsion of different popular 2gram sizes
Input : an a r r a y o f c h a r a c t e r s label Output : an a r r a y o f 2gram l i s t gram
GET_2GRAM( label )
Let gram[0...label.length− 2] be a new array fo r i = 0 t o label.length− 2
Let onegram[0, 1] be new c h a r a c t e r s a r r a y
onegram[0] = label[i] onegram[1] = label[i + 1] gram[i] = onegram end f o r return gram Input : an a r r a y o f c h a r a c t e r s s Output : t h e r a t i o o f p o p u l a r 2gram POP2GRAM_RATIO( s ) : popcount = 0 // c o u n t e r p o p u l a r 2gram grams = GET_2GRAM( s ) fo r i = 0 t o gram.length− 1 i f gram[j]∈ pop2gran popcount = popcount + 1 end i f end for return popcount/gram.length
Input : W i s s e t o f words Output : Root o f t r i e r B u i l d T r i e ( W ) Let r be a t r e e node fo r each w∈ W trace = r for i = 0 t o w.length− 1
i f trace.cw[i] == NIL // Located new c h i l d
Let trace.cw[i] be a new t r e e node
trace.cw[i].accept = f a l s e
end i f
trace = trace.cw[i]
end for
trace.accept = true end fo r
return root
Figure 2.5: Pseudo code for building Trie
γ = 1, because we want victims infected by the same malware to be grouped into the
same cluster in the following Spectral Clustering Stage. Antonakakis et al. split a list of NXDomains into k groups with size γ and classify each group by 33 features. They allowed some of DGA domains to be classified as benign domains (i.e., four from benign domains and one from DGA domains in one group and classify them as benign domain group), because they used the Hidden Markov Model (HMM) to find the C&C server based on the domain text string. In this work, we find the C&C server domains by victims’ connection behaviors. The DGA domains, which are connected by different clients, are extremely important (most of the DGA NXDomains are just queried by one client). If we used
γ > 1, the extremely important NXDomains might be dropped. So we use γ = 1.
Results of our experiments show that our features are better than [2] when γ = 1. We give the ROC curves of our approach and the one by [2] as shown in Fig. 2.7. Note that several features from [2] are not considered, such as the variance of length, variance of entropy etc, when γ = 1. The 18 active features used in [2] are as follows:
1. Ngram features: measure the frequency distribution of ngrams for the domain name strings, with n = 1,..,4 and use median, average and standard deivation as features
Input : S t r i n g s , r o o t o f t r i e t .
Output : Longest m e a n i n g f u l s u b s t r i n g o f s
LMS( s , t )
trace = t
Let maxLenString be an empty s t r i n g
for i = 0 t o s.length− 1 for j = i t o s.length− 1
i f trace.accept == true and j− i + 1 > maxLenString.length maxLenString = s[i...j] end i f i f trace.cs[j] == NIL break e l s e trace = trace.cs[j] end i f
i f trace.accept == true and j− i + 1 > maxLenString.length maxLenString = s[i...j]
end i f end f o r
return maxLenString
Figure 2.7: The ROC curve for our approach and approach from [2] (3×4=12 features).
2. Meansure entropy of character distribution from 2LD(d). 3. Meansure entropy of character distribution from 3LD(d). 4. Number of distinct characters
5. TLD(d) is .com or not 6. Length of domains 7. Number of levels.
Comparing with the area under ROC curve, Antonakakis [2] has 0.918. and our approach has 0.963. We get a larger area, which is better under the measure of ROC curve.
(4) Join Stage: In the DGA Detection Stage, we collect the DGA-like NXDomains. In this stage we look up the raw data of DNS log and find the clients which had queried these domains. Since the log size is huge, we use Hadoop technique to find all pairs of (B, d), where B is a client and d is a DGA-like NXdomain. The pseudo code is shown in Fig. 2.9.
(5) Spectral Clustering Stage: The victims infected by the same malware will attempt to connect the same NXDomains. This is an unusual event. Two domains with higher similarity means that they have more common clients trying to connect to them. In this stage, we try to group DGA-like NXDomains into groups from Join Stage, which
collects all the (B, d) pairs from DNS log. We compute the similarity by Ochiai[27] coefficient between domains.
Definition 1 Ochiai coefficient : Let B1 and B2 be the set of clients IP and D1 and D2
be the two domains, which B1 and B2 connect with, respectively. The Ochiai coefficient
of D1 and D2 is: Ochiai(D1, D2) = |B1∩ B2| √ |B1| × |B2| .
In this stage, we first build the similarity matrix M . Let M be the n×n matrix, where
n is the number of domains. Mij is the Ochiai coefficient of domain i and domain j. We
apply spectral clustering algorithm to group domains. Spectral clustering is a popular clustering approach for graph partition. We use the approach proposed in [12]. Given a similarity matrix M and two parameters α = 0.95 and β = 2, the spectral clustering works as follow:
1. Let D be the diagonal matrix, and Dii= ΣjMij.
2. Compute the matrix L = D−1/2M D−1/2.
3. Find all eigenvectors and corresponding eigenvalues λ0 ≥ λ1 ≥ λ2 ≥ ... ≥ λn from
L.
4. Find the maximum λkwhere Σi≤kλi ≥ α×Σi≤nλi and (λk−1−λk) > β×(λk−λk−1).
5. Construct the matrix X = [u1u2...uk] where ui is the corresponding eigenvector of
eigenvalue λi.
6. Construct the normalized matrix Y , where Yij = (ΣjXij2)2.
7. The i-th row of Y represents data point i, clustering rows with k-means, where the number of clusters k is already found at step 4.
In this stage, we find NX groups N X = {nx1, nx2, ...nxm}, where nx = {d1, d2, ..., dn}.
Each NX group consists of DGA-like NXDomains which were connected by common clients. This is an unusual event for general users. These groups of domains are called
NX group. We collect all of the NX groups and send them to Victim Group Detector,
(6) Connected Component Stage: DGA-based virus generates domains every day, and the botmaster only registers a subset of these domains. The victims will try to connect to these registered domains to reach C&C server. Because of the limited number of IP, we assume IPs used by one malicious domain could be also used by some other malicious domains. In this stage we group the active domains from Active Domain List. Domains in the same group means these domains belong to the same network. Recalling
DNS Query Process, Active Domain List consists of a list of tuple (d, P ), where d is an
active domain and P is the corresponding IP list. To illustrate how to group the domains, we build a bipartite graph G = (D, P ), where D is a set of active domains and P is a set of IPs. For one domain d ∈ D and one IP p ∈ P , there exists an edge iff IP address p is returned when we query domain d to the world wide domain name server in DNS Query
Process. Because there are many active domains in the network, finding all connected
components in G by a single machine is impractical. We use Hadoop cluster and the algorithm proposed by [7] to find connected components. Given a graph G, we first assign a unique index id for each node d. In the map phase, every node sends it’s index i
to its neighbors. In reduce phase, every node receives an index list I ={i1, i2, ..., in} sent
from it’s neighbors, and updates it’s index by i(new)d = min{id, i1, i2, ..., in}. We repeat
the map phase and reduce phase until no node can be updated. Nodes with the same index means they are in the same connected component. Fig. 2.8 shows how to find the connected components. We define the component as acti ={d1, d2, d3, .., dn} called active
group, where i is the unique active group ID. Finally, we collect all of the active groups
and send them to Victim Group Detector.
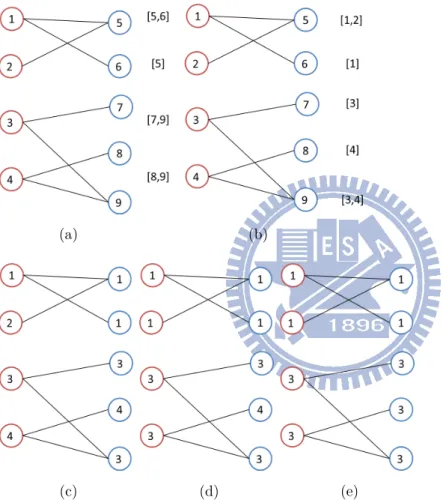
(7) Victim Group Detector: Recall that, in Spectral Clustering Stage, client in-fected by the same malware using the same DGA would attempt to connect the same DGA-like NXDomains. On the other hand, they might connect to the same active group which are extracted in Connected Component Stage. Consider the victims infected by one DGA-based malware, when the victims try to connect to C&C server. Victims attempt to connect the common NXDomains (in the same nx), and finally connect to the same act (active domains might share the same IPs). We compute the Jaccard [26, 28] similarity between each pair of (act, nx).
Definition 2 Jaccard similarity : Let Bacti be the set of client IPs which had queried to
(a) (b)
(c) (d) (e)
Figure 2.8: Finding connected components: (a) initial step. (b) send index to neighbors. (c) update index. (d)(e) repeat until no node can be updated
The Jaccard similarity of acti and nxj is:
J accard(acti, nxj) =
|Bacti ∩ Bnxj|
|Bacti ∪ Bnxj|
.
For filtering noise, we filter out the NX group with size smaller than five (|nx| < 5), because the size of NXdomains generated by DGA-based malware is usually more than 100 in one day. We also filter out the act group if the number of clients which have queried to this act is less than four. The reason is if we do not set this threshold, we might classify benign domains as domains of C&C server. Consider there are two compromised machines in the network and they all connect to benign.com every day. Our detection system would find that they all connect to the same NX group which is generated by a malware. In this situation, similarity between the NX group and benign.com is high, and our system would report such pair. It simply generates noise record with benign act and we will filter out such act group.
By the above filtering approach, now we show that it is an abnormal event if there exist nx, and act such that Jaccard(nx, act) ≥ θ, where we choose θ = 0.7 empirically. Note that the θ depends on the network. Different networks might use different θ. We show how we choose the suitable θ to detect victims behavior better. We performed an experiment on DNS log which was collected on 2013/09/07. We extracted 152125 active groups and 458 NX groups. We measured Jaccard similarity for all possible (act, nx) pair and collect the (act, nx) pair if Jaccard(nx, act) ≥ θ. The relation between θ and the number of collected pairs is shown in Fig. 2.11. It can be observed that it’s rare to find the act and nx with high Jaccard similarity. However, recall the observation mentioned in Section 1. Victims infected by the same malware attempt to connect to the NX groups and
active group, which other clients never connect. We can find the (nx, act) pair with high
similarity if clients in our network have been infected. We simulate behaviors of victims infected by the well-known DGA-based malware to show that victims’ group connection behavior would generate (act, nx) with relative high Jaccard similarity. We will discuss it later. We consider actmal as malicious domain group (domains direct to C&C server)
if there exists nxmal ∈ NX such that Jaccard(nxmal, actmal)≥ θ, and we consider clients
which had connected to actmalas victim group because these clients attempted to connect
to C&C server. We store the victims group and corresponding actmal, nxmal to victim
group database.
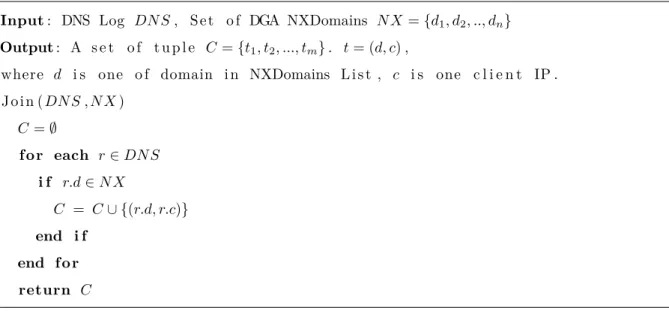
Input : DNS Log DN S , S e t o f DGA NXDomains N X ={d1, d2, .., dn}
Output : A s e t o f t u p l e C ={t1, t2, ..., tm} . t = (d, c) ,
where d i s one o f domain i n NXDomains L i s t , c i s one c l i e n t IP . J o i n ( DN S , N X ) C =∅ fo r each r∈ DNS i f r.d∈ NX C = C∪ {(r.d, r.c)} end i f end for return C
Figure 2.9: Pseudo code for Join Stage
simulate the DNS records when they try to connect to C&C server. We set up several connection parameters as follows:
1. Maximum try: Conficker C generate 50000 domains per day and victims randomly choose 500 domains to connect to C&C server. If fail to connect to C&C server, these victims will sleep one day. On the other hand, some of victims infected by other malwares (i.e. Bobax) would try to connect until connect to C&C server or all of candidate domains have been tried. In our experiment, Maximum try parameter is set to “retry until connect” or “up to five hundred times trial”.
2. Register Rate: Botmaster needs to register a subset of domains generated by DGA-based malware. This parameter specifies the ratio of domains that are generated and registered. Victims would connect with more NXDomains, if the register rate is low.
3. Number of victims: It is the number of victims in our network. The more victims are infected by the same malware, the easier we could get more complete NX groups. 4. IP configuration: In active domains side, these domains might be resolved to one
single IP (single IP) or to multiple IPs. Botmaster might construct the botnet by applying IP fast-flux technique. Domain name server might return different IPs in each query for one domain. IP fast-flux brings fragment when we construct the Active Domains Groups. The parameter IP configuration can be set to “single IP” or
Input : S e t o f a c t i v e group ACT ={act1, act2, ..., actn} ,
S e t o f NX group N X ={nx1, nx2, ..., nxm} ,
DNS Log DN S
Output : Victim Group G ={g1, g2, ..., gk} , g = (act, nx, C = {c1, c2, ..cl}) ,
where C i s a s e t o f c l i e n t IPs , which had c o n n e c t e d t o domain d∈ act
VICTIM_GROUP( ACT , N X , DN S )
Let N XContain ={nxcon1, nxcon2, ..., nxconm}, nxconi=∅, i ≤ m
Let ActContain ={actcon1, actcon2, ..., actconn}, actconi=∅, i ≤ n
G = ∅ // I n i t i a l i z a t i o n fo r each r i n DN S i f r.d∈ acti actconi= actconi∪ {r.c} end i f i f r.d∈ nxi nxconi= nxconi∪ {r.c} end i f end f o r θ = 0 . 7 fo r actconi∈ ActContain f o r nxconj ∈ NXContain i f J a c c a r d ( actconi, nxconj) > θ
Let g be a t u p l e ( acti, nxj, actconi)
G = G∪ {g}
end i f end f o r end f o r return G
Figure 2.11: Theta measurement
“IP flux”. To simulate IP fast-flux, we choose 50 IPs from one “5.2.10.1~5.2.10.50”. With a specific set of DNS log, we make sure that there is no domain queried by clients from our campus resolved to these 50 IPs. When one DGA domain is marked as active domain and “IP-flux”, we randomly choose 5 of 50 IPs as the answers in
DNS Query Stage.
We first randomly choose clients on campus as fake victims, and simulate DNS log as if these clients are compromised by the same DGA-based malware. Second, we add these DNS log into original DNS query log and feed these log into our detection system to find these fake victims. We measure with two DGA (Conficker C, Zbot) bots with different parameters setting as mentioned above. We implement the DGA algorithm for each malware by online malware reports or malware analysis paper [1, 23]. The simulation result is shown in Table 2.2. Capture number is the number of fake victims reported from our system. However, we can not detect fake victims infected by Conficker C, which generates 50000 domains in one day and the similarity between NXdomains are relative low if there are very few victims in our network. With low similarity of NXdomains, our system cannot generate the complete nx, which most of victims have queried. This is a limitation of our system. We leave the improvement as future works.
Maximum try Number of victims Register Rate IP configuration capture number
Retry Until Connect 10 0.01 Single 10
Try 500 times at most 10 0.01 Single 9
Retry Until Connect 25 0.01 Single 25
Try 500 times at most 25 0.01 Single 22
Retry Until Connect 10 0.002 Single 10
Try 500 times at most 10 0.002 Single 7
Retry Until Connect 25 0.002 Single 25
Try 500 times at most 25 0.002 Single 19
Retry Until Connect 10 0.01 Fast-Flux 10
Try 500 times at most 10 0.01 Fast-Flux 8
Retry Until Connect 25 0.01 Fast-Flux 25
Try 500 times at most 25 0.01 Fast-Flux 23
Chapter 3
Traffic analysis
In DNS log analysis, we propose the methodology for detecting victims group. Because of false positive, machine learning approach might recommend innocent client IPs as victims. Furthermore, these victims may not attack any other machines directly. It’s difficult to block victims directly in practice. In this section, we use a system to monitor victims’ network behaviors on packet level, and extract the information for admistrator to mitigate botnet attacks. Once the information of infected groups is available, we analyze the packet traffic in order to capture group activity. We use only four features, (srcIP, dstIP, srcPort, disPort), for similarity analysis. For this we adopt the approach by [12] to cluster network behaviors by using spectral clustering method. For one network segment we track the similarity of end-hosts’ connections. If two end-hosts’ destination IPs are similar during a period of time, then they will be assigned to the same cluster. Jaccard similarity measurement is applied to this part of analysis. Fig. 3.1a shows one cluster result in one prefix. We can see Fig. 3.1a is a similarity matrix and the deeper the color of (i, j) in the matrix, the higher the similarity of client i and client j. As we mentioned in the introduction, clusters are sensitive with group activity such as DDoS attack or scan activity. Fig. 3.1 shows the original cluster result and clusters when scan activity occurred. Fig. 3.1 is one cluster result. After three minutes, scan activity started. An IP 212.xx.xx.xx scanned on the campus network at port 80, and campus network received packets and sent back to the scanner in a short time. The clusters become larger because many clients responded accordingly. The cluster summary is shown in Fig. 3.1c. Network administrator can observe the common dstIP they sent (212.xx.xx.xx) and the corresponding port. We apply this method to capture group activity and report
the information about the IPs that these victims want to connect and the corresponding ports. In our system, network administrator can build access control rules by monitoring the group dstIP or dstPort to block malware behavior before all victims are discovered.
(a) (b) cluster 0 src: 140.xx.xx.xx 140.xx.xx.xx 140.xx.xx.xx ...
used Ports set([80]) to connect dst IP 212.xx.xx.xx
dstPorts set([59073, 38466, 57955, 57311, 54289, 33833, 40398, 45936, 50865, 34324, 46869, 48479, 55485, 52894, 49973])
(c)
Figure 3.1: Scan Activity: (a)The ordinary clusters. (b) The clusters when scan happened (c) The summary of one cluster
We collect data from PA, a commercial security package [14], which stores traffic records of each IP. We apply Hadoop technique to handle the huge log. There are nearly 190GB traffic log in one day. We write Hadoop job which is responsible to collect the data in traffic log and build Json files to describe the clients connections behavior in each period. An example of Json file is shown in Fig. 3.2, where it can be observed that there are two active clients (srcIP1, srcIP2) in this period, and srcIP1 connect to dstIP1
and dstIP2. We can compress the traffic data and speed up the cluster procedure, when
o b j e c t : { srcIP1 : { dstIP1: { srcP ort : [ 1 2 3 ] dstP ort : [ 1 2 3 ] } dstIP2: { srcP ort : [ 5 1 4 ] dstP ort : [ 5 1 4 ] } } srcIP2: { 4 5 5 7 8 dstIP2: { srcP ort : [ 5 1 4 ] dstP ort : [ 5 1 4 ] } dstIP3: { srcP ort : [ 4 5 5 7 8 ] dstP ort : [ 8 0 ] } dstIP4: { srcP ort : [ 5 7 8 6 9 ] dstP ort : [ 5 3 ] } } }
Figure 3.2: Json file to specify the connections behavior in one period
In the Section 2 , we extract active connected components in Connected Component
Stage, and some of active components would be reported as suspicious domains in Victim Group Detector. Note that we just query each domain one time, and we might get all of
Figure 3.3: Fragments of connected component
IPs poll for one domain. It brings fragment effect that is shown in Fig. 3.3, where five victims, on the right hand side, connect to C&C server with five domains (d1, d2, ..., d5),
and the connection records are stored in DNS log. When we analyze the log, we get the mapping of domains and corresponding IPs (i.e. d1 to IP1, IP2) and build active
components list. As shown in Fig. 3.3, we might obtain two victim groups even if they actually belong to the same botnet. So Instead of treating one victim group as one network segment, we put all the victims reported from Victim Group Detector as one network segment and analyze the network connection behavior in the segment. The procedure is as follows:
1. For one time period (i.e. 5 minutes), collect the records with srcIP marked as victim. 2. Build the similarity matrix M with these records. For each pair of victims (i,j), we
compute the Jaccard similarity Jaccard(i, j) = |Ai∩Aj|
|Ai∪Aj|, where Ai is a set of dstIP
with which client i connects in the period.
3. Apply the spectral clustering, which is the same one used in Spectral Clustering
Stage.
4. For each cluster we build a summary that specifies the dstIP, srcPort, disPort as shown in Fig. 3.1c.
5. After clustering, use Data-Driven Documents [29] and Jquery [30] to present the results, such that network administrator can review on the web.
Chapter 4
Conclusion
We propose a new method to determine the domains generated by DGA-based malware, victims infected by the same DGA-based malware and active domains which direct to C&C server. Along the way, we use Hadoop technique and tools from machine learning for clustering. After finding the victim groups, we apply network behavior clustering tech-nique to monitor the victim’s group activity. Our works provide network administrators valuable information to construct access control rules. Our system still cannot detect victims infected by Conficker C with the log within 24 hours. It is possible to collect long term DNS log data for detecting. However, it will need more computing power for analyzing. We leave it as a future work.
Bibliography
[1] P. Porras, H. Saidi and V. Yegneswaran, Conficker analysis, SRI International, 2009. [2] M. Antonakakis, R. Perdisci, Y. Nadji, N. Vasiloglou, S. Abu-Nimeh, W. Lee, D. Dagon. From throw-away traffic to bots: detecting the rise of dga-based malware. In Proceedings of the 21st USENIX Security Symposium, 2012.
[3] U. Fiore, F. Palmieri, A. Castiglione and A. De Santis, Network anomaly detection with the restricted Boltzmann machine, Neurocomputing, Vol. 122, pp. 13-23, 2013. [4] F. Palmieri and U. Fiore, A nonlinear, recurrence-based approach to traffic
classifi-cation, Computer Networks, Vol. 53, pp. 761–773, 2009.
[5] S. Yadav, A. Reddy and S. Ranjan, Detecting algorithmically generated malicious domain names, Proceedings of the 10th ACM SIGCOMM conference on Internet measurement, pp 48–61, 2010.
[6] B. Stone-Gross, M. Cova, Lorenzo Cavallaro, B. Gilbert, M.Szydlowski, R. Kem-merer, C. Kruegel and G. Vigna, Your botnet is my botnet: analysis of a botnet takeover, Proceedings of the 16th ACM conference on Computer and Communica-tion security, pp 635–647, ACM, 2009.
[7] U Kang, C. E. Tsourakakis, Christos F, PEGASUS: A Peta-Scale Graph Mining System - Implementation and Observations, IEEE ICDM 2009, pp 229–238, 2009. [8] M. Antonakakis, R. Perdisci, D. Dagon, W. Lee and N. Feamster, Building a dynamic
reputation system for DNS, in USENIX Security Symposium, pp 273–290, 2010. [9] H. Choi and H. Lee, Identifying botnets by capturing group activities in DNS traffic,
[10] C. Dietrich, C. Rossow, F. Freiling, H. Bos, M. van Steen and N. Pohlmann, On botnets taht use DNS for command and control, European Conference on Computer
Network Defense (EC2ND), pp 9–16, 2011.
[11] U. V. Luxburg. A tutorial on spectral clustering. Statistics and computing, Statistics and computing, Vol. 17, pp 395-–416, 2007.
[12] K. Xu, F. Wang and L. Gu, Network-aware behavior clustering of internet end hosts, IEEE INFOCOM 2011, pp 2078–2086, 2011.
[13] Apache Hadoop. http://hadoop.apache.org.
[14] Palo Alto Networks. https://www.paloaltonetworks.com. [15] MongoDB. http://www.mongodb.org.
[16] OpenDNS. http://www.opendns.com. [17] http://f.00f.net/PubDNS/redirecting.txt.
[18] Y Freund, L Mason, The alternating decision tree learning algorithm. In ICML, volume 99, pp 124-–133, 1999.
[19] L. Bilge, E. Kirda, C. Kruegel, and M. Balduzzi. Exposure: Finding malicious do-mains using passive dns analysis. In NDSS, 2011.
[20] E. Horowitz, S. Sahni, D. P. Mehta. Fundamentals of Data Structures in C++, 2nd ed, Silicon Press.
[21] I. Lutkebohle, English letter Frequency Counts: Mayzner Revisited or ETAOIN SRHLDCU. http:// norvig.com.mayzner.html. English letter Frequency Counts: Mayzner Revisited. http://norvig.com.mayzner.html.
[22] Threat Expert. http://www.threatexpert.com.
[23] File-Patching ZBOT Variants ZeuS 2.0 Levels Up. http://www.trendmicro.com/ cloud-content/us/pdfs/security-intelligence/white-papers/wp__file-partching-zbot-varians-zeus-2-9.pdf.
[24] Technical details of Srizbi’s domain generation algorithm. http: //www.fireeye.com/ blog/ technical/ botnet-activities-research/ 2008/11/ technical-details-of-srizbis-domain-generation-algorithm.html.
[25] Alexa. http://www.alexa.com.
[26] J. Han, M. Kamber and J. Pei, Data Mining, Concepts and Techniques, 3rd ed, Mor-gan Kaufmann, 2012.
[27] Cheetham, A. H., & Hazel, J. E. (1969). Binary (presence-absence) similarity coeffi-cients. Journal of Paleontology, pp 1130–1136.
[28] S. Kiyomoto, K. Fukushima, Y. Miyake, ”Design of Catego-rization Mechanism for Disaster-Information-Gathering System”,
Journal of Wireless Mobile Networks, Ubiquitous Computing, and Dependable Applications, Vol.3, No.4, pp 21–34, 2012.
[29] Data-Driven Documents. http://d3js.org. [30] Jquery. http://jquery.com.


![Figure 2.7: The ROC curve for our approach and approach from [2]](https://thumb-ap.123doks.com/thumbv2/9libinfo/8250966.171694/23.892.289.603.120.384/figure-roc-curve-approach-approach.webp)