* Author for correspondence.
Simultaneous Quantitation of Cationic Disinfectants by
High-Performance Liquid Chromatography on a Silica
Gel Column Using Aqueous Eluents
FU-AN CHEN1, KUN-SHAN WU2, MING-CHUNG HUANG3, CHAU-YANG CHEN1AND AN-BANG WU4*
1.Department of Pharmacy, Ta-jen Institute of Technology, 20, Wei-Shin Road, Yan-Puu Hsiang, Pingtung Hsien 907, Taiwan, R.O.C. 2.Tainan County Health Bureau, 72, San Min Road, Hsinyiang City, Tainan Hsien 732, Taiwan, R.O.C.
3.National Laboratories of Foods and Drugs, Department of Health, Executive Yuan, 161-2, Kuen Yang Street, Nankang 115,
Taipei, Taiwan, R.O.C.
4.Graduate Institute of Pharmaceutical Sciences, Taipei Medical University, 250, Wu Hsing Street, Taipei 110, Taiwan, R.O.C.
(Received: June 29, 2001; Accepted: August 15, 2001)
ABSTRACT
A simple, rapid, and accurate high-performance liquid chromatographic (HPLC) method for quantitation of cationic disinfectants was developed using a silica gel column with aqueous mobile phases. The disinfectants are classified into two categories, both of which can be separated simultaneously on a µ-Porasil silica gel column (3.9 ×300 mm). An aqueous mobile phase (1), composed of CH3CN: H2O
(70/30, v/v), triethylamine (0.04%), and acetic acid (0.1%), with UV detection at 262 nm, provides quantitation of benzalkonium chloride (1) and chlorhexidine gluconate (2) in cosmetics. The identification of two cationic disinfectants in each cosmetic sample can be achieved in 9 min with dextromethorphan HBr as an internal standard. With the mobile phase (2) of CH3CN: H2O (90/10, v/v), triethylamine
(0.04%), and acetic acid (0.1%), setting the UV detection at 269 nm can identify the constituents of domiphen bromide (3), benzethonium chloride (4), cetylpyridium chloride (5), and dequalinium chloride (6) in pharmaceuticals. When propantheline bromide was used as an internal standard, the quantitation of four cationic disinfectants in each pharmaceutical sample could be completed within 16 min. The method provides a reliable, prompt way to analyze cationic disinfectants in both household cosmetics and pharmaceutical preparations available on the market.
Regression equations of six standard curves revealed the related coefficients, r2, of between 0.9997 and 1.0000. The HPLC method can be carried out with a high level of precision and accuracy. From the intra- and interday tests, the coefficients of variation (CV) were between 0.13% and 2.04% for cosmetics, and 0.08% and 0.87% for pharmaceuticals. The recoveries were found to be 96.75%~99.95% for cosmetics with CV of 0.45%~2.88%, and 99.17%~99.92% for pharmaceuticals with CV of 0.21%~0.47%.
Key words: HPLC, cationic disinfectant, silica column, cosmetics, pharmaceuticals
INTRODUCTION
Benzalkonium chloride (1) and chlorhexidine gluconate (2), commonly used in cosmetics as preservatives or bacteri-cides, should not exceed 0.05% according to the Drug
Components Standard of Cosmetics(1) as regulated by the
Department of Health, Executive Yuan, R.O.C. Benzalkonium chloride is often added to cosmetics such as shampoos and hair conditioners, while chlorhexidine glu-conate is an active ingredient in compounding facial creams. In general, the preservatives, i.e., benzalkonium chloride, domiphen bromide (3), benzethonium chloride (4), cetylpyridium chloride (5), and dequalinium chloride (6), are classified as quaternary amine drugs, which share a few com-mon properties, e.g., they can adhere to the surfaces of bacte-ria, destroying their cell walls and membranes, and inactivat-ing their enzymatic activities. These drugs are often used as effective ingredients for manufacturing certain pharmaceuti-cal preparations such as tablets and lotions. Chlorhexidine gluconate does not belong to the same family as it does not
have a quaternary ammonium functional group. However, it has similar physical, chemical, and anti-bacterial proper-ties(2), and thus it is regarded as an effective anti-bacterial biguanide.
In using reversed-phase HPLC to analyze basic amine drugs, the most common disadvantages encountered are peak tailing and lengthy time consumption(3-6). In the present study, we selected a silica gel column combined with aque-ous mobile phases for HPLC analysis of six basic amine drugs with the objective of improving of quantitation tech-niques.
MATERIALS AND METHODS
I. Materials
(I) Cosmetics and Pharmaceuticals
The cosmetics tested included various brands of sham-poo and facial cream available on the market. Pharmaceu-ticals were in the forms of tablets and lotions. Both categories of samples (trade names are substituted by codes) were pur-* Author for correspondence. Tel: 02-27361661 ext. 692;
chased from a local drugstore in suburban Taipei in 1997. (II) Reagents
Methanol and acetonitrile (LC grade) were purchased from Labscan (Dublin, Ireland). Triethylamine (reagent grade) was from Merck (Gibbstown, NY, USA). Acetic acid (reagent grade) was from Nacalai Tesque (Kyoto, Japan). Tetramethylammonium chloride (reagent grade) was pur-chased from Sigma Chemical (St. Louis, MO, USA). Sodium chloride (reagent grade) was from Wako Pure Chemical Industries (Osaka, Japan).
(III) Standard Chemicals and Internal Standards
The chlorhexidine gluconate (20%) standard was pur-chased from Sigma Chemical. Benzalkonium chloride (C16), domiphen bromide, benzethonium chloride, cetylpyridium chloride, dequalinium chloride, propantheline bromide, and dextromethorphan HBr were from USP Standards (Rockville, MD, USA).
(IV) Apparatus
The high-performance liquid chromatograph included a Waters (Milford, MA, USA) Model 600E system controller, Waters Model 510 pump, Waters 717 auto-sampler, Waters 486 tunable absorbance auto-sampler detector, and a comput-er integrator. A Watcomput-ers µ-Porasil 125A, 10-µm silica gel col-umn (3.9 mm i.d. ×300 mm) and a Milli-Q-Waters purifica-tion system (Milli-Pore, Milford, MA, USA) were used. II. Methods
(I) HPLC Analysis Conditions
1. Mobile phase (1) (for the analysis of cosmetics): CH3CN: H2O (70/30, v/v) with triethylamine (0.04%) and acetic acid (0.1%).
2. Mobile phase (2) (for the analysis of pharmaceuticals): CH3CN: H2O (90/10, v/v) with triethylamine (0.04%) and acetic acid (0.1%).
The solvents were mixed well, filtered through the Milli-Q purification system, and degassed for further use.
The flow rate was 1.0 mL/min. (II) Preparation of Standard Solutions 1. Stock Solutions (1)
An amount of 100 mg of benzalkonium chloride was weighed accurately and placed in a 100-mL volumetric flask. The content was dissolved in mobile phase (1) and diluted to mark, making a solution with a concentration of 1.0 mg/mL. Accordingly, 100 mg of a 20% solution of chlorhexidine glu-conate was taken, dissolved in mobile phase (1), and diluted to make a concentration of 0.20 mg/mL.
2. Stock Solutions (2)
Amounts of 100 mg each of domiphen bromide, ben-zethonium chloride, cetylpyridium chloride, and dequalini-um chloride were weighed separately and accurately in a 100-mL volumetric flask. Each solution was dissolved in methanol one by one, and diluted to mark to make a concen-tration of 1.0 mg/mL.
(III) Preparation of Standard Solutions
Five different concentrations of benzalkonium chloride and chlorhexidine gluconate solutions (Table 1) were pre-pared from stock solution (1). An amount of 20 µg/mL of dextromethorphan HBr, as an internal standard, was added to each solution. Accordingly, five different concentrations of domiphen bromide, benzethonium chloride, cetylpyridium chloride, and dequalinium chloride solutions (Table 1) were prepared from stock solutions (2). Each solution was supple-mented with 100 µg/mL propantheline HBr as an internal standard.
For HPLC analysis, 20 µL of each sample of the six pre-pared standard solutions (each in five different concentra-tions) was withdrawn and injected. Each sample was deter-mined with six replicates to obtain the average area ratio of spiked disinfectant to the internal standard. Finally, linear regression equations and correlation coefficients were obtained from plots of concentration vs. area ratio.
(IV) Intra- and Interday Tests
Three batches of each disinfectant in solutions were pre-Table 1. Linear regression equations obtained from the standard curves of six cationic disinfectants
Cationic Concentration of Regression
disinfectant standard solutions (µg/mL) equation r
2 Benzalkonium chloridea 10,20,30,40,50 Y = 0.02001X-0.00747 0.9997 Chlorhexidine gluconatea 2.0,4.0,6.0,8.0,10 Y = 0.9575X-0.3732 0.9999 Domiphen bromideb 20,50,100,150,200 Y = 0.00629X-0.00934 1.0000 Benzethonium chlorideb 20,50,100,150,200 Y = 0.00647X-0.01133 1.0000 Dequalinium chlorideb 20,50,100,150,200 Y = 0.01433X-0.01946 1.0000 Cetylpyridium chlorideb 20,50,100,150,200 Y = 0.00684X+0.00243 1.0000
pared and used to carry out intraday tests. The same proce-dure was repeated for 5 consecutive days to conduct the inter-day tests, and standard deviations (S.D.) and coefficients of variation (CV) were calculated (Table 2). The intraday and interday variations were used to test the precision of the method.
(V) Recovery Experiment 1. Cosmetics
(1) Recovery of Benzalkonium Chloride
An amount of 50 mg of tetramethylammonium chloride was carefully weighed and placed in a 25-mL volumetric flask, which contained 2.5 mL of distilled water. By adding CH3CN to mark, the concentration of the solution was exact-ly 0.20%. An amount of 0.40 g each of three different brands of shampoo were weighed and placed in a 10-mL volumetric flask. Then, 4 mL of 50 µg/mL benzalkonium chloride
stan-dard solution (spiked amount equivalent to 0.05% w/w), 4 mL of 0.2% tetramethylammonium chloride, and 200 µg of dextromethorphan HBr were added. Finally, mobile phase (1) was added to mark. The mixture was shaken for 1 minute to ensure complete dissolution. The solution was then cen-trifuged at 3000 rpm for 15 minutes. With 20 µL of the super-natant solution injected to HPLC, the recovery ratio of ben-zalkonium chloride was calculated from its peak-area to stan-dard (Abenzalkonium chloride/Ainternal standard) ratio by the obtained lin-ear equation.
(2) Recovery of Chlorhexidine Gluconate
A sample of 0.20 g facial cream was carefully weighed and placed in a 10-mL volumetric flask. Next, 4 mL of 25
µ g/mL chlorhexidine gluconate standard solution (spiked
amount equivalent to 0.05% w/w), 2 mL of 0.7% NaCl solu-tion, and 200 µ g of dextromethorphan HBr were added. Finally, mobile phase (2) was added to mark. The mixture was shaken for 1 minute, then transferred to a 15-mL glass
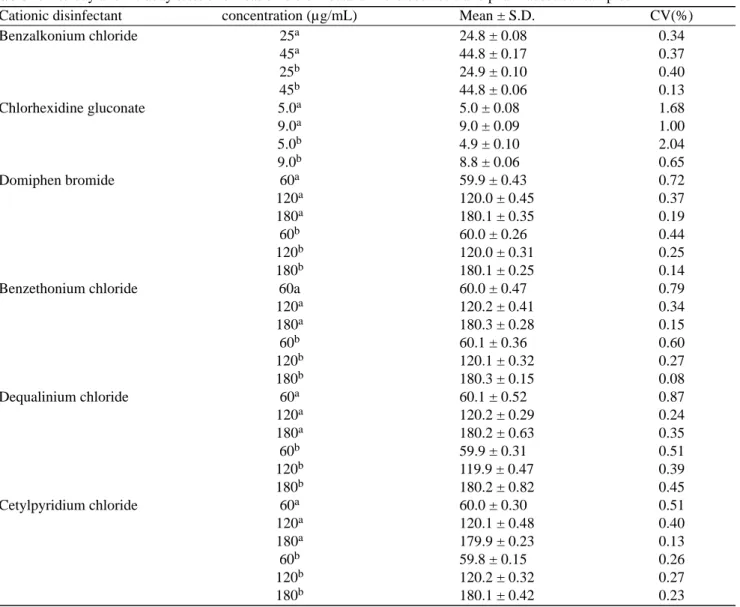
Table 2. Interday and intraday tests of six cationic disinfectans in the cosmetic and pharmaceutical samples
Cationic disinfectant concentration (µg/mL) Mean ± S.D. CV(%)
Benzalkonium chloride 25a 24.8 ± 0.08 0.34 45a 44.8 ± 0.17 0.37 25b 24.9 ± 0.10 0.40 45b 44.8 ± 0.06 0.13 Chlorhexidine gluconate 5.0a 5.0 ± 0.08 1.68 9.0a 9.0 ± 0.09 1.00 5.0b 4.9 ± 0.10 2.04 9.0b 8.8 ± 0.06 0.65 Domiphen bromide 60a 59.9 ± 0.43 0.72 120a 120.0 ± 0.45 0.37 180a 180.1 ± 0.35 0.19 60b 60.0 ± 0.26 0.44 120b 120.0 ± 0.31 0.25 180b 180.1 ± 0.25 0.14
Benzethonium chloride 60a 60.0 ± 0.47 0.79
120a 120.2 ± 0.41 0.34 180a 180.3 ± 0.28 0.15 60b 60.1 ± 0.36 0.60 120b 120.1 ± 0.32 0.27 180b 180.3 ± 0.15 0.08 Dequalinium chloride 60a 60.1 ± 0.52 0.87 120a 120.2 ± 0.29 0.24 180a 180.2 ± 0.63 0.35 60b 59.9 ± 0.31 0.51 120b 119.9 ± 0.47 0.39 180b 180.2 ± 0.82 0.45 Cetylpyridium chloride 60a 60.0 ± 0.30 0.51 120a 120.1 ± 0.48 0.40 180a 179.9 ± 0.23 0.13 60b 59.8 ± 0.15 0.26 120b 120.2 ± 0.32 0.27 180b 180.1 ± 0.42 0.23
powdered pharmaceutical samples with the active ingredi-ents equivalent to 1.0 mg were taken. After adding 7.0 mL of methanol, each sample was sonicated for 20 min. One mL of propantheline bromide with a concentration of 1.0 mg/mL was added as the internal standard. The samples were well mixed, sonicated, and centrifuged. Then, 20 µL each of the supernatant solutions was injected into HPLC for analysis. The percent recovery of each ingredient was calculated according to the peak-area to internal standard ratio. (2) Recovery of Benzethonium Chloride
The fourth sample containing benzethonium chloride was in the form of a lotion. An amount of active ingredient equivalent to 1.0 mg was taken and diluted with methanol to exactly 10 mL. One mL of propantheline bromide with a con-centration of 1.0 mg/mL was also added as the internal stan-dard. Then, 20 µL of each of the supernatant solutions was injected into HPLC for analysis. The percent recovery of the ingredient was calculated according to the peak-area to inter-nal standard ratio.
In an attempt to determine the contents of the above active ingredients which are added to marketed cosmetics and pharmaceutical preparations as sold in drugstores, a few samples were purchased at random and labeled with codes. By using our developed HPLC quantitation method, the amount of the active ingredient determined can be compared to the labeled content of the samples to calculate the percent detection.
RESULTS AND DISCUSSION
I. Analytical Conditions
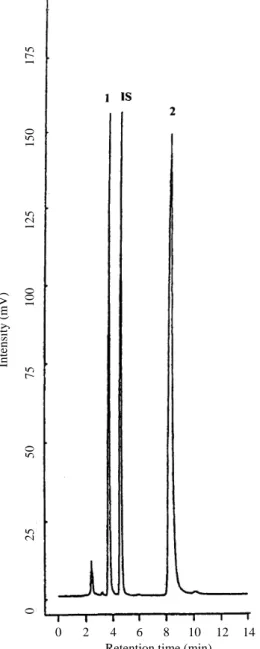
The cationic disinfectants were classified into two cate-gories using a µ-Porasil silica gel column (3.9 ×300 mm) for HPLC analysis: an aqueous mobile phase (1), composed of CH3CN: H2O (70/30, v/v), triethylamine (0.04%), and acetic acid (0.1%), with UV detection at 262 nm, benzalkonium chloride (1) and chlorhexidine gluconate (2) in cosmetics can be separated simultaneously. Compounds 1 and 2 were resolved and eluted at 3.74, and 8.26 min, respectively (Figure 1). The identification of two cationic disinfectants in each cosmetic sample can be achieved within 9 min with dex-tromethorphan HBr as the internal standard. With mobile phase (2) of CH3CN: H2O (90/10, v/v), triethylamine (0.04%), and acetic acid (0.1%), the constituents of domiphen bromide (3), benzethonium chloride (4), cetylpyridium chloride (5), and dequalinium chloride (6) in pharmaceutical samples can be identified at 269 nm simulta-neously. Compounds 3, 4, 5, and 6 were resolved at 8.47, 9.59, 11.4, and 15.3 min, respectively (Figure 2). When propantheline bromide was used as the internal standard, the quantitation of four cationic disinfectants in each pharmaceu-tical sample could be completed within 16 min.
II. Linearity and Limit of Detection tube for centrifugation at 3000 rpm for 15 minutes. For each
sample, 20 µL of the supernatant solution was injected to HPLC for analysis, and the recovery ratio of chlorhexidine gluconate was calculated from its peak-area to internal stan-dard (Achlorhexidine gluconate/ Ainternal standard) ratio by the obtained lin-ear equation.
2. Pharmaceuticals
(1) Recovery of Domiphen Bromide, Cetylpyridium Chloride, and Dequalinium Chloride
Twenty tablets containing domiphen bromide, or cetylpyridium chloride, or dequalinium chloride were taken and ground to a fine powder. Proper amounts of the three
Figure 1. HPLC chromatogram of two cationic disinfectants in cos-metics:
1. Benzalkonium chloride (conc. = 45 µg/mL). 2. Chlorhexidine gluconate (conc. = 3.0 µg/mL).
IS. Dextromethorphan HBr (conc. = 20 µg/mL) as the internal standard.
0 2 4 6 8 10 12 14
Retention time (min)
Intensity (mV) 0 2 5 5 0 7 5 100 125 150 175
Benzalkonium chloride in the concentration range from 10 to 50 µg/mL shows a good linear relationship with a relat-ed coefficient of r2 = 0.99973, and the limit of detection (LOD) is 2.0 µg/mL with signal/noise 5. Chlorhexidine gluconate in the range between 2.0 and 10 µg/mL also has a good linear relationship with a related coefficient, r2= 0.99993 (Table 1), and the LOD is 0.15 µg/mL. In the analy-sis of pharmaceuticals, the four compounds of domiphen bro-mide, benzethonium chloride, cetylpyridium chloride, and dequalinium chloride in the concentration range of 20~200
µg/mL exhibit good linear relationships, and with related
coefficients of r2= 0.99996~1.0000 (Table 1). The LOD for dequalinium chloride was 1.25 µg/mL; those for the other ingredients were all 2.0 µg/mL.
III. Precision and Accuracy
From the observed inter- and intraday data, the precision of this method is excellent, judging from the coefficients of variation (CV) for the cosmetics being 0.13%~2.04%, and
the CVs of pharmaceuticals being between 0.08% and 0.87% (Table 2).
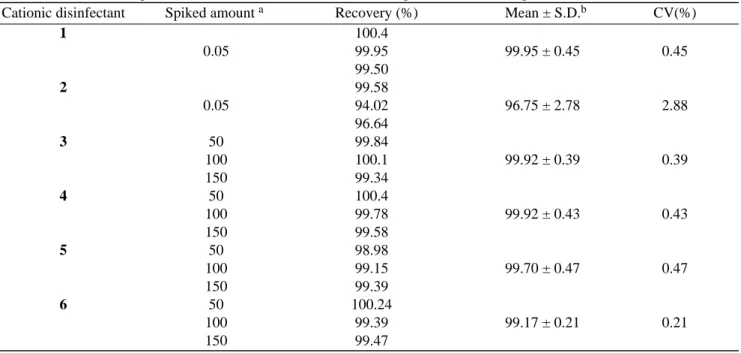
To estimate the percent recovery in cosmetics, a simula-tion method was used by which a standard solusimula-tion was added along with the internal standard solution to each sam-ple of the shampoo or facial cream. The average recovery of 1 was 99.95% among three samples of shampoo with a CV of 0.45%; the average recovery of 2 in three facial cream sam-ples was 96.75% with a CV of 2.88%. As for the pharmaceu-tical samples, the spiked amounts were all 50, 100, and 150
µg/mL of the respective ingredient. The average recoveries
of 3, 4, 5, and 6 were between 99.17% and 99.76% with CVs of 0.21%~0.47% (Table 3). The accuracy of the method, based on the above recovery tests, is also very satisfactory.
By applying our developed HPLC quantitation method to survey the contents of cationic disinfectants in marketed cosmetics (3 brands of shampoo and 3 facial cream marked with codes) and pharmaceutical preparations (3 brands of tablet and 1 lotion), the percent detections were found to be 94.02%~104.10% (Table 4).
Table 4. The content of six cationic disinfectants detected in marketed cosmetics and pharmaceuticals
Sample Code name Labeled ingredient/amount Amount detected Detection (%)
Cosmetics Shampoo A 1, 0.05a 0.05020 100.4 Shampoo B 0.05a 0.04998 99.95 Shampoo C 0.05a 0.04975 99.50 Facial Cream A 2, 0.05a 0.04978 99.58 Facial Cream B 0.05a 0.04701 94.02 Facial Cream C 0.05a 0.04832 96.64 Pharmaceuticals Tablet A 3, 0.5b 0.4851 97.02 Lotion A 4, 0.1c 0.1037 103.71 Tablet B 5, 1.0b 0.9901 99.01 Tablet C 6, 0.5b 0.5205 104.10 a% w/w; bmg/tablet; cmg/100g sample.
Table 3. Recoveries of spiked cationic disinfectants in cosmetic and pharmaceutical samples
Cationic disinfectant Spiked amount a Recovery (%) Mean ± S.D.b CV(%)
1 100.4 0.05 99.95 99.95 ± 0.45 0.45 99.50 2 99.58 0.05 94.02 96.75 ± 2.78 2.88 96.64 3 50 99.84 100 100.1 99.92 ± 0.39 0.39 150 99.34 4 50 100.4 100 99.78 99.92 ± 0.43 0.43 150 99.58 5 50 98.98 100 99.15 99.70 ± 0.47 0.47 150 99.39 6 50 100.24 100 99.39 99.17 ± 0.21 0.21 150 99.47
IV. Advantages of the Improved HPLC Method
The most common disadvantages of using reversed-phase chromatography to analyze amine compounds are peak tailing and it is time consuming. Bidlingmeyer et al. reported that many separations of lipophilic amines, which are very difficult on bonded reversed-phase packings, are easily accomplished with good peak symmetry on silica. The key to good peak symmetry is not the presence or absence of resid-ual silanols but more probably the assessibility of the surface groups. If surface silanols are freely assessible, there is good symmetry(7). In order to improve these possible disadvan-tages, the present study thus selected a silica gel column combined with an aqueous mobile phase for HPLC quantita-tion. The principle is similar to the ion exchange method, i.e., an ingredient must carry positive charge(s) for successful
detection, and thus can be isolated. The components in cos-metics are usually very complex; nonetheless, the non-ion-ized, or anionic compounds in the sample were indeed not retained, which eliminated disturbance to the cationic ingre-dients(8)present. Simultaneously, the chromatograms exhibit steady baselines of sharp and symmetrical signals with improved signal-to-noise ratio and very clean chro-matograms can be obtained. Additionally, the time consumed is not lengthy. Our developed HPLC method is able to com-plete the separation of all components in cosmetics within 9 minutes (Figure 1), while for pharmaceuticals, the overall time required was less than 16 minutes (Figure 2).
From the recovery tests of cosmetics, when benzalkoni-um chloride, 1, was added to tetramethylammonibenzalkoni-um chloride solutions, the samples were found to be less colloidlike. Benzalkonium chloride is easily dissolved in the mobile phase, which can then be separated from the undissolved
Figure 2. HPLC chromatogram of four cationic disinfectants in phar-maceuticals:
3. Domiphen bromide (conc. = 100 µg/mL). 4. Benzethonium chloride (conc. = 120 µg/mL). 5. Cetylpyridium chloride (conc. = 80 µg/mL). 6. Dequalinium chloride (conc. = 100 µg/mL).
IS. Propantheline bromide (conc. = 100 µg/mL) as the internal stan-dard.
0 2 4 6 8 10 12 14 16 18
Retention time (min)
Intensity (mV) 01 0 2 0 3 0 4 0 5 0
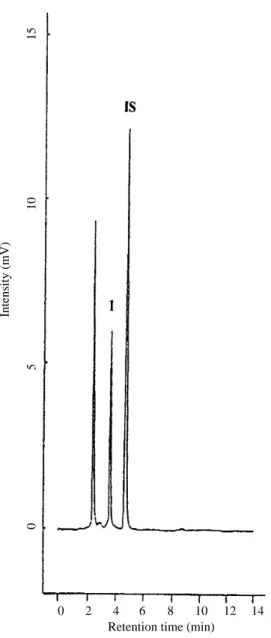
Figure 3. HPLC chromatogram of a cosmetic sample spiked with 1. Benzalkonium chloride (conc. = 20 µg/mL).
IS. Dextromethorphan HBr (conc. = 20 µg/mL) as the internal standard.
0 2 4 6 8 10 12 14
Retention time (min)
Intensity (mV)
0
5
10
vehicle of shampoo (Figure 3). Chlorhexidine gluconate car-ries a positive charge in neutral or weakly acidic media. On the contrary, if any sample carries a negative charge, a 0.7% NaCl solution can be added. The Na+ ions will attract the anions, which decreases the possibility of interaction between chlorhexidine gluconate and the anions(9). A typical HPLC chromatogram of 2 detected in a shampoo sample is shown in Figure 4. In the recovery of pharmaceuticals, the samples were dissolved in methanol, and the analyses pro-ceeded accordingly. The above analytical method gives satis-factory results no matter what kind of vehicle is used. The HPLC chromatograms of 3 and 6 detected in tablets are shown in Figures 5 and 6.
ACKNOWLEDGEMENTS
The authors thank Mr. Hwi-Chang Chen of the National Laboratories of Foods and Drugs, Department of Health,
Figure 4. HPLC chromatogram of a cosmetic sample spiked with 2. Chlorhexidine gluconate (conc. = 10 µg/mL).
IS. Dextromethorphan HBr (conc. = 20 µg/mL) as the internal standard. 0 2.5 5.0 7.5 10.0 12.5 15.0
Retention time (min)
Intensity (mV) 01 0 2 0 3 0 4 0
Figure 5. HPLC chromatogram of a tablet sample spiked with 3. Domiphen bromide (conc. = 100 µg/mL).
IS. Propantheline bromide (conc. = 100 µg/mL) as the internal stan-dard.
0 2 4 6 8 10 12 14 16
Retention time (min)
Intensity (mV) 01 0 2 0 3 0
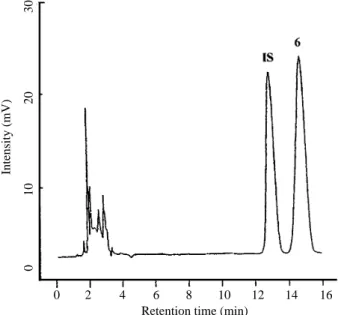
Figure 6. HPLC chromatogram of a tablet sample spiked with 6. Dequalinium chloride (conc. = 100 µg/mL).
IS. Propantheline bromide (conc. = 100 µg/mL) as the internal stan-dard.
0 2 4 6 8 10 12 14 16
Retention time (min)
Intensity (mV) 01 0 2 0 3 0
Executive Yuan, for his help in recalculation of some statisti-cal data.
REFERENCES
1. Department of Health, Executive Yuan, R.O.C. 1996. Standard for ingredient in medical cosmetics. The law for sanitary control of cosmetics. p. 48.
2. Harold, K. M. D. and Walter, H. E. R. 1989. Principles of Medical Pharmacology. pp. 595-603, McGraw-Hill.
Singapore.
3. Medlicott, N. J., Ferry, D. G., Tucker, I. G., Rathbone, M. J., Holborow, D. W. and Jones, D. S. 1994. High perfo-mance liquid chromatography of chlorhexidine in saliva film. J. Liquid Chromatogr. 17: 1605-1620.
4. Linares, P., Gutierrez, M. C., Lazaro, F., Luquedecastro, M. D. and Valcarcel, M. 1991. Determination of benzo-caine, dextromethorphan and cetylpyridinium ion by high-performance liquid chromatography with UV detec-tion. J. Chromatogr. 558: 147-153.
5. Meyer, R. C. and Takahashi, L. T. 1983. Analysis of cetylpyridium chloride in the polysaccharide, chondroitin sulfate, via high-performance liquid chromatography. J. Chromatogr. 280: 159-164.
6. Zarapkar, M. S. S., Salunkhe, B. B., Doshi, V. J., Rele, R. V. and Salunkhe, U. B. 1987. High performance liquid
chromatographic determination of dequalinium chloride from pharmaceutical preparation. Indian Drugs 26: 313-316.
7. Bidlingmeyer, B. A., Del Rios, J. K. and Korpi, J. 1982. Separation of organic amine compounds on silica gel with reversed-phase eluents. Anal. Chem. 54: 442-447. 8. Shi, R. J. Y., Gee, W. L. and Williams, R. L. 1987.
High-performance liquid chromatography assay for basic amine drugs in plasma and urine using a silica gel column and aqueous mobile phase. J. Liquid Chromatogr. 10: 3101-3112.
9. Stevens, L. E., Durrwachter, J. R. and Helton, D. O. 1986. Analysis of chlorhexidine sorption in soft contact lenses by catalytic oxidation of [14C]chlorhexidine and by liquid chromatography. J. Pharm. Sci. 75: 83-86.
1 2 3 1 4