QALE for Patients With Ischemic Stroke and
Intracerebral Hemorrhage
A 13-Year Follow-Up
Hsin-Yi Lee, PhD; Jing-Shiang Hwang, PhD; Jiann-Shing Jeng, MD, PhD; Jung-Der Wang, MD, ScD
Background and Purpose—Few studies have evaluated the long-term health impact of stroke as categorized into different subtypes. The aim of this study is to quantify the loss of quality-adjusted life expectancy related to ischemic stroke and intracerebral hemorrhage.
Methods—The hospital-based cohort, which consisted of 13 194 patients with first-ever stroke onset dates between 1995 and 2007, was classified into lacunar and nonlacunar infarctions and intracerebral hemorrhages. After linking with the National Mortality Registry, survival functions were determined and extrapolated over a 50-year period based on the survival ratio between the patients’ survival and age- and sex-matched reference population’s as calculated from the vital statistics of Taiwan. The survival functions were then multiplied by the quality of life assessed under the EuroQol 5-dimension (EQ-5D) questionnaire based on a sample of 486 patients with stroke.
Results—The quality-adjusted life expectancy for a patient with ischemic stroke was 8.7 quality-adjusted life-years with an average loss of 8.3 quality-adjusted life-years, and there appeared to be no difference between lacunar and nonlacunar infarctions. Patients with intracerebral hemorrhage had a similar quality-adjusted life expectancy as those with ischemic stroke but with a significantly greater loss relative to the reference population (14.1 quality-adjusted life-years) because of younger ages. Conclusion—The lifelong health burden due to stroke was approximately 9.5 quality-adjusted life-years and should be
considered in future cost-effectiveness analyses for prevention. (Stroke. 2010;41:739-744.) Key Words: infarction 䡲 intracerebral hemorrhage 䡲 quality-adjusted life-years
V
irtually all countries are faced with heavy financial burdens in providing health care, in part due to aging populations and technological change.1To keep the systemssustainable, the health outcomes achieved per dollar spent should be estimated and compared to increase the value for patients.2Outcome measures over the full cycle of care for a
medical condition should account for both survival and quality of life (QOL) in estimating quality-adjusted life expectancy (QALE). This goal can be accomplished by adjusting the survival function with mean QOL at each time point, t, and then summing the result across the patient’s entire lifetime as expressed in the following equation3– 6:
QALE⫽ 兰E 关Qol 共t/x兲兴 S 共t/x兲 dt
where S(t/x) denotes the survival function for condition x at time t and Qol(t/x) denotes the QOL function for condition x at time t.
Each year, approximately 5.7 million people worldwide die from stroke,7not to mention the millions more who are
left disabled. This figure may continue to rise unless the appropriate preventive actions can be effectively adminis-tered. The stroke Patient Outcomes Research Team (PORT) have made an important contribution on the cost-effective strategies for stroke prevention,8 which
re-lied on the Medicare claims and covered only the patients agedⱖ65 years.9This study was conducted to quantify the
lifelong quality-adjusted life-years (QALYs) that would be regained through the successful prevention of stroke based on a large representative cohort of patients. Because different subtypes of stroke may have different impacts on the mortality rate and QOL and may require different prevention strategies, we estimate the QALE and loss-of-QALE by subtype for comparison purposes.
Received November 19, 2009; accepted December 7, 2009.
From the Institute of Occupational Medicine and Industrial Hygiene (H.-Y.L.), College of Public Health, National Taiwan University, Taipei, Taiwan; the Institute of Statistical Science (J.-S.H.), Academia Sinica, Taipei, Taiwan; the Stroke Center and Department of Neurology (J.-S.J.), National Taiwan University Hospital, Taipei, Taiwan; and the Departments of Internal Medicine and Environmental and Occupational Medicine (J.-D.W.), National Taiwan University Hospital, Taipei, Taiwan.
Jung-Der Wang and Jiann-Shing Jeng contributed equally to this work.
Correspondence to Jung-Der Wang, Institute of Occupational Medicine and Industrial Hygiene, College of Public Health, National Taiwan University, Room 719, No. 17, Xu-Zhou Road, Taipei 10055, Taiwan. E-mail jdwang@ntu.edu.tw; and Jiann-Shing Jeng, MD, PhD, Stroke Center and Department of Neurology, National Taiwan University Hospital, No. 7 Chung San South Road, Taipei 10055, Taiwan. E-mail jsjeng@ntu.edu.tw.
© 2010 American Heart Association, Inc.
Stroke is available at http://stroke.ahajournals.org DOI: 10.1161/STROKEAHA.109.573543
Methods
Establishing the Stroke CohortThe primary data for this study were obtained from the stroke registry at the National Taiwan University Hospital (NTUH), which was established in 1995 to study the etiologic factors, clinical courses, prognoses, and complications of stroke.10,11 All patients
with a diagnosis of stroke from the Departments of Neurology, Neurosurgery, Internal Medicine, and Pediatrics were enrolled in the registry. The diagnosis of stroke and its subtypes was based on the clinical features and the data collected during laboratory examina-tions, including brain imaging, echocardiography, ultrasonography of extracranial and/or intracranial arteries, and angiography. The patients were divided into 3 subtypes: intracerebral hemorrhage (ICH), lacunar infarction (or small-artery occlusion), and nonlacunar infarction, which includes large-artery atherosclerosis, cardioembo-lism, acute stroke (of other determined etiology), and/or undeter-mined etiology. The diagnostic criteria of ischemic stroke were basically adopted from the Trial of Org 10172 in Acute Treatment (TOAST) classification system.12The diagnosis of ICH was made
when a brain parenchymal hemorrhage identified through brain imaging corresponded to clinical pictures. Subarachnoid hemorrhage was not included in this study. To determine the representativeness of this cohort, we also obtained the Database of Catastrophic Illness of the National Health Insurance during 1998 to 2007, which collected all registered patients with acute stroke for waiving copayment in Taiwan.
Extrapolation of Long-Term Survival for the Stroke Cohort After Culmination of the Follow-Up Period
After verifying the survival status of all cases through crossreferenc-ing with the National Mortality Registry at the end of the follow-up period (December 31, 2007), the Kaplan-Meier method was used to estimate the survival function based on the 1995 to 2007 follow-up data. The lifetime survival function was estimated by incorporating the life expectancy information of the general population into the estimation process.4 – 6,13The general concept is to assume that stroke
may produce an excess mortality that can be quantified from follow-ups of the cohort over a shorter period of time. If the additional mortality appears to be a constant hazard at the chronic stage, the long-term survival of this cohort can be projected from the available survival function for an age- and sex-matched reference population.4,5The lifetime survival function of this reference
popu-lation can be generated using the Monte Carlo method from the national vital statistics.5 This approach has been mathematically
proven13to be a valid method for predicting life expectancy, which
is also corroborated by real examples.14 –16The difference between
the QALE of patients with stroke and their age- and sex-matched referents is the expected loss-of-QALE for stroke.
QOL for Patients With Stroke
The QOL for the patients with stroke was estimated using the EuroQol 5-dimension (EQ-5D) questionnaire,17which encompasses
mobility, self-care, usual activities, pain/discomfort, and anxiety/ depression, with 3 levels of severity (no problems, moderate prob-lems, and severe problems). The health state vector from the 5 dimensions was transformed into a utility value using the scoring functions from the United States18and the United Kingdom.19The
utility was further rescaled to lie on the interval, [0,1], in which 1 indicates full health. We invited consecutive patients hospitalized in the rehabilitation ward in addition to outpatients from the neurology department to participate in our survey from September 2008 to June 2009. The inclusion criterion was that the subject had to be able to independently understand and answer the questions on the EQ-5D survey.
The average QOL function was estimated by kernel-smoothing the data of a random sample from a cross-sectional survey of QOL on the living individuals.4For each duration to date, namely, the time
elapsed since the first stroke, the average utility value of surviving
patients was multiplied with the survival rate of the cohort, whereas the utility for all hypothetical referents was assumed to be 1 throughout the survival period. It has been suggested that a random sample of 50 in size is the minimal requirement to establish the mean QOL function curve through time.4The study was approved by the
Institutional Review Board of the NTUH before starting, and every interviewed patient provided written informed consent.
Estimation of QALE
After the lifetime survival functions of the patients with stroke had been obtained, they were adjusted by the corresponding QOL function consistent with the duration beginning with the occurrence of the stroke to calculate a QALE based on a 13-year follow-up period with 50 years of extrapolation. During the extrapolation of the survival curve beyond the follow-up period, the slope of projection was determined by the logit transformation of the ratio between the survival functions of stroke cohort and the reference population. For each patient of the stroke cohort, 10 age- and sex-matched referents were generated using Monte Carlo method from the vital statistics of Taiwan.5The sampling and estimation procedures were repeated 30
times to obtain 30 projected estimates of survival time and the SEs of the estimates. To facilitate this computation, we used a software program (MC-QAS) that was built using the R statistical package, which can be freely downloaded (www.stat.sinica.edu.tw/jshwang). The validity of our extrapolation for long-term survival using this statistics package has been validated in previously published studies.13–15
Validation of the Monte Carlo Extrapolation
The validation of the Monte Carlo extrapolation for stroke popula-tions was performed on the subcohort of the stroke registry that included patients diagnosed between 1995 and 2000. Assuming that those patients were only followed until the end of 2000, we extrapolated the survival data through the end of 2007 using the Monte Carlo method. Because this subcohort was actually followed until the end of 2007, the true life expectancy within the 13-year follow-up calculated with the Kaplan-Meier method can be consid-ered the gold standard. The relative biases were computed to compare the differences in values between the Kaplan-Meier esti-mates and the Monte Carlo extrapolation method.
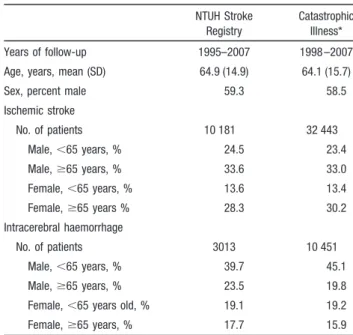
Table 1. Demographic Characteristics for NTUH Stroke Registry (nⴝ13 194) and Those Registered in the Database of Catastrophic Illness of Taiwan (nⴝ42 894)
NTUH Stroke Registry
Catastrophic Illness* Years of follow-up 1995–2007 1998 –2007 Age, years, mean (SD) 64.9 (14.9) 64.1 (15.7)
Sex, percent male 59.3 58.5
Ischemic stroke No. of patients 10 181 32 443 Male,⬍65 years, % 24.5 23.4 Male,ⱖ65 years, % 33.6 33.0 Female,⬍65 years, % 13.6 13.4 Female,ⱖ65 years % 28.3 30.2 Intracerebral haemorrhage No. of patients 3013 10 451 Male,⬍65 years, % 39.7 45.1 Male,ⱖ65 years, % 23.5 19.8 Female,⬍65 years old, % 19.1 19.2 Female,ⱖ65 years, % 17.7 15.9
Results
A total of 13 194 patients with a first-ever stroke was collected in the NTUH stroke registry, which appeared to be comparable with the 42 894 subjects with stroke registered by the Database of Catastrophic Illness (Table 1). Within the stroke registry group, patients with ICH were younger than those with lacunar or nonlacunar infarction. The 5-year survival rate of the whole cohort was 63.0%, whereas the patients with infarction had a better survival rate (64%) than
those with ICH (57.3%). After 13-year follow-up, the overall survival rate dropped to 34.1%.
During the EQ-5D survey, if the patients were considered to have conscious disturbance, moderate to severe dementia, or aphasia based on the judgment of one experienced physi-cian of the Department of Neurology of the NTUH, they were not interviewed. In fact, none of the eligible patients refused to answer the EQ-5D, because the Stroke Center in the NTUH has gained a full trust from patients after 13 years of
Table 2. Characteristics of the EQ-5D-Interviewed Cases and the Estimated Life Expectancy Categorized in Terms of Stroke Type
Characteristics Overall (n⫽486) Lacunar Infarction (n⫽170) Nonlacunar Infarction (n⫽263) ICH (n⫽53) EQ-5D-interviewed cases
Age, years, mean (SD) 64.8 (12.2) 67.7 (10.4) 63.7 (13.1) 61.3 (11.1)
Male, % 63.4 62.9 63.5 64.2
Time elapsed since the first stroke, years, mean (SD) 4.3 (4.2) 5.1 (4.2) 4.0 (4.1) 3.7 (4.4) Utility score by US function
Mean (SD) 0.8 (0.3) 0.8 (0.2) 0.7 (0.3) 0.6 (0.3)
Median 0.8 0.9 0.8 0. 7
Minimal/maximum 0.1/1.0 0/1.0 0/1.0 0/1.0
Utility score by UK function
Mean (SD) 0.8 (0.3) 0.9 (0.2) 0.8 (0.3) 0.7 (0.3) Median 0.9 0.9 0.9 0.8 Minimal/maximum 0/1.0 0.1/1.0 0/1.0 0/1.0 Mobility dimension, % No problems 63.8 76.5 59.3 45.3 Some problems 31.5 20.0 35.7 47.2 Confined to bed 4.7 3.5 4.9 7.5 Self-care dimension, % No problems 72.0 85.9 68.1 47.2 Some problems 18.5 11.2 19.4 37.7 Unable to wash/dress 9.5 2.9 12.5 15.1
Usual activities dimension, %
No problems 64.0 78.8 58.6 43.4 Some problems 23.0 17.1 26.6 24.5 Unable to perform 13.0 4.1 14.8 32.1 Pain/discomfort dimension, % None 48.1 57.6 43.0 43.4 Moderate 40.5 38.2 43.0 35.8 Extreme 11.3 4.1 14.1 20.8 Anxiety/depression dimension, % None 54.5 64.1 49.8 47.2 Moderate 33.5 28.2 36.9 34.0 Extreme 11.9 7.6 13.3 18.9
Life expectancy, years, mean (SE) 10.8 (0.3) 9.9 (0.4) 11.5 (0.5) 10.7 (0.7) Loss relative to referents, years 7.3 7.1 5.5 11.4 QALE using utility scored by US function* (SE) 8.6 (0.2) 8.4 (0.4) 8.7 (0.5) 8.0 (0.6)
Loss relative to referents 9.5 8.5 8.3 14.1
QALE using utility scored by UK function* (SE) 9.1 (0.3) 8.8 (0.4) 9.4 (0.3) 7.6 (0.8)
Loss relative to referents 9.0 8.2 7.6 14.5
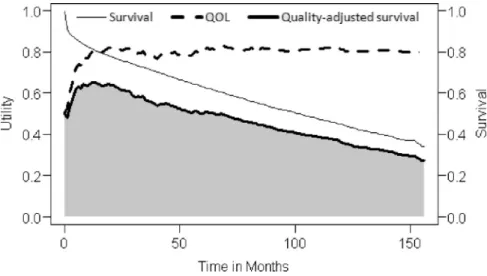
operation. In total, the EQ-5D questionnaire was successfully completed by 486 patients. The demographic characteristics of the interviewed subjects and their responses on the EQ-5D are summarized in Table 2. The lacunar infarction cohort was older but exhibited a higher utility score compared with the other subtypes (P⬍0.001). Overall, patients tended to report more problems for pain/discomfort and anxiety/depression. Figure 1 depicts the estimated survival, average utility score, and the quality-adjusted survival function for the patients with stroke. The average utility scores were usually lower in the initial months and then slowly increased to a stable level. The average life expectancy of a patient with stroke was estimated to be 10.8 years (Table 2). The patients with nonlacunar infarction seemed to have the longest life expect-ancy (11.5 years) followed by those with ICH (10. 7 years) and lacunar infarction (9.9 years). The average QALE of a patient with stroke was estimated to be 8.6 QALYs, and the loss-of-QALE relative to the age- and sex-matched reference population was 9.5 QALYs. The corresponding estimates appeared similar when the utility values were replaced by the UK function. When stratified by stroke subtypes, a nonsig-nificant difference was found between patients with lacunar and nonlacunar infarctions in terms of QALE and the
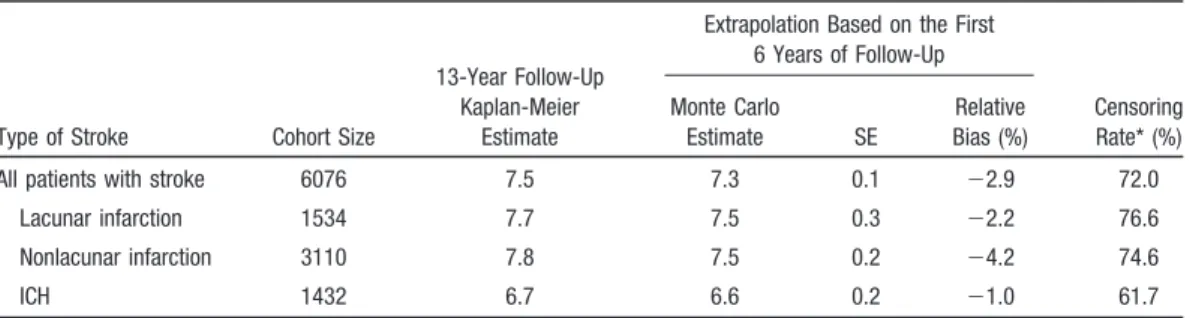
loss-of-QALE. Patients with ICH seemed to have similar QALE as patients with infarction but with a significantly greater loss of 14.1 QALYs. As illustrated in Figure 2, the quality-adjusted survival function of the referents matched for pa-tients with ICH was generally higher than that of the referents matched for patients with infarction and this resulted in a greater gap between the index population and the referents. Table 3 presented the relative biases for the estimates of Monte Carlo extrapolation. Although the censoring rates were ⱖ61.7%, the relative biases ranged between ⫺4.2% and ⫺1.0%.
Discussion
Previous studies have tried to estimate the overall disease burden of stroke using the unit of the disability-adjusted life-year.20 However, these studies failed to stratify the
subtypes of stroke or calculate the disability-adjusted life-year by taking into consideration any health impacts of QOL other than physical domain. Muening and Gold also indirectly estimated the total QALYs lost based on the national life table together with the utility value proposed by the National Centre for Health Statistics.21 However, they too failed to
stratify their cohort by subtype. To the best of our knowledge,
Figure 1. The survival probability,
aver-age QOL score, and quality-adjusted survival of patients with stroke. The shaded area represents the expected cumulative QALE over the 13 years of follow-up.
Figure 2. Quality-adjusted survival
prob-abilities of patients with stroke and the reference populations matched by age and sex.
this study is the first to quantify the loss-of-QALE of an average patient with different stroke subtypes through direct integration of survival and QOL functions as measured from actual cohorts. This study had the advantages of a large cohort, 13 years of follow-up, and probably representative of all of the patients with stroke in Taiwan (Table 1); in turn, the relative biases of the extrapolation method based on 6 years of data to project 7 years out were all ⬍5%. Also, the logit-transformed survival ratio in the analysis appeared to be consistent with the assumption of a constant hazard, which corroborates the results of other studies.22,23Thus, we
tenta-tively concluded that our estimation of the lifetime survival function of patients with stroke is valid and acceptable. Nonetheless, the sample size of EQ-5D survey is not suffi-ciently large for further stratification of QALE by age and sex within each subtype of stroke. Future study with a larger sample size of a QOL survey would be useful to more accurately determine the age- and/or sex-specific QALE of stroke.
Although the EQ-5D data were collected over a wide timeframe to capture the trend of QOL from the acute to chronic stage, several limitations still existed. First, the mean utility value reported by our sample (0.8) appeared to be higher than those in other studies.24 –26Overall, our sampled
patients tended to report fewer problems in dimensions of mobility, self-care, and usual activities than those surveyed 6 months after stroke by Pickard et al,26 whereas the
dimen-sions of pain/discomfort and anxiety/depression were similar. Such a difference might be attributed to the fact that we were unable to invite patients with cognitive impairments to fill in the EQ-5D questionnaire. Because cognitive deficits may contribute to dependence of care and a reduced QOL score,27
we assume that the nonparticipants probably would have exhibited lower QOL utilities, and the loss-of-QALE estimate would then have been a more conservative estimate. Second, because the utility score of the reference population was assumed to be 1, whereas the general population usually includes some people with illnesses, it might lead to a slight overestimation in the calculation of loss-of-QALE due to stroke. Third, during the lifetime extrapolation of QOL function, it was assumed that the patients continued to stay at the level of QOL as near the end of follow-up. Such assumption could have resulted in an overestimation because the real QOL might gradually decline along with aging.28 –30
Fourth, the EQ-5D may be unable to reflect all the QOL changes affected by stoke such as dexterity, speech, cogni-tion, and so on. Future studies to adjust the survival function by QOL measured through a more comprehensive tool, for example, Health Utilities Index Mark 3,31would be useful for
comparison and sensitivity analysis. Moreover, survival func-tion can also be adjusted with psychometric scores to obtain score time for comparative effectiveness research.6,32 Later
on, correlations between utility or psychometric measure-ments and different condition-specific tools such as Wolf Motor Function test can also be established to facilitate the rehabilitation of patients with stroke.33
The 5-year survival rates in our cohorts appeared compa-rable to those reported in Japan34 of 61% and 55% for
infarction and ICH, respectively. However, the 5-year sur-vival rate of lacunar infarction in this study was 63.6%, which seemed slightly lower than those reported in a recent review, 62% to 83%.35 Future studies of comparative effectiveness
research may be helpful to further improve the quality of care in Taiwan.
The present study indicated that, on average, a patient may lose 7.3 years of life expectancy or 9.5 QALYs as a result of stroke. The sensitivity analysis of applying both sets of utility values from the US and UK scoring functions seemed to yield a difference in estimates of less than 0.7 QALY. In other words, the health impact of a stroke is nearly equal to 10 years of life expectancy for an individual in perfect health, which is close to the loss caused by a head injury (10.7 QALYs) in a nonhelmeted motorcyclist.16 Although ICH
might lead to worse outcomes during the first year of follow-up,36our results suggest that ICH and infarction may
well involve similar life expectancies in the long run, a conclusion that is in agreement with a previous report involving 15 years of follow-up.22 However, the expected
lifetime loss of utility from ICH was found to be 5 QALYs more than that from infarctions, which can be attributable to the younger age of onset of ICH (Table 1). On the other hand, we found no significant difference in the predicted life expectancy and QALE between lacunar and nonlacunar infarctions. Recent reviews also concluded that the favorable prognosis, in terms of survival and disability, for patients with lacunar infarctions as compared with those with nonla-cunar infarctions was only evident during the initial several years.35,37
Table 3. Estimates of Mean Survival Durations in 13 Years of Follow-Up Using the Monte Carlo Method on the First 6 Years of Follow-Up Data Compared Using Kaplan-Meier Estimates Based on the Full 13 Years of Follow-Up
Type of Stroke Cohort Size
13-Year Follow-Up Kaplan-Meier
Estimate
Extrapolation Based on the First 6 Years of Follow-Up Censoring Rate* (%) Monte Carlo Estimate SE Relative Bias (%)
All patients with stroke 6076 7.5 7.3 0.1 ⫺2.9 72.0
Lacunar infarction 1534 7.7 7.5 0.3 ⫺2.2 76.6
Nonlacunar infarction 3110 7.8 7.5 0.2 ⫺4.2 74.6
ICH 1432 6.7 6.6 0.2 ⫺1.0 61.7
Despite recent advances in stroke treatment, many scholars still consider prevention the most effective means of reducing the overall burden of stroke.38 This study has successfully
estimated the expected loss-of-QALE due to stroke, in terms of QALY gained by prevention with regard to different stroke subtypes, but we have not estimated healthcare costs of stroke. Future studies could also include the total costs identified in different prevention and management programs to obtain actionable incremental cost-effectiveness ratios for decisions concerning health service resource allocations.
Sources of Funding
Financial support for this study was provided by grants from the National Science Council, Taiwan (NSC 98-2811-B-002-085 and NSC 96-2628-B-002-071-MY3).
Disclosures
None.
References
1. Mechanic D, Rochefort DA. Comparative medical systems. Annu Rev
Socio. 1996;22:239 –270.
2. Porter ME. A strategy for health care reform—toward a value-based system. N Engl J Med. 2009;361:109 –112.
3. Glasziou PP, Cole BF, Gelber RD, Hilden J, Simes RJ. Quality adjusted survival analysis with repeated quality of life measures. Stat Med. 1998; 17:1215–1229.
4. Hwang JS, Tsauo JY, Wang JD. Estimation of expected quality adjusted survival by cross-sectional survey. Stat Med. 1996;15:93–102. 5. Hwang JS, Wang JD. Monte Carlo estimation of extrapolation of
quality-adjusted survival for follow-up studies. Stat Med. 1999;18:1627–1640. 6. Hwang JS, Wang JD. Integrating health profile with survival for quality
of life assessment. Qual Life Res. 2004;13:1–14.
7. World Health Organization. Fact Sheet No. 310, 2004: The Top Ten
Causes of Death. Geneva: World Health Organization; 2008.
8. Matchar DB, Samsa GP. Secondary and Tertiary Prevention of Stroke:
Patient Outcomes Research Team (PORT) Final Report—Phase 1.
Rockville, MD: Agency for Healthcare Research and Quality; 2000. 9. Lipscomb J, Ancukiewicz M, Parmigiani G, Hasselblad V, Samsa G,
Matchar DB. Predicting the cost of illness: a comparison of alternative models applied to stroke. Med Decis Making. 1998;18:S39 –S56. 10. Jeng JS, Lee TK, Chang YC, Huang ZS, Ng SK, Chen RC, Yip PK.
Subtypes and case-fatality rates of stroke: a hospital-based stroke registry in Taiwan (SCAN-IV). J Neurol Sci. 1998;156:220 –226.
11. Yip PK, Jeng JS, Lee TK, Chang YC, Huang ZS, Ng SK, Chen RC. Subtypes of ischemic stroke: a hospital-based stroke registry in Taiwan (SCAN-IV). Stroke. 1997;28:2507–2512.
12. Adams HP, Bendixen BH, Kappelle LJ, Biller J, Love BB, Gordon DL, Marsh EE. Classification of subtype of acute ischemic stroke. Definitions for use in a multicenter clinical trial. TOAST. Trial of Org 10172 in Acute Stroke Treatment. Stroke. 1993;24:35– 41.
13. Fang CT, Chang YY, Hsu HM, Twu SJ, Chen KT, Lin CC, Huang LY, Chen MY, Hwang JS, Wang JD, Chuang CY. Life expectancy of patients with newly-diagnosed HIV infection in the era of highly active antiret-roviral therapy. QJM. 2007;100:97–105.
14. Ho JJ, Hwang JS, Wang JD. Estimation of reduced life expectancy from serious occupational injuries in Taiwan. Accid Anal Prev. 2006;38: 961–968.
15. Chu PC, Wang JD, Hwang JS, Chang YY. Estimation of life expectancy and the expected years of life lost in patients with major cancers: extrap-olation of survival curves under high-censored rates. Value Health. 2008; 11:1102–1109.
16. Lee HY, Chen YH, Chiu WT, Hwang JS, Wang JD. Quality-adjusted life-years and helmet use among motorcyclist sustaining head injury.
Am J Public Health. 2010;100:165–170.
17. EuroQol Group. EuroQol: a new facility for the measurement of health-related quality of life. Health Policy. 1990;16:199 –208.
18. Shaw JW, Johnson JA, Coons SJ. US valuation of the EQ-5D health states: development and testing of the D1 valuation model. Med Care. 2005;43:203–220.
19. Dolan P. Modeling valuations for EuroQol health states. Med Care. 1997;35:1095–1108.
20. Lawes CM, Vander Hoorn S, Rodgers A. Global burden of blood-pressure-related disease, 2001. Lancet. 2008;371:1513–1518.
21. Muennig PA, Gold MR. Using the years-of-healthy-life measure to cal-culate QALYs. Am J Prev Med. 2001;20:35–39.
22. Bronnum-Hansen H, Davidsen M, Thorvaldsen P. Long-term survival and causes of death after stroke. Stroke. 2001;32:2131–2136.
23. Hankey GJ, Jamrozik K, Broadhurst RJ, Forbes S, Burvill PW, Anderson CS, Stewart-Wynne EG. Five-year survival after first-ever stroke and related prognostic factors in the Perth Community Stroke Study. Stroke. 2000;31:2080 –2086.
24. Grootendorst P, Feeny D, Furlong W. Health Utilities Index Mark 3: evidence of construct validity for stroke and arthritis in a population health survey. Med Care. 2000;38:290 –299.
25. Mathias SD, Bates MM, Pasta DJ, Cisternas MG, Feeny D, Patrick DL. Use of the Health Utilities Index with stroke patients and their caregivers.
Stroke. 1997;28:1888 –1894.
26. Pickard AS, Johnson JA, Feeny DH, Shuaib A, Carriere KC, Nasser AM. Agreement between patient and proxy assessments of health-related quality of life after stroke using the EQ-5D and Health Utilities Index.
Stroke. 2004;35:607– 612.
27. Haacke C, Althaus A, Spottke A, Siebert U, Back T, Dodel R. Long-term outcome after stroke evaluating health-related quality of life using utility measurements. Stroke. 2006;37:193–198.
28. Fryback DG, Dunham NC, Palta M. US norms for six generic health-related quality-of-life indexes from the National Health Measurement Study. Med Care. 2007;45:1162–1170.
29. Luo N, Johnson JA, Shaw JW, Feeny D, Coons SJ. Self-reported health status of the general adult US population as assessed by the EQ-5D and Health Utilities Index. Med Care. 2005;43:1078 –1086.
30. Orpana HM, Ross N, Feeny D, McFarland B, Bernier J, Kaplan M. The natural history of health-related quality of life: a 10-year cohort study.
Health Reports. 2009;20:1–7.
31. Feeny D, Furlong W, Boyle M, Torrance GW. Multi-attribute health status classification systems. Health Utilities Index. Pharmacoeconomics. 1995;7:490 –502.
32. Hsu C, Wang JD, Hwang JS. Survival-weighted health profile for long-term survivors of acute myelogenous leukemia. Qual Life Res. 2003;12:503–517.
33. Wolf SL, Winstein CJ, Miller JP. Retention of upper limb function in stroke survivors who have received constraint-induced movement therapy: the EXCITE randomised trial. Lancet Neurol. 2007;7:33– 40. 34. Kubo M, Kiyohara Y, Kato I. Trends in the incidence, mortality, and
survival rate of cardiovascular disease in a Japanese community: the Hisayama study. Stroke. 2003;34:2349 –2354.
35. Norrving B. Long-term prognosis after lacunar infarction. Lancet Neurol. 2003;2:238 –245.
36. Jorgensen HS, Nakayama H, Raaschou HO, Olsen TS. Intracerebral hemorrhage versus infarction: stroke severity, risk factors, and prognosis.
Ann Neurol. 1995;38:45–50.
37. Jackson C, Sudlow C. Comparing risks of death and recurrent vascular events between lacunar and non-lacunar infarction. Brain. 2005;128: 2507–2517.
38. World Health Organization. Integrated Management of Cardiovascular
Risk: Report of a WHO Meeting. Geneva: World Health Organization;