Editorial Manager(tm) for Clinical Oral Investigations Manuscript Draft
Manuscript Number: CLOI-D-10-00345R2
Title: Effects of Orthodontic Tooth Movement on Alveolar Bone Density Article Type: Original Article
Corresponding Author: Jui-Ting Hsu, Ph.D. Corresponding Author's Institution: First Author: Hsing-Wen Chang
Order of Authors: Hsing-Wen Chang;Heng-Li Huang, Ph.D.;Jian-Hong Yu, Ph.D.;Jui-Ting Hsu, Ph.D.;Yu-Fen Li, Ph.D.;Yi-Fan Wu
Abstract: Objectives: The object of this study was to evaluate the relationship between changes in the alveolar bone density around the teeth and the direction of tooth movement by using cone-beam computed tomography (CBCT).
Materials and Methods: CBCT was used to measure the bone densities around six maxilla anterior teeth before and after 7 months of orthodontic treatment in eight patients. Each root was divided into three levels (cervical, intermediate, and apical) to determine whether the bone-density change varied with the tooth level. Moreover, each level was divided into four regions (palatal, distal, mesial, and buccal sides). Three-dimensional computer models of the maxilla before and after orthodontic treatment were created to detect the direction of tooth movement. The percentage for all 144 samples [8 (patients) × 6 (teeth) × 3 (levels)] in which the side (palatal, distal, mesial, or buccal sides) of maximum bone density reduction (before and after orthodontic treatment) coincided with the direction of tooth movement was calculated; this was referred to as the "coincidence percentage". Results: The bone density around the teeth reduced by 24.3±9.5%. The average coincidence percentage for the eight patients was 59.0%. The coincidence percentages for the 8 patients were 62.5%, 62.5%, and 52.1% at the cervical, intermediate, and apical levels, respectively.
Conclusions: The obtained results demonstrate that the direction of tooth movement is associated with the side of maximum bone density reduction, and that CBCT is a useful approach for evaluating bone density changes around teeth induced by orthodontic treatment.
Clinical Relevance: CBCT can be used to detect changes in the alveolar bone density around teeth. In addition, the maximum reduction in bone density may be predicted based on the direction of tooth movement, which may represent important information for clinicians planning treatment procedures.
Cover letter
Thank you for the reviewer’s comments and suggestions. The manuscript has been revised based on the comment of the reviewer; all changes are in boldface and underlined in the revised version of the manuscript. In addition, the Abstract has been restructured based on the “Instructions for authors”. Below we respond to the reviewer comments on a point-by-point basis.
Reviewers' comments:
Reviewer #2: I suggest three changes for ameliorating this manuscript:
In abstract, discussion and in conclusion: The obtained results demonstrate that the side of maximum bone density reduction is associated with the direction of tooth movement. Since you have not performed a correlation/regression analysis it is better to write associated instead of correlated and more prudent to avoid use of "strong". Furthermore, you can consider switching as proposed above.
Reply:
Thank you for this comment. We have modified the manuscript accordingly.
In statistical analysis: the first sentences in both sections are written as results. Consider to move these sentences to the Result Section. Start with the percentage of the 144?.In the second part: The coincidence percentages were calculated in all 144 samples and separately at the apical, intermediate, and cervical levels. Furthermore, the coincidence percentages were calculated separately for the buccal, palatal, mesial, and distal sides for all teeth and for the samples where the movements were larger than 0.5mm.
Reply:
We had included these sentences in both sections since we thought this would make it easier for readers to understand our study during the first read-through. While we have modified some descriptions in the revised manuscript, we still prefer to keep the original construction since the other two reviewers did not consider this arrangement to be unsuitable. However, we are willing to further modify the structure if the reviewer still considers it to be unsuitable.
In the discussion: Consider to start: The experimental results showed??consistent with the hypothesis. This statement comes rather late at the bottom of page 13.
Reply:
Thank you for this suggestion. We have moved the former part of the seventh paragraph (at the bottom of page 13 in the original version) to the first Authors' Response to Reviewers' Comments
paragraph of the Discussion in the revised version.
Reviewer #3: In Materials & Methods: replace the last 3 sentences "All of the patients received ... receiving any medication" by "All patients received nonextraction orthodontic treatment. They did not receive any periodontal supportive therapy during the treatment, they were all healthy and none of them was receiving any medication."
Reply:
1
Effects of Orthodontic Tooth Movement on Alveolar Bone Density
Hsing-Wen Chang1, Heng-Li Huang1, Jian-Hong Yu1,2 Jui-Ting Hsu1*, Yu-Fen Li3, Yi-Fan Wu2
1
School of Dentistry, College of Medicine
China Medical University and Hospital, Taichung, Taiwan, 404, ROC
2
Department of Dentistry
China Medical University and Hospital, Taichung, Taiwan, 404, ROC
3
Biostatistics Center and Department of Public Health, China Medical University and Hospital, Taiwan, 404, ROC
Corresponding author:
Jui-Ting Hsu, Associate Professor
School of Dentistry, College of Medicine, China Medical University 91 Hsueh-Shih Road, Taichung 40402 Taiwan
Tel. 886-4-22053366 ext. 2308 Fax. 886-4-22014043
E-mail address: [email protected]; [email protected]
Manuscript
Click here to download Manuscript: 20110307 (COI) Effects of Orthodontic Tooth Movement on Alveolar Bone Density.docClick here to view linked References
1 2 3 4 5 6 7 8 9 10 11 12 13 14 15 16 17 18 19 20 21 22 23 24 25 26 27 28 29 30 31 32 33 34 35 36 37 38 39 40 41 42 43 44 45 46 47 48 49 50 51 52 53 54 55 56 57 58 59 60 61 62
2
Abstract
Objectives: The object of this study was to evaluate the relationship between changes in the alveolar bone density around the teeth and the direction of tooth movement by using cone-beam computed tomography (CBCT).
Materials and Methods: CBCT was used to measure the bone densities around six maxilla anterior teeth before and after 7 months of orthodontic treatment in eight patients. Each root was divided into three levels (cervical, intermediate, and apical) to determine whether the bone-density change varied with the tooth level. Moreover, each level was divided into four regions (palatal, distal, mesial, and buccal sides). Three-dimensional computer models of the maxilla before and after orthodontic treatment were created to detect the direction of tooth movement. The percentage for all 144 samples [8 (patients) 6 (teeth) 3 (levels)] in which the side (palatal, distal, mesial, or buccal sides) of maximum bone density reduction (before and after orthodontic treatment) coincided with the direction of tooth movement was calculated; this was referred to as the ―coincidence percentage‖.
Results: The bone density around the teeth reduced by 24.39.5%. The average coincidence percentage for the eight patients was 59.0%. The coincidence percentages for the 8 patients were 62.5%, 62.5%, and 52.1% at the cervical, intermediate, and apical levels, respectively.
Conclusions: The obtained results demonstrate that the direction of tooth movement is associated with the side of maximum bone density reduction, and that CBCT is a useful approach for evaluating bone density changes around teeth induced by orthodontic treatment.
Clinical Relevance: CBCT can be used to detect changes in the alveolar bone density around
teeth. In addition, the maximum reduction in bone density may be predicted based on the
direction of tooth movement, which may represent important information for clinicians
1 2 3 4 5 6 7 8 9 10 11 12 13 14 15 16 17 18 19 20 21 22 23 24 25 26 27 28 29 30 31 32 33 34 35 36 37 38 39 40 41 42 43 44 45 46 47 48 49 50 51 52 53 54 55 56 57 58 59 60 61 62
3
planning treatment procedures.
Keywords: cone-beam computed tomography; orthodontic tooth movement; bone density 1 2 3 4 5 6 7 8 9 10 11 12 13 14 15 16 17 18 19 20 21 22 23 24 25 26 27 28 29 30 31 32 33 34 35 36 37 38 39 40 41 42 43 44 45 46 47 48 49 50 51 52 53 54 55 56 57 58 59 60 61 62
4
Introduction
The purposes of orthodontic therapy are to establish a good occlusion, enhance the health of the periodontium, and improve dental and facial esthetics. Changes in the external appearance between before and after orthodontic treatment, such as to the facial profile and the alignment of the teeth, are easy to observe. However, physiology changes such as to the alveolar bone density and soft tissue are difficult to identify. Most of the previous studies related to the tissue reaction of orthodontic treatment focused on the periodontal ligament (PDL) using histology approaches in animal models [1,2]. Few studies have investigated the biomechanical response of alveolar bone during orthodontic tooth movement [3-5].
In general, the bone reaction to orthodontic tooth movement is described using the two terms ―modeling‖ and ―remodeling‖. However, these two terms are sometimes confused by orthodontists [6]. Basically, ―modeling‖ is the sculpting mechanism that uses the raw material of bone growth to shape structures, whereas ―remodeling‖ is the mechanism underlying the lifelong skeletal turnover and maintenance [6]. Modeling and remodeling can coexist during bone growth. Tooth movements resulting from orthodontic forces provide a mechanical stimulus that induces biological responses, and the transformation involves both bone modeling and remodeling.
The pressure-tension theory is widely accepted as describing alveolar tissue reactions during orthodontic tooth movement, and is based on orthodontic forces inducing PDL tension and compression. Previous studies [3,7-9] have observed bone resorption and apposition in the compression and tension zones, respectively. Most such studies were based on histology animal experiments [10,11], but such histological techniques cannot be applied to human subjects.
1 2 3 4 5 6 7 8 9 10 11 12 13 14 15 16 17 18 19 20 21 22 23 24 25 26 27 28 29 30 31 32 33 34 35 36 37 38 39 40 41 42 43 44 45 46 47 48 49 50 51 52 53 54 55 56 57 58 59 60 61 62
5
Several noninvasive methods can be used to measure the alveolar bone density in humans, including digital image analysis of microradiographs [12], dual-energy x-ray absorptiometry [13], and ultrasound [14]. However, all of these approaches have inherent limitations, such as nonavailability of three-dimensional (3D) information. In addition, these approaches are not accurate enough to evaluate the alveolar bone density around the teeth. Computed tomography (CT) is one of the most useful medical imaging techniques for obtaining data on both the structure and density of body tissue. The bone density in Hounsfield units (HU) is directly related to the tissue attenuation coefficient [15,16]. However, CT cannot be used evaluate the alveolar bone density during orthodontic treatment due to its high radiation dosage, especially given that patients typically need several CT scans over several months. Aranyarachkul et al. [17] have recently demonstrated that cone-beam CT (CBCT) could be a useful alternative diagnostic method for evaluating the bone density, especially since the reported radiation dosage is much lower than that for CT.
Bridges et al. [18] indicated that the alveolar mineral density was significantly reduced after orthodontic treatment in rats. In our previous study [19], we found that the alveolar bone density around the anterior teeth of the maxilla can be reduced by 24% after 7 months of orthodontic treatment in human subjects. However, that study did not investigate the effects of the direction of tooth movement on changes in bone density. The current study therefore used CBCT to evaluate the relationship between the changes in the alveolar bone density around the teeth and the direction of tooth movement after 7 months of orthodontic treatment. The hypothesis tested by this study was that tooth movements that induce compression produce the maximum reduction in alveolar bone density. 1 2 3 4 5 6 7 8 9 10 11 12 13 14 15 16 17 18 19 20 21 22 23 24 25 26 27 28 29 30 31 32 33 34 35 36 37 38 39 40 41 42 43 44 45 46 47 48 49 50 51 52 53 54 55 56 57 58 59 60 61 62
6
Materials and Methods
Patient selection
The ethical issues of the research protocol were approved by the institutional research board of China Medical University and Medical Center. Eight patients (three females and five males, aged from 20 to 25 years) were selected in this study. The beam-hardening effect was reduced by excluding patients with dental bridges, dental implants, and metal crowns. A stainless steel bracket (Micro-arch, Roth type, Tomy International, Tokyo, Japan) and improved superelastic NiTi-alloy archwire (LH wire, Tomy International) were used in the current study. All patients received
nonextraction orthodontic treatment. They did not receive any periodontal supportive
therapy during the treatment, they were all healthy and none of them was receiving any
medication.
CBCT scan setup
The CBCT images were obtained before and after 7 months of orthodontic treatment using the i-CAT scanner (Imaging Sciences International, Hatfield, PA, USA). To ensure that the voltage, current, resolution, field of view (FOV), and patient’s position did not affect measurements of the alveolar bone density obtained from the CBCT images, the CBCT parameters and patient’s position were identical in all of the CBCT scans. Before CBCT scanning, the patient was placed in a seated position with the head upright and positioned so that the intersection lines were straight horizontally and vertically through the center of the region of interest. CBCT images were taken with the following parameters: 120 kVp, 47 mA, 250-m voxel resolution, and 16-cm FOV.
Measurement of bone density on different sides of the teeth
The procedure used to measure the alveolar bone density was modified from that used in our previous study [19]. The six teeth in the anterior region of the maxilla (both right and left canines, lateral incisors, and central incisors) were selected as the target teeth. The CBCT images of each patient were imported into Mimics 12.0 medical imaging software (Materialise, Leuven, Belgium) 1 2 3 4 5 6 7 8 9 10 11 12 13 14 15 16 17 18 19 20 21 22 23 24 25 26 27 28 29 30 31 32 33 34 35 36 37 38 39 40 41 42 43 44 45 46 47 48 49 50 51 52 53 54 55 56 57 58 59 60 61 62
7
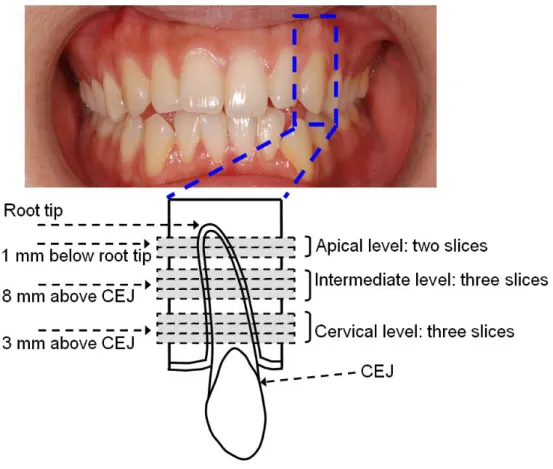
to construct a 3D computer model. Before measuring the alveolar bone densities, the 3D model was resliced to obtain new CBCT slices of the teeth that were perpendicular to their longitudinal axes by using the ―reslice‖ function in Mimics. The bone density around each tooth was assessed at three levels: cervical, intermediate, and apical; where the cervical and intermediate levels were located 3 and 8 mm apical to the cementoenamel junction, respectively, and the apical level was located 1 mm coronal to the root tip (Figure 1). In addition, three adjacent slices obtained at the cervical and intermediate levels and two adjacent slices obtained at the apical level were used to obtain more complete information.
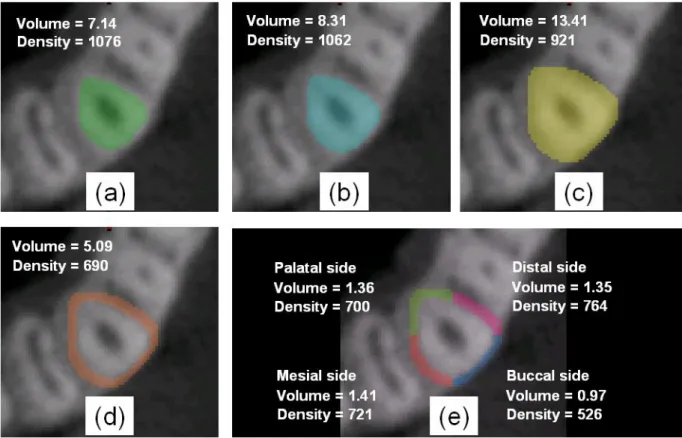
Figure 2 shows the steps involved in measuring the bone density on the different sides in the middle slice at the intermediate level of the upper-left canine of patient #2. First, the area of the tooth in the slice was selected based on the grayscale threshold value of the cementum (Figure 2a). This was expanded first by 1 voxel (250 m) to include the thickness of the PDL (Figure 2b) [20], and then by a further 3 voxels (750 m) to include the surrounding bone (Figure 2c). The combined area of the tooth plus PDL was subtracted from the entire area (tooth plus PDL plus surrounding bone) using a Boolean operation to obtain the bone density (as the grayscale value) of the bone around the tooth (Figure 2d). Finally, the surrounding bone was divided into four regions (palatal, distal, mesial, and buccal sides) to obtain the alveolar bone density on the different sides of the tooth (Figure 2e).
Measurement of direction of tooth movement
In each patient, the 3D computer models of the upper teeth were established before and after orthodontic treatment in RapidForm software (Inus Technology, Seoul, Korea) (Figure 3a & b). The direction and distance of the tooth movement was calculated by superimposing the models corresponding to before and after orthodontic treatments in RapidForm. The superimposed model was used to determine whether the surrounding alveolar bone received compressive or tensile forces based on the direction of tooth movement (Figure 3c & d): alveolar bone would be subjected to 1 2 3 4 5 6 7 8 9 10 11 12 13 14 15 16 17 18 19 20 21 22 23 24 25 26 27 28 29 30 31 32 33 34 35 36 37 38 39 40 41 42 43 44 45 46 47 48 49 50 51 52 53 54 55 56 57 58 59 60 61 62
8
compression in the direction of tooth movement and to tension in the direction opposite to the tooth movement.
Validating the instrumentation and measurements
Prior to analyzing the bone density changes during orthodontic treatment, the accuracies of the instrumentation and measurements needed to be validated. Five phantoms constructed from pure water, aluminum, dental composite resin, high-density acrylic, and dental utility wax with specific densities were used to validate the consistency at two CBCT scanning times (performed on the same days in all patients before and after orthodontic treatments). The intraclass correlation coefficient (ICC) and repeated-measures analysis of variance (ANOVA) were used to determine the reliability of measurements made using the CBCT instrument. The ICC and p value of repeated-measures ANOVA tests were 0.99 and 0.90, respectively. The reliabilities of intraexaminer and interexaminer measurements were also validated in the statistical analyses. The interexaminer error was determined by the alveolar bone density on the four sides around the tooth in a certain CBCT slice being measured once by each of two examiners—the ICC and p value of repeated-measures ANOVA tests were 0.96 and 0.62, respectively. In addition, the intraexaminer error was determined in a certain CBCT slice being measured five times by a single examiner—the ICC and p value of repeated-measures ANOVA tests were 0.99 and 0.73, respectively. These values indicate that the instrumentation, intraexaminer, and interexaminer errors of this method could be neglected in the current study. All of the statistical analyses were performed using the SAS statistical package (SAS Institute, Cary, NC, USA).
1 2 3 4 5 6 7 8 9 10 11 12 13 14 15 16 17 18 19 20 21 22 23 24 25 26 27 28 29 30 31 32 33 34 35 36 37 38 39 40 41 42 43 44 45 46 47 48 49 50 51 52 53 54 55 56 57 58 59 60 61 62
9
Statistical analysis
The percentage of the 144 samples [8 (patients) 6 (teeth) 3 (levels)] in which the side
(palatal, distal, mesial, or buccal) of maximum bone density reduction (before and after orthodontic treatment) coincided with the direction of tooth movement was calculated; this is referred to here as the ―coincidence percentage‖. In addition, 81 of the 144 samples exhibited movement (i.e., distance between before and after orthodontic treatment) larger than 0.5 mm. The coincidence percentage was also calculated for these 81 samples.
The coincidence percentages were calculated in all 144 samples and also in 26, 26, and 28 of the 48 samples [8 (patients) 6 (teeth)] at the apical, intermediate, and cervical levels, respectively, in which the movement was larger than 0.5 mm. The bone density reduction was maximal on the buccal, palatal, mesial, and distal sides in 36, 38, 46, and 24 of the 144 samples, respectively; the movements were larger than 0.5 mm in 23, 22, 21, and 15 of these samples. The coincidence percentages of these samples were also calculated.
1 2 3 4 5 6 7 8 9 10 11 12 13 14 15 16 17 18 19 20 21 22 23 24 25 26 27 28 29 30 31 32 33 34 35 36 37 38 39 40 41 42 43 44 45 46 47 48 49 50 51 52 53 54 55 56 57 58 59 60 61 62
10
Results
Alveolar bone density changes around the teeth in the eight patients
In 142 of the 144 samples the bone density around the maxilla anterior teeth reduced by 24.39.5% (meanstandard deviation; range 1.8–48.0%) during 7 months of orthodontic treatment. The bone density increased in only two samples: at the apical level of the upper-left lateral incisor and at the cervical level of upper-left canine of one patient. The bone density reductions at different teeth and levels were reported previously [19].
Bone density, bone density changes, and direction of tooth movement
Due to the huge amount of information obtained in our experiments, here we report only representative data obtained in a single patient. The alveolar bone densities on four sides of the teeth obtained before and after 7 months of orthodontic treatment in patient #5 are listed in Table 1. There was a total of 18 samples [6 (teeth) 3 (levels)] for patient #5. In each sample, the alveolar bone density changes on the four sides of the tooth between before and after orthodontic treatment are listed in Table 2, as well as the side on which the bone density change was maximal. In 12 of these 18 samples the tooth movement was larger than 0.5 mm, and the directions of these movements are also listed in Table 2.
The coincidence percentage in all patients
We first quote the coincidence percentages for patient #5, based on the data given in Table 2. In 9 of the 18 samples from patient #5, the direction of tooth movement was consistent with the side of maximum bone density reduction, yielded a coincidence percentage of 50.0% (9/18). In addition, the coincidence percentage was 66.7% (8/12) for tooth movements larger than 0.5 mm.
For all 8 patients (144 samples), the highest and lowest coincidence percentages were 72.2% (13/18, patient #1) and 50.0% (9/18, patients #5 and #8), and the average coincidence percentage was 59.0% (85/144)(Table 3). In addition, the highest and lowest coincidence percentages for the 8 1 2 3 4 5 6 7 8 9 10 11 12 13 14 15 16 17 18 19 20 21 22 23 24 25 26 27 28 29 30 31 32 33 34 35 36 37 38 39 40 41 42 43 44 45 46 47 48 49 50 51 52 53 54 55 56 57 58 59 60 61 62
11
patients (81 samples) for tooth movements larger than 0.5 mm were 87.5% (7/8, patient #3) and 54.5% (6/11, patient #4), with an average value of 69.1% (56/81) (Table 3).
The coincidence percentage at different levels
We first quote the coincidence percentages at different levels (cervical, intermediate, and apical) for patient #5, again based on the data given in Table 2. The coincidence percentages in patient #5 were 50% (3/6), 50% (3/6), and 50% (3/6) at the cervical, intermediate, and apical levels, respectively; the corresponding values for tooth movements larger than 0.5 mm were 60% (3/5), 60% (3/5), and 100% (2/2).
The coincidence percentages for all eight patients were 62.5% (30/48), 62.5% (30/48), and 52.1% (25/48) at the cervical, intermediate, and apical levels, respectively; the corresponding values for tooth movements larger than 0.5 mm were 76.9% (20/26), 69.2% (18/26), and 64.3% (18/28) (Table 4).
The coincidence percentage on different sides
We first quote the coincidence percentages on different sides (buccal, palatal, mesial, and distal) of patient #5, again based on the data given in Table 2. The maximum bone density reduction occurred on the buccal, palatal, mesial, and distal sides in 5, 5, 5, and 3 of the 18 samples from patient #5, respectively. The coincidence percentages were 100% (5/5), 0% (0/5), 60% (3/5), and 33% (1/3) on the buccal, palatal, mesial, and distal sides, respectively; the corresponding values for tooth movements larger than 0.5 mm were 100% (4/4), 0% (0/3), 100% (3/3), and 50% (1/2).
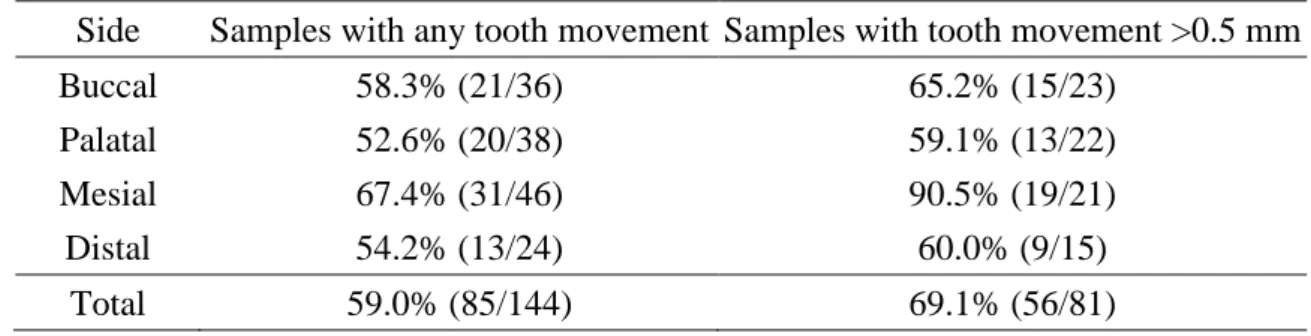
The coincidence percentages for all eight patients were 58.3% (21/36), 52.6% (20/38), 67.4% (31/46), and 54.2% (13/24) on the buccal, palatal, mesial, and distal sides, respectively; the
corresponding values for tooth movements larger than 0.5 mm were 65.2% (15/23), 59.1% (13/22), 90.5 (19/21), and 60.0% (9/15) (Table 5). 1 2 3 4 5 6 7 8 9 10 11 12 13 14 15 16 17 18 19 20 21 22 23 24 25 26 27 28 29 30 31 32 33 34 35 36 37 38 39 40 41 42 43 44 45 46 47 48 49 50 51 52 53 54 55 56 57 58 59 60 61 62
12
Discussion
The pressure-tension theory states that compressive forces on bone will induce resorption, while tensile forces will lead to bone formation. Most of the previous studies [10,11] were based on the histology animal experiments, but such histological techniques cannot be applied to human subjects. Recently, we were first to use the CBCT approach to assess the bone density changes around the teeth during movements induced by orthodontic treatment [19]. In that study the mean reduction in bone density around the teeth was about 24% after 7 months of orthodontic treatment. In the current study, we further evaluated the relation between bone density changes and the direction of tooth movement. The experimental results showed that the coincidence
percentage—defined as the maximum bone density reduction between before and after
orthodontic treatment that coincided with the direction of tooth movement—was 59.0%
(85/144) in the 144 samples from all 8 patients, and 69.1% (56/81) in the 81 samples with tooth
movements of larger than 0.5 mm (Table 3). These values (i.e., 59.0% and 69.1%) are much
higher than the random rate of 25% (i.e., 1/4), which indicates that there is an association
between the direction of tooth movement and the side of maximum bone density reduction.
These results are consistent with the hypothesis of this study: that the alveolar bone density
reduction is maximal in the direction of tooth movement.
Many studies have demonstrated that CT is a useful approach for evaluating the alveolar bone density [21-23], with most of them focusing on evaluating the bone density prior to dental implant surgery. Two CT scans were needed in the current study, before and after orthodontic treatment, and the associated high radiation dosage constrains the application of the CT approach in orthodontics, especially in research comparing tissue reactions between before and after orthodontic treatment.
CBCT has recently been used extensively in dental treatment, such as in oral surgery, temporomandibular joint disorder, dental implantation, and endodontics. One of the most important advantages of CBCT over CT is its much lower radiation dosage: the radiation dosage delivered to 1 2 3 4 5 6 7 8 9 10 11 12 13 14 15 16 17 18 19 20 21 22 23 24 25 26 27 28 29 30 31 32 33 34 35 36 37 38 39 40 41 42 43 44 45 46 47 48 49 50 51 52 53 54 55 56 57 58 59 60 61 62
13
the patient during each scan is typically around 3 mGy for CT [24] and 0.62 mGy for CBCT [25]. Some studies have found that the accuracy of bone density measurements derived from CBCT images can be affected by various factors, including the FOV [26], voxel resolution [26], the presence/absence of metal implants in the mouth [27], object morphology [28], and object location [29]. Nevertheless, Aranyarachkul et al. [17] demonstrated that CBCT could be a useful alternative diagnostic method for evaluating the bone density, and Lagravere et al. [30] reported that there is a linear relationship between actual densities and the HU values (grayscale values) obtained in a CBCT scan. In addition, Naitoh et al. [31] demonstrated a strong correlation between voxel values of CBCT and bone mineral densities of multislice CT, and they concluded that the voxel values of mandibular cancellous bone in CBCT can be used to estimate the bone density. More importantly, in the current study, all of the parameters (i.e., FOV, voxel resolution, voltage, and current) of the CBCT instrument and the posture and position of the patients were identical in each scan, which maximized the accuracy of using low-radiation-dosage CBCT as the evaluation tool.
Based on the pressure-tension hypothesis, orthodontists associate the compression zone with resorption and the tension zone with apposition. However, this is not consistent with orthopedic biomechanics: the mechanical compression will stimulate bone formation and tension will stimulate resorption [32]. The controversy was discussed by Epker and Frost [33], they indicated that the shape of the alveolar bone circumference changes when the PDL fibers are stretched, since this will decrease the radius of the alveolar wall (i.e., bending the bone in the tension zone), leading to apposition of the bone.
Bone resorption refers to the removal of bone by various cellular changes in the pressure/compression zone. Two types of bone resorption occur depending upon the magnitude of the orthodontic force: direct (frontal) and indirect (undermining) resorptions. If the applied force is low, direct bone resorption of the alveolar wall from the PDL occurs. However, an excessive force will induce hyalinization in the PDL, which will in turn initiate indirect resorption from the marrow 1 2 3 4 5 6 7 8 9 10 11 12 13 14 15 16 17 18 19 20 21 22 23 24 25 26 27 28 29 30 31 32 33 34 35 36 37 38 39 40 41 42 43 44 45 46 47 48 49 50 51 52 53 54 55 56 57 58 59 60 61 62
14
spaces [34].
The current study found that 7 months of orthodontic treatment reduced the bone density around the teeth in 142 of the 144 samples from the 8 patients, with the density being increased in only 2 samples (at the apical level of the upper-left lateral incisor and at the cervical level of the upper-left canine of 1 patient). The study results also indicated that the bone density around the tooth clearly decreased on the compression side (i.e., in the direction of tooth movement) and clearly increased on the tension side (i.e., in the direction opposite to the tooth movement). These experimental results are consistent with those of Verna et al. [5], who showed that the alveolar bone fraction (bone volume/total volume) around the tooth was significantly decreased after orthodontic tooth movement in a histological analysis of rats, with the decreases occurring on both the compression and tension sides. However, this finding was explained by the pressure-tension theory, which supports bone apposition in the tension zone. This discrepancy might be due to the new bone formed in the tension zone being woven bone [35], which is poorly mineralized and relatively weak [18,36]. During the remodeling process it generally takes approximately 1 year for lamellar bone to replace new formed woven bone following the orthodontic movement of a tooth [37]. For this reason, after active orthodontic treatment, a retainer must be placed for at least 6 months to allow for mineral maturation of newly formed bone and to reduce the possibility of relapse. The new formed woven bone can be detected by the multiple-fluorochromes method or the use of calcium-binding labeling [38,39]. In the current study, after 7 months of orthodontic treatment the bone surrounding the teeth would not be fully mature (i.e., the conversion of woven bone into lamella bone), and so the new formed woven bone would still have a low mineral content and hence its density would be too low to allow detection by CBCT. Therefore, a third CBCT scan would be needed at 1 year after completing orthodontic treatment in order to evaluate whether or not the bone density around the tooth in the tension side had increased to the normal condition (i.e., that before orthodontic treatment). 1 2 3 4 5 6 7 8 9 10 11 12 13 14 15 16 17 18 19 20 21 22 23 24 25 26 27 28 29 30 31 32 33 34 35 36 37 38 39 40 41 42 43 44 45 46 47 48 49 50 51 52 53 54 55 56 57 58 59 60 61 62
15
Our confirmation of the hypothesis of this study—that the alveolar bone density
reduction is maximal in the direction of tooth movement—may be indirectly consistent with the
experimental results of Melsen [9]. They investigated the biological reaction of alveolar bone to orthodontic tooth movement using six adult Macaca fascicularis monkeys, and found that the resorption activity was highest in areas surrounding teeth subjected to compressive forces.
Melsen [9] found no significant differences in the bone reaction after orthodontic tooth movement at different tooth heights, and hence they pooled the results obtained from identical areas from sections obtained at different heights (corresponding to levels in the current study). However, the experimental results obtained in the current study (Table 4) indicated that the coincidence percentage was lowest at the cervical level, being 52.1% (25/48) and 64.3% (18/28) for samples with any tooth movement and tooth movement larger than 0.5 mm, respectively. This might be due to the presence of some cortical bone tissue at the cervical level of the root, while most of the bone at the intermediate and apical levels is cancellous bone. This is supported by the bone densities at the cervical and apical levels in patient #5 (Table 1) being 902.3 and 785.3 grayscale values before orthodontic treatment, respectively. In addition, previous studies [7,40] have indicated that different mechanisms underlie the remodeling of cortical bone and cancellous bone.
The coincidence percentage was highest on the mesial side for all tooth movements, at 67.4% (31/46), and highest on the mesial side for tooth movements larger than 0.5 mm, at 90.5% (19/21) (Table 5). This might be due to the buccal and palatal sides containing more cortical bone tissue.
Some limitations of this study should be considered. First, only eight patients were included due to the CBCT examination not being an essential procedure during orthodontic treatment. These eight patients will receive the third CBCT scan at 1 year after completing 7 months of orthodontic treatment in order to evaluate the whether or not the bone density around the tooth had increased to the normal condition. Second, the bone density was quantified only as the gray level in the CBCT 1 2 3 4 5 6 7 8 9 10 11 12 13 14 15 16 17 18 19 20 21 22 23 24 25 26 27 28 29 30 31 32 33 34 35 36 37 38 39 40 41 42 43 44 45 46 47 48 49 50 51 52 53 54 55 56 57 58 59 60 61 62
16
images, with no histological analysis being possible due to the use of human subjects. It is impossible to make observations at the molecular level in CBCT images. Third, factors other than to the mechanical forces can also affect the bone density, such as oral hygiene and diet. Fourth, only the teeth in the anterior region (from the upper-right to the upper-left canines) of the maxilla were evaluated, which was due to their movements being larger. Teeth with multiple roots should be investigated in a further study.
1 2 3 4 5 6 7 8 9 10 11 12 13 14 15 16 17 18 19 20 21 22 23 24 25 26 27 28 29 30 31 32 33 34 35 36 37 38 39 40 41 42 43 44 45 46 47 48 49 50 51 52 53 54 55 56 57 58 59 60 61 62
17
Conclusion
After 7 months of orthodontic treatment, the bone density around the teeth of the anterior maxilla reduced by about 24% in the 8 patients investigated in this study. The average coincidence percentage after orthodontic treatment in all 144 samples obtained from the 8 patients was 59.0% (85/144), which demonstrates that the direction of tooth movement is associated with the side of maximum bone density reduction. The obtained results show that CBCT is a useful approach complementary to histomorphometric animal studies for evaluating the changes in bone density around teeth induced by orthodontic treatment.
1 2 3 4 5 6 7 8 9 10 11 12 13 14 15 16 17 18 19 20 21 22 23 24 25 26 27 28 29 30 31 32 33 34 35 36 37 38 39 40 41 42 43 44 45 46 47 48 49 50 51 52 53 54 55 56 57 58 59 60 61 62
18
Acknowledgements
The authors would like to thank professors Che-Shoa Chang and Yuh-Yuan Shiau (School of Dentistry, College of Medicine, China Medical University) for their suggestions in this study. The authors wish to thank Li-Na Liao (Biostatistics Center and Department of Public Health, China Medical University) for her assistance of statistical analysis and Shang-Ran Huang (Department of Biomedical Imaging and Radiological Sciences, National Yang-Ming University) for his assistance of software analysis. 1 2 3 4 5 6 7 8 9 10 11 12 13 14 15 16 17 18 19 20 21 22 23 24 25 26 27 28 29 30 31 32 33 34 35 36 37 38 39 40 41 42 43 44 45 46 47 48 49 50 51 52 53 54 55 56 57 58 59 60 61 62
19
Conflict of interest
No authors of this study have any financial and personal relationships with other people or organizations, which could result in an inappropriate influence of this study.
1 2 3 4 5 6 7 8 9 10 11 12 13 14 15 16 17 18 19 20 21 22 23 24 25 26 27 28 29 30 31 32 33 34 35 36 37 38 39 40 41 42 43 44 45 46 47 48 49 50 51 52 53 54 55 56 57 58 59 60 61 62
20
References
1. Noda K, Nakamura Y, Kogure K, Nomura Y (2009) Morphological changes in the rat periodontal ligament and its vascularity after experimental tooth movement using superelastic forces. Eur J Orthod 31:37-45
2. Garat JA, Gordillo ME, Ubios AM (2005) Bone response to different strength orthodontic forces in animals with periodontitis. J Periodontal Res 40:441-445
3. Melsen B (2001) Tissue reaction to orthodontic tooth movement--a new paradigm. Eur J Orthod 23:671-681
4. Cattaneo PM, Dalstra M, Melsen B (2005) The finite element method: a tool to study orthodontic tooth movement. J Dent Res 84:428-433
5. Verna C, Zaffe D, Siciliani G (1999) Histomorphometric study of bone reactions during orthodontic tooth movement in rats. Bone 24:371-379
6. Roberts WE, Roberts JA, Epker BN, Burr DB, Hartsfield JK (2006) Remodeling of Mineralized Tissues, Part I: The Frost Legacy. Sem Orthod 12:216-237
7. Roberts WE, Epker BN, Burr DB, Hartsfield JK, Roberts JA (2006) Remodeling of Mineralized Tissues, Part II: Control and Pathophysiology. Sem Orthod 12:238-253
8. Meikle MC (2006) The tissue, cellular, and molecular regulation of orthodontic tooth movement: 100 years after Carl Sandstedt. Eur J Orthod 28:221-240
9. Melsen B (1999) Biological reaction of alveolar bone to orthodontic tooth movement. Angle Orthod 69:151-158
10. Reitan K, Kvam E (1971) Comparative behavior of human and animal tissue during experimental tooth movement. Angle Orthod 41:1-14
11. Rygh P (1973) Ultrastructural changes in pressure zones of human periodontium incident to orthodontic tooth movement. Acta Odontol Scand 31:109-122
12. Jager A, Radlanski RJ, Taufall D, Klein C, Steinhofel N, Doler W (1990) Quantitative determination of alveolar bone density using digital image analysis of microradiographs. Anat Anz 170:171-179
13. Choel L, Duboeuf F, Bourgeois D, Briguet A, Lissac M (2003) Trabecular alveolar bone in the human mandible: a dual-energy x-ray absorptiometry study. Oral Surg Oral Med Oral Pathol Oral Radiol Endod 95:364-370
14. Al Haffar I, Padilla F, Nefussi R, Kolta S, Foucart JM, Laugier P (2006) Experimental evaluation of bone quality measuring speed of sound in cadaver mandibles. Oral Surg Oral Med Oral Pathol Oral Radiol Endod 102:782-791
15. Chen WP, Hsu JT, Chang CH (2003) Determination of Young’s modulus of cortical bone directly from computed tomography: a rabbit model. J Chin Inst Eng 22:121-128
16. Homolka P, Beer A, Birkfellner W, Nowotny R, Gahleitner A, Tschabitscher M, Bergmann H (2002) Bone mineral density measurement with dental quantitative CT prior to dental implant placement in cadaver mandibles: pilot study. Radiology 224:247-252
17. Aranyarachkul P, Caruso J, Gantes B, Schulz E, Riggs M, Dus I, Yamada JM, Crigger M 1 2 3 4 5 6 7 8 9 10 11 12 13 14 15 16 17 18 19 20 21 22 23 24 25 26 27 28 29 30 31 32 33 34 35 36 37 38 39 40 41 42 43 44 45 46 47 48 49 50 51 52 53 54 55 56 57 58 59 60 61 62
21
(2005) Bone density assessments of dental implant sites: 2. Quantitative cone-beam computerized tomography. Int J Oral Maxillofac Implants 20:416-424
18. Bridges T, King G, Mohammed A (1988) The effect of age on tooth movement and mineral density in the alveolar tissues of the rat. Am J Orthod Dentofacial Orthop 93:245-250
19. Hsu JT, Chang HW, Huang HL, Yu JH, Li YF, Tu MG Bone density changes around teeth during orthodontic treatment. Clinical oral investigations Online publication
20. Toms SR, Eberhardt AW (2003) A nonlinear finite element analysis of the periodontal ligament under orthodontic tooth loading. Am J Orthod Dentofacial Orthop 123:657-665 21. Fuh LJ, Huang HL, Chen CS, Fu KL, Shen YW, Tu MG, Shen WC, Hsu JT (2010)
Variations in bone density at dental implant sites in different regions of the jawbone. J Oral Rehabil 37:346-351
22. Norton MR, Gamble C (2001) Bone classification: an objective scale of bone density using the computerized tomography scan. Clin Oral Implants Res 12:79-84
23. Turkyilmaz I, Tozum TF, Tumer C (2007) Bone density assessments of oral implant sites using computerized tomography. J Oral Rehabil 34:267-272
24. Cann CE (1988) Quantitative CT for determination of bone mineral density: a review. Radiology 166:509-522
25. Mozzo P, Procacci C, Tacconi A, Martini PT, Andreis IA (1998) A new volumetric CT machine for dental imaging based on the cone-beam technique: preliminary results. Eur Radiol 8:1558-1564
26. Hua Y, Nackaerts O, Duyck J, Maes F, Jacobs R (2009) Bone quality assessment based on cone beam computed tomography imaging. Clin Oral Implants Res 20:767-771
27. Draenert FG, Coppenrath E, Herzog P, Muller S, Mueller-Lisse UG (2007) Beam hardening artefacts occur in dental implant scans with the NewTom cone beam CT but not with the dental 4-row multidetector CT. Dentomaxillofac Radiol 36:198-203
28. Katsumata A, Hirukawa A, Okumura S, Naitoh M, Fujishita M, Ariji E, Langlais RP (2007) Effects of image artifacts on gray-value density in limited-volume cone-beam computerized tomography. Oral Surg Oral Med Oral Pathol Oral Radiol Endod 104:829-836
29. Katsumata A, Hirukawa A, Noujeim M, Okumura S, Naitoh M, Fujishita M, Ariji E, Langlais RP (2006) Image artifact in dental cone-beam CT. Oral Surg Oral Med Oral Pathol Oral Radiol Endod 101:652-657
30. Lagravere MO, Carey J, Ben-Zvi M, Packota GV, Major PW (2008) Effect of object location on the density measurement and Hounsfield conversion in a NewTom 3G cone beam computed tomography unit. Dentomaxillofac Radiol 37:305-308
31. Naitoh M, Hirukawa A, Katsumata A, Ariji E (2009) Evaluation of voxel values in mandibular cancellous bone: relationship between cone-beam computed tomography and multislice helical computed tomography. Clin Oral Implants Res 20:503-506
32. Frost HM (1991) Some ABC's of skeletal pathophysiology. 7. Tissue mechanisms controlling bone mass. Calcif Tissue Int 49:303-304
33. Epker BN, Frost HM (1965) Correlation of Bone Resorption and Formation with the 1 2 3 4 5 6 7 8 9 10 11 12 13 14 15 16 17 18 19 20 21 22 23 24 25 26 27 28 29 30 31 32 33 34 35 36 37 38 39 40 41 42 43 44 45 46 47 48 49 50 51 52 53 54 55 56 57 58 59 60 61 62
22
Physical Behavior of Loaded Bone. J Dent Res 44:33-41
34. Cardaropoli D, Gaveglio L (2007) The influence of orthodontic movement on periodontal tissues level. Sem Orthod 13:234-245
35. Roberts WE (1988) Bone tissue interface. J Dent Educ 52:804-809
36. Misch CE, Bidez MW, Sharawy M (2001) A bioengineered implant for a predetermined bone cellular response to loading forces. A literature review and case report. J Periodontol 72:1276-1286
37. Meghji S (1992) Bone remodelling. Br Dent J 172:235-242
38. Roberts WE, Helm FR, Marshall KJ, Gongloff RK (1989) Rigid endosseous implants for orthodontic and orthopedic anchorage. Angle Orthod 59:247-256
39. Dao V, Renjen R, Prasad HS, Rohrer MD, Maganzini AL, Kraut RA (2009) Cementum, pulp, periodontal ligament, and bone response after direct injury with orthodontic anchorage screws: a histomorphologic study in an animal model. J Oral Maxillofac Surg 67:2440-2445 40. van Oers RF, Ruimerman R, Tanck E, Hilbers PA, Huiskes R (2008) A unified theory for
osteonal and hemi-osteonal remodeling. Bone 42:250-259 1 2 3 4 5 6 7 8 9 10 11 12 13 14 15 16 17 18 19 20 21 22 23 24 25 26 27 28 29 30 31 32 33 34 35 36 37 38 39 40 41 42 43 44 45 46 47 48 49 50 51 52 53 54 55 56 57 58 59 60 61 62
23
TABLE LEGENDS
Table 1. Alveolar bone densities (in Hounsfield units) on four sides of the teeth before and after 7 months of orthodontic treatment in patient #5.
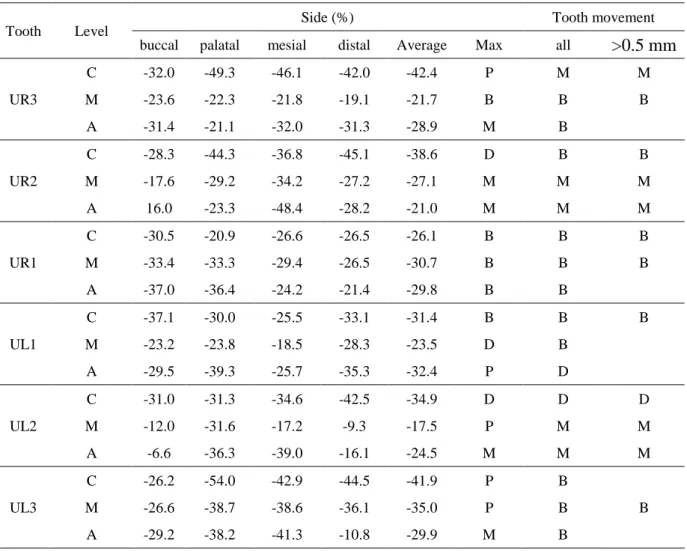
Table 2. Percentage changes in the alveolar bone density on four sides of the tooth between before and after 7 months of orthodontic treatment in patient #5. The directions of tooth
movement are also listed.
Table 3. Coincidence percentages for all tooth movements and for those larger than 0.5 mm in the eight patients.
Table 4. Coincidence percentages for all tooth movements and for those larger than 0.5 mm at different levels in the eight patients.
Table 5. Coincidence percentages for all tooth movements and for those larger than 0.5 mm on different sides in the eight patients.
FIGURE LEGENDS
Figure 1. Schematic of the three levels at which the root of the upper-left canine and the surrounding bone were sectioned. CEJ, cementoenamel junction.
Figure 2. Steps involved in measuring the bone density around the upper-left canine in the middle slice at the intermediate level in patient #2: (a) segmenting the area of the tooth from the CBCT image using the threshold value of the cementum; (b) expanding by 1 voxel (250 μm) to include the PDL; (c) expanding by a further 3 voxels (750 μm) to include the surrounding bone; (d) subtracting the tooth and PDL from the tooth, PDL, and surrounding bone; and (e) dividing the surrounding bone into four regions: palatal, distal, mesial, and buccal sides. The volumes of the areas (unit: mm3) and their densities (unit: bone density in grayscale values in the CBCT image) are also indicated.
Figure 3. Occlusal photographs of the maxilla of patient #5 before treatment (a) and after treatment (b). (c), (d) Superimposed models before (red) and after (green) treatments: overall view (c) and closer view (d).
1 2 3 4 5 6 7 8 9 10 11 12 13 14 15 16 17 18 19 20 21 22 23 24 25 26 27 28 29 30 31 32 33 34 35 36 37 38 39 40 41 42 43 44 45 46 47 48 49 50 51 52 53 54 55 56 57 58 59 60 61 62
24
Table 1. Alveolar bone densities (in Hounsfield units) on four sides of the teeth before and after 7 months of orthodontic treatment in patient #5.
Tooth Level
Before orthodontic treatment After 7 months of orthodontic
Buccal Palatal Mesial Distal Average Buccal Palatal Mesial Distal Average
UR3 C 677.3 862.5 895.5 867.3 825.7 460.7 437.1 482.5 502.8 470.8 M 770.1 744.1 834.9 577.7 731.7 588.6 577.8 653.0 467.2 571.7 A 710.2 740.9 928.6 947.5 831.8 487.4 584.4 631.6 650.9 588.6 UR2 C 896.5 756.0 1056.2 849.9 889.7 642.6 420.9 667.6 466.8 549.5 M 849.2 912.2 904.9 797.4 865.9 699.4 645.4 595.1 580.6 630.1 A 606.4 596.5 818.4 789.2 702.6 703.3 457.2 422.7 566.5 537.4 UR1 C 920.1 1081.8 1101.4 1151.0 1063.6 639.8 855.7 808.9 846.1 787.6 M 1002.2 1088.9 966.5 954.5 1003.0 667.3 724.7 682.6 701.8 694.1 A 839.3 847.6 721.7 781.7 797.6 528.5 538.7 547.3 614.0 557.1 UL1 C 1030.2 1084.5 1059.9 1075.1 1062.4 647.5 759.3 789.8 719.7 729.1 M 1047.5 939.4 940.3 820.1 936.8 804.3 715.9 766.0 587.9 718.5 A 1017.1 797.9 761.9 741.1 829.5 717.5 484.5 566.4 479.8 562.0 UL2 C 715.6 839.3 939.0 801.8 823.9 494.0 576.4 614.1 460.8 536.3 M 763.0 844.0 805.6 551.1 740.9 671.4 577.4 667.3 500.0 604.0 A 720.6 619.5 800.0 556.8 674.2 673.3 394.4 488.0 467.4 505.8 UL3 C 491.8 680.2 797.7 668.8 659.6 362.9 312.9 455.2 371.2 375.6 M 689.6 739.4 691.0 694.7 703.7 505.9 453.5 424.6 443.8 457.0 A 734.7 677.9 980.3 895.4 822.1 520.4 419.0 575.9 798.7 578.5 UR3: upper-right canine; UR2: upper-right lateral incisor; UR1: upper-right incisor
UL1: upper-left incisor; UL2: upper-left lateral incisor; UL3: upper-left canine C: cervical; M: intermediate; A: apical
1 2 3 4 5 6 7 8 9 10 11 12 13 14 15 16 17 18 19 20 21 22 23 24 25 26 27 28 29 30 31 32 33 34 35 36 37 38 39 40 41 42 43 44 45 46 47 48 49 50 51 52 53 54 55 56 57 58 59 60 61 62
25
Table 2. Percentage changes in the alveolar bone density on four sides of the tooth between before and after 7 months of orthodontic treatment in patient #5. The directions of tooth movement are also
listed.
Tooth Level
Side (%) Tooth movement buccal palatal mesial distal Average Max all >0.5 mm
UR3 C -32.0 -49.3 -46.1 -42.0 -42.4 P M M M -23.6 -22.3 -21.8 -19.1 -21.7 B B B A -31.4 -21.1 -32.0 -31.3 -28.9 M B UR2 C -28.3 -44.3 -36.8 -45.1 -38.6 D B B M -17.6 -29.2 -34.2 -27.2 -27.1 M M M A 16.0 -23.3 -48.4 -28.2 -21.0 M M M UR1 C -30.5 -20.9 -26.6 -26.5 -26.1 B B B M -33.4 -33.3 -29.4 -26.5 -30.7 B B B A -37.0 -36.4 -24.2 -21.4 -29.8 B B UL1 C -37.1 -30.0 -25.5 -33.1 -31.4 B B B M -23.2 -23.8 -18.5 -28.3 -23.5 D B A -29.5 -39.3 -25.7 -35.3 -32.4 P D UL2 C -31.0 -31.3 -34.6 -42.5 -34.9 D D D M -12.0 -31.6 -17.2 -9.3 -17.5 P M M A -6.6 -36.3 -39.0 -16.1 -24.5 M M M UL3 C -26.2 -54.0 -42.9 -44.5 -41.9 P B M -26.6 -38.7 -38.6 -36.1 -35.0 P B B A -29.2 -38.2 -41.3 -10.8 -29.9 M B
B: buccal side; P: palatal side; M: mesial side ; D: distal side
1 2 3 4 5 6 7 8 9 10 11 12 13 14 15 16 17 18 19 20 21 22 23 24 25 26 27 28 29 30 31 32 33 34 35 36 37 38 39 40 41 42 43 44 45 46 47 48 49 50 51 52 53 54 55 56 57 58 59 60 61 62
26
Table 3. Coincidence percentages for all tooth movements and for those larger than 0.5 mm in the eight patients.
Patient # Samples with any tooth movement Samples with tooth movement >0.5 mm
1 72.2% (13/18) 77.8% (7/9) 2 61.1% (11/18) 54.5% (6/11) 3 61.1% (11/18) 87.5% (7/8) 4 55.6% (10/18) 54.5% (6/11) 5 50.0% (9/18) 66.7% (8/12) 6 55.6% (10/18) 60.0% (6/10) 7 66.7% (12/18) 80.0% (8/10) 8 50.0% (9/18) 80.0% (8/10) Total 59.0% (85/144) 69.1% (56/81) 1 2 3 4 5 6 7 8 9 10 11 12 13 14 15 16 17 18 19 20 21 22 23 24 25 26 27 28 29 30 31 32 33 34 35 36 37 38 39 40 41 42 43 44 45 46 47 48 49 50 51 52 53 54 55 56 57 58 59 60 61 62
27
Table 4. Coincidence percentages for all tooth movements and for those larger than 0.5 mm at different levels in the eight patients.
Level Samples with any tooth movement Samples with tooth movement >0.5 mm Apical 62.5% (30/48) 76.9% (20/26) Intermediate 62.5% (30/48) 69.2% (18/26) Cervical 52.1% (25/48) 64.3% (18/28) Total 59.0% (85/144) 69.1% (56/81) 1 2 3 4 5 6 7 8 9 10 11 12 13 14 15 16 17 18 19 20 21 22 23 24 25 26 27 28 29 30 31 32 33 34 35 36 37 38 39 40 41 42 43 44 45 46 47 48 49 50 51 52 53 54 55 56 57 58 59 60 61 62
28
Table 5. Coincidence percentages for all tooth movements and for those larger than 0.5 mm on different sides in the eight patients.
Side Samples with any tooth movement Samples with tooth movement >0.5 mm Buccal 58.3% (21/36) 65.2% (15/23) Palatal 52.6% (20/38) 59.1% (13/22) Mesial 67.4% (31/46) 90.5% (19/21) Distal 54.2% (13/24) 60.0% (9/15) Total 59.0% (85/144) 69.1% (56/81) 1 2 3 4 5 6 7 8 9 10 11 12 13 14 15 16 17 18 19 20 21 22 23 24 25 26 27 28 29 30 31 32 33 34 35 36 37 38 39 40 41 42 43 44 45 46 47 48 49 50 51 52 53 54 55 56 57 58 59 60 61 62
29
Figure 1. Schematic of the three levels at which the root of the upper-left canine and the surrounding bone were sectioned. CEJ, cementoenamel junction.
1 2 3 4 5 6 7 8 9 10 11 12 13 14 15 16 17 18 19 20 21 22 23 24 25 26 27 28 29 30 31 32 33 34 35 36 37 38 39 40 41 42 43 44 45 46 47 48 49 50 51 52 53 54 55 56 57 58 59 60 61 62
30
Figure 2. Steps involved in measuring the bone density around the upper-left canine in the middle slice at the intermediate level in patient #2: (a) segmenting the area of the tooth from the CBCT image using the threshold value of the cementum; (b) expanding by 1 voxel (250 μm) to include the PDL; (c) expanding by a further 3 voxels (750 μm) to include the surrounding bone; (d) subtracting
the tooth and PDL from the tooth, PDL, and surrounding bone; and (e) dividing the surrounding bone into four regions: palatal, distal, mesial, and buccal sides. The volumes of the areas (unit: mm3)
and their densities (unit: bone density in grayscale values in the CBCT image) are also indicated. 1 2 3 4 5 6 7 8 9 10 11 12 13 14 15 16 17 18 19 20 21 22 23 24 25 26 27 28 29 30 31 32 33 34 35 36 37 38 39 40 41 42 43 44 45 46 47 48 49 50 51 52 53 54 55 56 57 58 59 60 61 62
31
Figure 3. Occlusal photographs of the maxilla of patient #5 before treatment (a) and after treatment (b). (c), (d) Superimposed models before (red) and after (green) treatments: overall view (c) and
closer view (d). 1 2 3 4 5 6 7 8 9 10 11 12 13 14 15 16 17 18 19 20 21 22 23 24 25 26 27 28 29 30 31 32 33 34 35 36 37 38 39 40 41 42 43 44 45 46 47 48 49 50 51 52 53 54 55 56 57 58 59 60 61 62