Laser Trapping and Assembling of Nanoparticles at Solution Surface
Studied by Reflection Micro-spectroscopy
Shun-Fa Wang
a, Ken-ichi Yuyama*
aTeruki Suigiyama
b, Hiroshi Masuhara*
aa
Department of Applied Chemistry and Institute of Molecular Science, National Chiao Tung
University, Hsinchu 30010, Taiwan;
bInstrument Technology Research Center, National Applied
Research Laboratories, Hsinchu 30076, Taiwan
ABSTRACT
We present the laser power dependent behavior of optical trapping assembling of 208-nm polystyrene (PS) nanoparticles at the solution surface layer. The assembling dynamics is examined by reflection microspectroscopy as well as transmission and backscattering imaging. The transmission imaging shows that the laser irradiation at the solution surface layer forms a nanoparticle assembly, whose diameter becomes large with the increase in the laser power. The backscattering image of the assembly gives structural color, meaning that nanoparticles are periodically arranged over the whole assembly region. In reflection microspectroscopy, one band appears at long wavelength and is gradually shifted to the short wavelength with the irradiation. After the blue shift, the reflection band is located at the shorter wavelength under the laser irradiation at the higher power. We discuss these spectral changes from the viewpoint of the inter-particle distance determined by the dynamic balance between attractive optical force and repulsive electrostatic force among nanoparticles.
Keywords: optical trapping, reflection microspectroscopy, structural color, polystyrene nanoparticle, solution surface,
colloidal crystal
1. INTRODUCTION
Single beam optical trapping has been developed for decades using nanometer-sized objects of various kinds, and their trapping dynamics attracts much attention of researchers in the field of physics, optics, and chemistry from the perspective of fundamental science as well as practical application.1–3 In dilute solution, a single nanometer-sized object is trapped in the focal volume and manipulated three-dimensionally without physical contact, as demonstrated for polymeric nanosphere4, quantum dot5, and plasmonic nanoparticle6. The trapping behavior of these individual objects was monitored by spectroscopic and imaging techniques. In optical trapping in relatively concentrated solution, numerous nanometer-sized objects are confined in the focal volume of 1 μm3, and eventually one single assembly is formed. This assembly formation by optical trapping was demonstrated for above objects, as well as J-aggregates7, polymer8, micelle9, amino acid10, and protein11. The formation dynamics of their assemblies was investigated by fluorescence and scattering spectroscopic measurements.7–11
Recently, we found the fascinating optical trapping and assembling phenomenon for 200-nm polystyrene nanoparticles at the air/solution interface layer.12 Their assembling behavior at the solution surface layer was much different from that inside the solution. Optical trapping inside the solution formed a nanoparticle assembly with the size of a few micrometers, whereas the nanoparticle assembly prepared at the solution surface layer was grown up to the size of 20 μm in diameter. Furthermore, the assembly showed color under halogen lamp illumination similarly to a colloidal crystal. Spectroscopic analysis is often used in the study on colloidal crystals, because their structural color gives us the information on the packing structure of constituent particles. On the basis of this characteristic of colloidal crystals, we have spectroscopically investigated the trapping and assembling dynamics of nanoparticles at the solution surface layer. We constructed a reflection microspectroscopy system combined with the optical trapping setup and observed the
temporal change in reflection spectra of the structural color of the nanoparticle assembly.13 The assembly showed a reflection band, meaning that the trapped nanoparticles are periodically arrayed in the assembly. During the assembly growth, the reflection band was gradually shifted to short wavelength, and its bandwidth became narrow. This spectral change clearly indicates that the packing structure of nanoparticles becomes tight and homogeneous during the optical trapping. Thus, our reflection microspectroscopy is useful to investigate the trapping and assembling dynamics of nanoparticles at the solution surface layer, and we are currently extending this measurement to various trapping conditions.
In this paper, we show the laser power dependence of the optical trapping behavior of 208-nm PS nanoparticles at a solution surface layer. The trapping and assembling dynamics is examined by observing the transmission and backscattering images, and the time evolution of reflection spectra from the nanoparticle assembly. The transmission imaging shows that the assembly size becomes large with the increase in the laser power, and the reflection microspectroscopy reveals that one band appears at shorter wavelength by the irradiation at the higher laser power. The peak position in a reflection band is dynamically varied in a repetitive manner by changing the laser power alternately. We discuss these spectral changes from the viewpoint of nanoparticle rearrangement in the assembly, which accompanies the change in the inter-particle distance determined by the dynamic balance between attractive optical force and repulsive electrostatic force among nanoparticles.
2. EXPERIMENTS
We carried out the trapping experiments in the same procedure as that in our previous paper.13 The optical setup was constructed on the basis of an inverted microscope (Olympus, IX71) which is cooperated with a confocal scanning system (Olympus, FV300). A linearly polarized near-infrared laser beam from Nd3+:YVO
4 laser (Spectra Physics, J20I-BL-106C, λ = 1064 nm) was used as a trapping light source. The laser beam was introduced into an objective lens (60 magnification, N.A. 0.90) incorporated in the microscope. The laser power was tuned by rotating a half wave plate placed in front of a polarizing beam splitter. The half wave plate was equipped in a computer controllable rotating holder in order to change the laser power by remote operation. The laser power throughout the objective lens was tuned in the range between 1.4 and 0.7 W automatically by computer.
The trapping target was PS nanoparticles with a diameter of 208 nm. A colloidal aqueous solution (Polyscience, Inc., nominal diameter; 200 nm) was diluted by D2O (Aldrich, 99%) in order to suppress temperature elevation in the focal volume by laser heating. According to the experimental results reported by Ito et al, the local temperature elevation measured in H2O and D2O under the optical trapping conditions using a 1064-nm laser beam are 22–24 K/W and 2.6 K/W, respectively14. The higher temperature elevation in H
2O is ascribed to the absorption of the 1064-nm trapping laser through OH stretch overtones. The concentration of the diluted colloidal solution was fixed to be 0.2 particles/μm3. The colloidal solution of 15 μL was poured into a glass bottle with a highly hydrophilic surface at the inside wall and the bottom. After adding the sample solution into a bottle, it spontaneously spread over the bottom surface of the bottle, and the solution thin-film with a thickness of 120–150 μm was formed. The bottle was covered with another glass plate in order to suppress solvent evaporation. The bottle was set on the stage of the inverted microscope, and the trapping laser was focused into a position 5 μm below the air/solution interface.
The trapping behavior of PS nanoparticles was observed in the following three ways.13 The first observation way is transmission imaging (Figure 1a). The sample was illuminated with white light of a halogen lamp from above, and the light passed through the sample was detected with a charge-coupled device (CCD) video camera (WATEC, WAT-231S2). The second is light scattering imaging (Figure 1b). White light was introduced into the objective lens, and the sample was illuminated from its bottom. The backwardly scattered light was observed with the CCD camera. The third is reflection microspectroscopy (Figure 1c). The backscattered light was introduced through a confocal pinhole that limits the detection area to a region of 1.5 μm in diameter around the focus of the trapping laser, and monitored with a CCD detector (Princeton Instrument, PIXIS 400) coupled with a spectrograph (Princeton Instrument, ACTON Spectra Pro 2300i). The backscattering spectrum is affected by four wavelength dependences of scattering efficiency of trapped nanoparticles, incident white light, transmittance of optics positioned between the sample and the detector, and sensitivity of the detector. We excluded the latter three from a backscattering spectrum of trapped nanoparticles by measuring that of an aluminum mirror. We divided the backscattering spectrum of trapped nanoparticles by that of an aluminum mirror. The calculated spectrum was used as a reflection spectrum of trapped nanoparticles.
(a) white light (b) (c)
Z
pinhole CCD spectro camera graph I (a) Polarization direction 30 (b) ïv E E 30 20 10 0 -0- 1.4W --1.1w -A-0.8w -__---'-'
'--'Ci-_\----Aeliw'_ --- A_A_A-A-A 10pm 60 90 120 150Irradiation time (sec) 180 Figure 1: Schematic illustration of the observation methods; (a) transmission imaging, (b) backscattering imaging, and
(c) reflection microspectroscopy.
3. RESULTS & DISCUSSION
Upon the laser irradiation, PS nanoparticles were trapped in the focal volume of about 1 μm3, and a small nanoparticle assembly was formed. Further laser irradiation into the small assembly caused its growth toward the outside of the focal spot. Figure 2a shows transmission images of nanoparticle assemblies prepared by the 180-sec irradiation at 1.4, 1.1 and 0.8 W in the individual colloidal solutions. The assembly size became large with the increase in the laser power. It should be noted that each resultant assembly showed structural color in its central part. This result means that constituent nanoparticles are periodically arrayed in the assembly. It was dark in the middle part of the assembly, whereas its boundary area looked bright. We consider that the assembly possibly becomes thin with the increase in distance from the focal spot, and that white light for the illumination can efficiently pass through the peripheral part of the assembly. The diffusion of nanoparticles toward the surrounding solution was observed at the edge part of the assembly. The observation of the nanoparticle diffusion at the assembly edge enabled us to estimate the assembly size from the transmission image. Figure 2b represents the time evolution of the assembly diameter at each laser power. The assembly diameter was measured at 40–180 sec from the beginning of the irradiation, when a circular assembly was symmetrically grown. In the initial 30 sec, a few aggregates were elongated from the focal spot and randomly swung around the focus.13 Because of this behavior, we could not estimate the assembly size. After that, the elongated aggregates were merged to each other, and one circular assembly was formed and grown continuously. The irradiation at the higher laser power induced the faster growth of the assembly. Accordingly, the assembly size after the 180-sec irradiation became large with the increase in the laser power. It should be noted here that the assembly growth extending to the outside of the focal spot depended on the laser power, in spite that only the assembly central part was directly irradiated by the laser.
Figure 2: (a) The transmission images of the nanoparticle assemblies prepared by the 180-sec laser irradiation into the
colloidal solution at (i) 1.4 W, (ii) 1.1 W, and (iii) 0.8 W. (b) The time evolution of the diameter of the nanoparticle assemblies.
18 8 0 400 500 800 700 Wavelength (nm) 180s 180 s 110 s 120 s 100 s 20 s Os 800 18 500 800 700 800 Wavelength (nm) 18 8 0 400 500 800 700 Wavelength (nm) 800 (b) e e ÿ 12 0. 0.4 0500 600 700 Wavelength (nm)
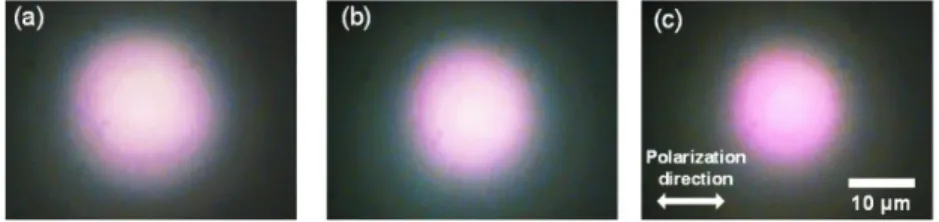
In order to detect structural color of the assembly more clearly, we utilized the backscattering imaging and the reflection microspectroscopy. For these measurements, the sample was illuminated from its bottom by introducing white light to the objective lens. Figure 3 shows the backscattering images of the nanoparticle assemblies formed by the 180-sec irradiation at 1.4, 1.1, and 0.8 W. The coloration means that nanoparticles in the assembly are periodically arrayed over the whole assembly region. The colored area became large with the increase in the laser power. This result is consistent with that on the assembly size observed in the transmission imaging. At the relatively higher laser power (Figures 3a and 3b), their backscattering images showed pale yellow in the central part of the assembly. At the lowest laser power (Figure 3c), the assembly seemed red color. This result implies that the assembly prepared at the higher laser power shows a reflection band located at shorter wavelength. Incidentally, the color observed here was different from that reported in our recent paper.13 This is due to the difference in the wavelength dependence of sensitivity of the CCD cameras.
Figure 3: The backscattering images of the nanoparticle assemblies formed by the 180-sec laser irradiation into the
colloidal solution at (a) 1.4 W, (b) 1.1 W, and (c) 0.8 W.
The reflection microspectroscopy enabled us to monitor a spectrum of the structural color in the central part of the assembly. The trapping laser was irradiated into the solution surface layer at 1.4, 1.1 or 0.8 W, and a reflection spectrum was measured at every 20 sec with the accumulation time of 0.5 sec. Figure 4a shows the time evolution of reflection spectra under respective trapping conditions. Upon the laser irradiation, a wide reflection band appeared at 550–750 nm. This reflection band should be ascribed to the assembling of nanoparticles in a periodic manner at and around the focal spot. With the laser irradiation, the peak position of the reflection band was shifted to short wavelength, accompanied by the increase in the reflectance. The spectral change was continued for about 2 min and then almost saturated. Since the blue-shift of the peak wavelength is ascribed to the decrease in the distance among nanoparticles,13,15 this result means that the nanoparticle packing structure gradually becomes tight during optical trapping and reaches an equilibrium state at a certain time. Figure 4b shows the normalized reflection spectra that were obtained by the 180-sec irradiation of respective laser power. The assemblies formed by the irradiation at 1.4, 1.1, and 0.8 W showed the reflection peaks positioned at 595, 600, and 620 nm, respectively. Thus, the reflection band appeared at short wavelength with the increase in the laser power. These laser power-dependent reflection spectra indicate that the nanoparticles are confined in the assembly more tightly under the irradiation at the higher power.
Figure 4: (a) The time evolution of reflection spectra of the nanoparticle assemblies under the laser irradiation at (i) 1.4
(a) 1 5 0 5 0 500 550 600 650
Red shift b
Wavelength (nm) 700 (b) 660 t 620 a> 580 a 540 0 Power change 1.4 W 1.4 W 'a 1.0 W 5 10 15 Time (sec) 20It is of great interest to observe the spectral change responding to variation of the laser power. Figure 5a shows the representative result of the dynamic spectral change of a nanoparticle assembly. At first, the assembly was prepared by the 180-sec irradiation at 1.4 W, and then the laser power was reduced continuously to 0.7 from 1.4 W in 10 sec. Initially at 1.4 W, the peak position of a reflection band was observed at 595 nm. The peak position was shifted to long wavelength with the decrease in the laser power. Thus, the reflection spectrum was dynamically changed by varying the laser power. This red-shift of the peak wavelength can be explained from the viewpoint of the increase in the inter-particle distance.
Furthermore, we found that the spectral change can be controlled repetitively by the alternate variation of the laser power. Figure 5b shows the temporal change in the peak position of a reflection band during 18 sec, when the laser power was alternately varied between 1.4 and 1.0 W. The peak wavelength was red-shifted upon lowering the laser power from 1.4 to 1.0 W for 3 sec. Subsequently, the peak wavelength was recovered to the original position in 3 sec, when the power was increased to 1.4 W from 1.0 W. This red- and blue-shifts of a reflection band were induced in a repetitive manner. This result indicates that the assembly is temporarily formed by optical trapping and the particle distance in the assembly is controllable by tuning laser power.
Figure 5: (a) Reflection spectral change under the continuous decrease in laser power from 1.4 to 0.7 W in 10 sec. (b)
The time evolution of peak wavelength upon the alternate power change between 1.4 and 1.0 W.
Here, we discuss the optical trapping and assembling dynamics of nanoparticles at the solution surface layer depending on the laser power. In conventional optical trapping experiments inside the solution, the trapping targets are confined in the focal volume, and the resultant assembly usually has the size comparable to the focal volume. On the other hand, it is reported that the assembling rate is increased linearly with the laser power,8 because the trapping force becomes strong along with the power. Similarly in this experiment, the stronger trapping force generated at the higher laser power possibly results in the faster assembly growth. It is indispensable to discuss the mechanism of the assembly growth that proceeds at the outside of the focal spot, because the assembly peripheral area is not illuminated by the laser directly. As the most possible driving force for the assembly growth, we have suggested that the scattered laser can form optical potential at the outside of the focal spot.13 The trapping laser is scattered efficiently by a small nanoparticle assembly and/or at the solution surface, and the optical potential is extended laterally. Nanoparticles are attracted in the extended optical potential and trapped in the area larger than the focal volume.
In general, the optical potential is formed through interactions between the trapping laser and nanoparticles. When the number of nanoparticles in the optical potential is increased, the effective volume of nanoparticles becomes large, and the optical potential is deepened. Accordingly, more nanoparticles can be trapped in the potential. In addition, further trapping of nanoparticles causes the efficient scattering of the trapping laser, and the optical potential is broadened laterally from the focal spot while being deepened. This dynamic evolution of the optical potential possibly proceeds efficiently with the increase in the laser power. As the laser power is increased, the optical potential becomes deeper and broader, and nanoparticles are confined more tightly and in the larger area. Since nanoparticles used here are negatively charged, the distance among nanoparticles is adjusted under dynamic balance between the attractive optical trapping force and the electrostatic repulsive force among nanoparticles. This dynamic balance enables us to control the particle distance in the assembly by tuning laser power.
4. SUMMARY
We presented the optical trapping and assembling behavior of PS nanoparticles at the solution surface depending on the laser power. The laser irradiation induced the trapping of nanoparticles, and a small nanoparticle assembly was formed at the focal spot. The assembly grew toward the outside of the focus under the irradiation, and its growth proceeded more efficiently at higher laser power. The reflection microspectroscopy revealed that not only the assembly size but also packing structure of constituent nanoparticles strongly depended on the laser power. Under the irradiation at higher laser power, nanoparticles in the assembly were more tightly arranged with the shorter inter-particle distance. The dynamic balance between attractive optical force and repulsive electrostatic force among nanoparticles possibly determines the particle distance, which is controllable repetitively by changing the laser power. Our findings in this study will contribute to the development of optical trapping assembling in molecular and colloidal systems. Furthermore, spatiotemporal control of nanoparticle assembly by optimizing laser power will provide an opportunity to develop a potential preparation method of a colloidal crystal.
REFERENCES
[1] Ashkin, A., Dziedzic, J. M., Bjorkholm, J. E., and Chu, S., "Observation of a Single-Beam Gradient Force Optical Trap for Dielectric Particles," Opt. Lett. 11, 288–290 (1986).
[2] Ashkin, A., "History of Optical Trapping and Manipulation of Small-Neutral Particle, Atoms, and Molecules," IEEE J. Sel. Top. Quantum Electron 6, 841–856 (2000).
[3] Neuman, K. C. and Block, S. M., "Optical Trapping," Rev. Sci. Instrum. 75, 2787–2809 (2004).
[4] Ajito, K. and Torimitsu, K., "Single Nanoparticle Trapping Using a Raman Tweezers Microscope," Appl. Spectrosc. 56, 541–544 (2002).
[5] Jauffred, L., Richardson, A. C., and Oddershede, L. B., "Three-Dimensional Optical Control of Individual Quantum Dots," Nano Lett. 8, 3376–3380 (2008).
[6] Bosanac, L., Aabo, T., Bendix, P. M., and Oddershede, L. B., "Efficient Optical Trapping and Visualization of Silver Nanoparticles," Nano Lett. 8, 1486–1491 (2008).
[7] Tanaka, Y., Yoshikawa, H., and Masuhara, H., "Two-Photon Fluorescence Spectroscopy of Individually Trapped Pseudoisocyanine J-Aggregates in Aqueous Solution," J. Phys. Chem. B 110, 17906–17911 (2006).
[8] Singer, W., Nieminen, T. A., Heckenberg, N. R., and Rubinsztein-Dunlop, H., "Collecting Single Molecules with Conventional Optical Tweezers," Phys. Rev. E 75, 011916-1–5 (2007).
[9] Hotta, J., Sasaki, K., and Masuhara, H., "A Single Droplet Formation from Swelled Micelles by Radiation Pressure of a Focused Infrared Laser Beam," J. Am. Chem. Soc. 118, 11968–11969 (1996).
[10] Tsuboi, Y., Shoji, T., and Kitamura, N., "Optical Trapping of Amino Acids in Aqueous Solutions," J. Phys. Chem. C 114, 5589–5593 (2010).
[11] Tsuboi, Y., Shoji, T., Nishino, M., Masuda, S., Ishimori, K., and Kitamura, N., "Optical Manipulation of Proteins in Aqueous Solution," Appl. Surf. Sci. 255, 9906–9908 (2009).
[12] Yuyama, K., Sugiyama, T., and Masuhara, H., "Laser Trapping Dynamics of 200 nm-Polystyrene Particles at a Solution Surface," Proc. SPIE 8810, 88101V-1–7 (2013).
[13] Wang, S.-F., Yuyama, K., Sugiyama, T., and Masuhara, H., "Reflection Microspectroscopic Study of Laser Trapping Assembling of Polystyrene Nanoparticles at Air/Solution Interface," J. Phys. Chem. C in Press, (2015). [14] Ito, S., Sugiyama, T., Toitani, N., Katayama, G., and Miyasaka, H., "Application of Fluorescence Correlation
Spectroscopy to the Measurement of Local Temperature in Solutions under Optical Trapping Condition," J. Phys. Chem. B 111, 2365–2371 (2007).
[15] Bazin, G. and Zhu, X. X., "Formation of Crystalline Colloidal Arrays by Anionic and Cationic Polstyrene Particles," Soft Matter 6, 4189–4196 (2010).