Dental Calculus Image Based on Optical Coherence Tomography
Yao-Sheng Hsieh
1, Yi-Ching Ho
2,3, Shyh-Yuan Lee
2,3, Ching-Cheng
Chuang
4, Chun-Yang Wang
1, and Chia-
Wei Sun
5,1,*1
Department of Photonics, National Chiao-Tung University, Hsinchu, Taiwan, R.O.C.
2
School of Dentistry, National Yang-Ming University, Taipei, Taiwan, R.O.C.
3
Department of Stomatology, Taipei Veterans General Hospital, Taipei, Taiwan, R.O.C.
4
Institute of Biomedical Engineering, National Taiwan University, Taipei, Taiwan, R.O.C.
5
Biophotonics Interdisciplinary Research Center and Institute of Biophotonics, National Yang-Ming
University,
Taipei, Taiwan, R.O.C.
*[email protected]
Abstract: In this study, the dental calculus was characterized and imaged by means of swept-source optical coherence tomography (SSOCT). The refractive indices of enamel, dentin, cementum and calculus were measured as 1.625±0.024, 1.534±0.029, 1.570±0.021 and 1.896±0.085, respectively. The dental calculus lead strong scattering property and thus the region can be identified under enamel with SSOCT imaging. An extracted human tooth with calculus was covered by gingiva tissue as in vitro sample for SSOCT imaging.
Key words: Optical coherence tomography, periodontitis, subgingival calculus
INTRODUCTION
Optical coherence tomography (OCT) has been widely used in many clinical applications, including gastroenterology [1], ophthalmology [2], dermatology [3] and dentistry [4]. In dental science, OCT can be of a good tool for assessing early caries [5], oral cancer [6] and periodontal diseases [7]. Periodontitis is one of the major chronic infectious diseases in the oral cavity and the prevalence of the periodontitis is more than 50% among the population [8]. Besides, recent studies indicated that there exist certain correlations between periodontitis and various systemic diseases [9]. The traditional diagnosis of subgingival calculus is based on clinical examination by periodontal probing and radiographs. The poor reliability and reproducibility of periodontal probing makes it difficult to monitor the progression of periodontal destruction and the effects of treatments [10]. The radiography can determine the level of bone-related destruction but only for subgingival calculus that located on the proximal surface of tooth. In addition, the radiation exposure is accompanied with radiography measurement. OCT may provide a good periodontat monitoring tool because it is a non-invasive, non-destructive, non-radiated and real-time monitoring method. In this study, we demonstrate a subgingival calculus detection method based on swept-source OCT (SSOCT). The refractive indice of enamel, dentin,
cementum, an dental calculu 1. SSOCT sy A SSOCT sys interferomete detector was interfacing. 2. Refractive The refractive scattering sam are defined as Figure 2 show measurement as 1.503. Tab nd dental calc us diagnosis b stem
stem was buil er is adopted w s utilized for indices measu e index determ mple can be e s z and z’ and Figu ws the OCT im t. The refractiv ble 1 lists the r
culus were me based on SSOC
lt with 1310 n with two coup
interference
urement mines the opti
stimated from the refractive
ure 1 The SSOC mages of glass ve index of gl refractive indi easured for de CT. nm swept sour plers, one is 9 detection an ical property o m OCT measu e index is:
z
Z CT image of re s and enamel s ass was measu ces of enamel ental tissue ch RESULTS rce laser s a br 99:1 and anot nd then the d of material. In urement (shown
1
′
z
Z’ calc efractive index c samples. Each ured for syste l, dentin, ceme (a) haracterization roadband ligh ther is 50:50, data acquisiti n previous stud wn as Fig. 1).′
ulus tooth calculus schem h sample was em calibration entum and cal
n. The results
t source. The and two optic ion card was
dies [11], the The lengths o e of dental calc polished as a . The refractiv lculus. s show a good fiber-based M cal circulators s used for P refractive ind of upper part a culus.
thin slice for ve index of gla d feasibility o Mach- Zehnde s. The balance C-photodecto dex of a highly and lower par
SSOCT ass is known f r e r y rt
3. In-vitro den For feasibility to cover on th calculus origi measurement accurately. Th for noise supp image and the
DISCUSSIO We demonstr clinical diagn and cannot o drawbacks. T ntal calculus i y study of sub he tooth sampl inates higher r t. In clinical di he measured i pression and i e calculus reg ON AND CO rate a method nosis, the meth observe the c The refractive F imaging bgingival calcu le. Figure 3 sh refractive inde iagnosis, OCT image was po identifies the p ion is marked Fi ONCLUSIO
not only for hod presents a calculus on th index of tooth
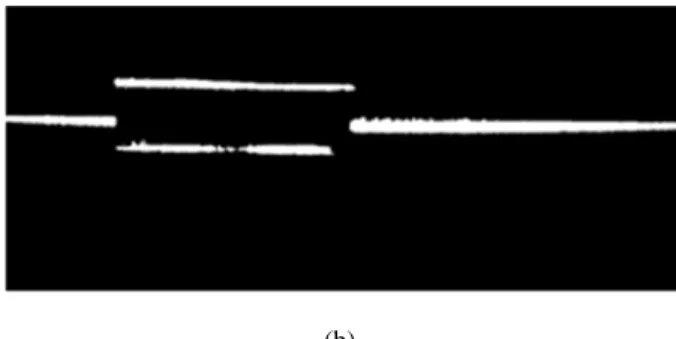
Fig. 2 SSOCT i
ulus detection hows the OCT ex than other t T image will p st-processed w position of cal d with red colo
Fig. 3 OCT im ig. 4 Post-proce ON carious but al advantages co he proximal s h tissue as ena (b) images of (a) g n, a piece of po T images of sa tooth tissues t provide a grea with anisotrop lculus edge. [ or. mage of subgin essed subgingiv
lso can be app ompare to conv surface of too amel, dentin, c lass, (b) ename orcine gingiva ample. Accord that result in s at help if the d pic diffusion fi 12] Figure 4 s ngival calculus.
val calculus ima
plied on subgi ventional X-ra oth. However cementum and l. a tissue with 0 ding to the refr
tronger backs ental calculus ilter, mid-valu shows the proc
age. ingival calculu ay imaging. X r, OCT imagi d calculus are 0.3 mm thickn fractive index scattering in O s region can b ue filter and th cessed subgin us detection i X-ray imaging ing can overc
1.625±0.024,
ness was used measurement OCT e highlighted hreshold filter ngival calculus in dentistry. In g is radioactive come the two , 1.534±0.029 t, r s n e o 9,
1.570±0.021 and 1.896±0.085, respectively. Calculus reveals a strongly scattering property that originated with high refractive index. The dental calculus region then can be marked with post-process. SSOCT can be a great assistance for dental calculus detection.
Table 1: Refractive indices of dental tissues.
Refractive index enamel 1.625 0.024 dentin 1.534 0.029 cementum 1.570 0.021 calculus 1.896 0.094 ACKNOWLEDGEMENT
This work was supported by the National Science Council of Taiwan under grants NSC 99-2221-E-010-011, NSC 99-2622-E-010-001-CC3, and NSC 98-2221-E-010-004.
REFERENCES
[1] J. M. Poneros, S. Brand, B. E. Bouma, G. J. Tearney, C. C. Compton and N. S. Nishioka, “Diagnosis of specialized intestinal metaplasia by optical coherence tomography”, Gastroenterology, vol. 120, issue 1, pp. 7~12, 2001.
[2] Y. Wang, B. A. Bower , J. A. Izatt, O. Tan and D. Huang, ” Retinal blood flow measurement by circumpapillary Fourier domain Doppler optical coherence tomography”, Journal of Biomedical Optics, vol.13, issue 6, 064003, 2008. [3] A. Pagnoni , A. Knuettel , P. Welker , M. Rist , T. Stoudemayer , L. Kolbe , I. Sadiq and A. M. Kligman, ” Optical coherence tomography in dermatology”, Skin Research and Technology, vol. 5, issue 2, pp.83~87, 2006.
10. B. W. Colston, Jr., U. S. Sathyam, L. B. DaSilva, M. J. Everett, P. Stroeve and L. L. Otis, “Dental OCT”, Optics Express, vol.3, no. 6, pp. 230~238, 1998.
[4] A. Baumgartner, S. Dichtl, C. K. Hitzenberger, H. Sattmann, B. Robl, A. Moritz, A.F. Fercher and W. Sperr, “Polarization-Sensitive Optical Coherence Tomography of Dental Structures”, Caries Research, vol. 34, no.1, pp.59~69, 2000.
[5] D. Fried , J. Xie, S. Shafi, J. D. B. Featherstone, T. M. Breunig, and C. Le, ” Imaging caries lesions and lesion progression with polarization sensitive optical coherence tomography”, Journal of Biomedical Optics, vol. 7, issue 4, 618, 2002.
Tomography for the Diagnosis of Oral Malignancy”, Lasers in Surgery and Medicine, vol.35, pp. 269~275, 2004. [7] X. Xiang, M. G. Sowa, A. M. Iacopino, R. G. Maev, M. D. Hewko, A. Man, and K. Z. Liu, “An update on novel non-invasive approaches for periodontal diagnosis”, Journal of Periodontology, vol. 81, no. 2, pp. 186~198, 2010. [8] A. Hugoson, B. Sjödin, and O. Norderyd, “Trends over 30 years, 1973-2003, in the prevalence and severity of periodontal disease”, Journal of Clinical Periodontology, vol. 35, no. 5, pp. 405~414, 2008.
[9] Y. S. Khader and Q. Ta'ani, ”Periodontal diseases and the risk of preterm birth and low birth weight: a metaanalysis”, Journal of Periodontology, vol. 76, no.2 pp. 161~165, 2005.
[10] D. M. Aeppli, J. R. Boen and C. L. Bandt, “Measuring and interpreting increases in probing depth and attachment loss”, Journal of Periodontology, vol. 56, no. 5, pp. 262~264, 1985.
[11] G. J. Tearney, M. E. Brezinski, J. F. Southern, B. E. Bouma, M. R. Hee, and J. G. Fujimoto, “Determination of the refractive index of highly scattering human tissue by optical coherence tomography”, Optics Express, vol. 20, issue 21, pp. 2258~2260, 1995.
[12] M. H. Le, C. L. Darling, and D. Fried, “Automated analysis of lesion depth and integrated reflectivity in PSOCT scan of tooth demineralization”, Lasers in Surgery and Medicine, vol. 42, issue 3, pp. 62~68, 2010