Intracellular signalling pathways
associated with the glucose-lowering
effect of ST36 electroacupuncture in
streptozotocin-induced diabetic rats
Chung-Yuh Tzeng,1,2 Yu-Chen Lee,3,4 Tin-Yun Ho,4 Ying-I Chen,5 Tai-Hao
Hsu,5 Jaung-Geng Lin,4 Kuan-Rong Lee,2* Shih-Liang Chang4,5*
1Department of Orthopedics, Taichung Veterans General Hospital, Taichung
City, Taiwan
2Institute of Molecular Medicine, College of Life Science, National Tsing Hua
University, Hsinchu City, Taiwan
3Department of Acupuncture, China Medical University Hospital, Taichung
City, Taiwan
4School of Chinese Medicine, China Medical University, Taichung City,
Taiwan
5Department of Medicinal Botanicals and Health Applications, Da-Yeh
University, Changhua County, Taiwan
*Corresponding authors: Professor Kuan-Rong Lee and Professor Shih-Liang Chang, M.D., Ph.D. Tel: +886-4-8511888 ext. 6232 or 6230 1 2 3 4 5 6 7 8 9 10 11 12 13 14 15 16 17 18 19 20 21
Fax: +886-4-8346349 E-mail: [email protected]
Address: No. 168, University Rd., Dacun, Changhwa County, Taiwan.
Abstract
Background and Aim: Previous animal studies reported the hypoglycemic
effect of electroacupuncture (EA) and the mechanisms were close relationship to intracellular signaling pathways. The aim of this study is to screen the possible effective intracellular signaling pathways of EA on bilateral Zusanli acupuncture point (ST36) by microarray in rats with diabetes.
Methods and Materials: Streptozotocin (STZ) rats with diabetes were
randomly assigned to the experimental (EA) group or the control (non-EA) group. The exploratory methods for analysis in this study were the following points: (i) detecting plasma glucose levels (ii) finding out the specific difference of pathway analysis by microarray in rats' gastrocnemius muscle between the EA and non-EA group..
Results: The pathway analysis of microarray showed that the cell adhesion
molecules with statistic significance between the EA and non-EA group in STZs with diabetes with p<0.05. The cell adhesion molecules might be related to the hypoglycemic effect of STZ rats with diabetes induced by EA.Conclusions: Using microarray would be helpful in screening the possible targets of signaling pathways. The hypoglycemic effect of EA was close relative to insulin and relative intracellular signal pathways. Further research will be required to determine the details of the intracellular signaling pathways
1 2 3 4 5 6 7 8 9 10 11 12 13 14 15 16 17 18 19 20 21 22
of the hypoglycemic effect induced by EA.
Keywords: Electroacupuncture (EA), Streptozotocin (STZ), Zusanli
acupuncture point (ST36), microarray
Introduction
In our previous investigation of the hypoglycemic effect using electroacupuncture (EA), we found that a specific EA frequency applied at the bilateral Zusanli acupuncture points (ST36) can induce a significant plasma glucose-lowering effect. the mechanism by which plasma glucose levels were lowered was the promotion of β-endorphin secretion which can stimulate the secretion of insulin, thereby reducing plasma glucose. In an adrenalectomy animal model, we found that 15Hz EA stimulating on the Zhongwan acupuncture point exerts a plasma glucose-lowering effect. The previous serial results showed that application of EA at the ST36 acupuncture points can obtain a superior plasma glucose level-lowering effect compared with that obtained using EA on the Zhongwan acupuncture point. In a type I diabetes mellitus (DM) rat model, 15Hz EA was applied at the Zusanli acupuncture point and a hypoglycemic effect was found, which could be blocked by atropine. The mechanism of the hypoglycemic effect of EA had been shown to involve modulation of the cholinergic nerve Zhao et al. proposed that the immune response triggered by EA was caused by the release of acetylcholine by surrounding cholinergic nerves.
Investigations of the pathogenesis and mechanism of diabetes mellitus (DM)
1 2 3 4 5 6 7 8 9 10 11 12 13 14 15 16 17 18 19 20 21 22
have demonstrated the involvement of signal pathways related to the metabolism of glucose, such as those responsible for uptake and metabolism of glucose in specific organs. Many researches have been conducted on the roles of insulin receptor (IR) and glucose transporters (GLUT) in DM, and in recent years research efforts have been directed toward investigating peroxisome proliferator-activated receptors (PPAR) in the treatment of DM. Therefore, the main pathways involved in the action of IR and GLUT, as well as the expression of PPAR-related genes, have become the subject of considerable research interest. When 3T3-L1 cells are stimulated by insulin, they modulate the amount of GLUT in cell membranes via two different pathways to promote the intake of glucose into the intracellular space. The first pathway is via the activation of the IR-β subunit by insulin, after which, phosphorylation of the IR substrate occurs which activates phosphatidylinositol 3-kinase (PI3K), and finally, PI3K activates downstream protein kinase C (PKC) and Akt to promote the transportation of GLUT and glucogenesis. The second pathway is via the activation of Ras by stimulation of insulin, and activation of transcription factors (such as PPAR and AP-1) of mitogen-activated protein kinase (MAPK)-related pathways to lower blood sugar by increasing production of GLUT-4. Once GLUT-4 has been induced by insulin, it is then transported from the intra-cellular space to the plasma membrane. GLUT plays an important role in the regulation of the insulin signaling pathway, and is regarded as an important biomarker in the study of DM.
1 2 3 4 5 6 7 8 9 10 11 12 13 14 15 16 17 18 19 20 21 22
Acquisition of all gene expression data in biological bodies can be achieved using the microarray method in one experiment. The results can then be analyzed to determine the possible main pathways and identify potential therapeutic targets. In a study by Gao et al., 1Hz EA was applied on the Zusanli acupuncture point in rats and microarray analysis was conducted to identify differences in the analgesic effect among individual rats. Chae et al. used the cDNA microarray to identify differences in acupuncture analgesia. To date, few studies have used microarray to investigate the molecular mechanism of reducing blood sugar by EA. We designed an IDDM animal model to study the molecular mechanism of reducing blood sugar by EA. The potential cellular mechanisms underlying the activation of the glucose transport system in response to EA have not yet been studied in animal skeletal muscle preparations. Therefore, the purposes of the present investigation were to screen the ability of EA to activate the possible relative intracellular signaling pathways of the hypoglycemic effect in isolated muscles from STZ rats using microarray analysis. 1 2 3 4 5 6 7 8 9 10 11 12 13 14 15 16 18 19 20 21 22 23
1 2
Research design and Methods
2.1. Animal Model. Normal male Wistar rats weighing approximately 250–350
g and aged 8–10 weeks were purchased from the BioLASCO animal center. Type 1, insulin-dependent diabetes was induced by administration of STZ 60 mg/kg, i.v. via the femoral vein on the third day of a 3-day fasting period as described previously. Animals were housed in plexiglass cages at a constant room temperature of 22 ± 2◦C with a relative humidity of 65 ± 5%. Rats were fed standard rat chow and were given free access to water. Animals were randomly assigned to the experimental group or the control group after an adaptation period of one week, and all the animals in this study were anesthetized using pentobarbital (40 mg/kg i.p.). All animals were treated in accordance with the National Institutes of Health (NIH) Guide for the Care and Use of Laboratory Animals, and the study protocol was approved by the ethics committee of China Medical University, Taichung, Taiwan.
2.2. Electroacupuncture (EA). Acupuncture points were located according to
measurement of body length as described previously. The ST36 acupuncture point was located on the anterior tibia muscle at approximately the upper 1/6 of the length of the lower leg below the knee. Bilateral ST36 acupuncture points were punctured in a vertical and deep manner with 1.27 cm, 32 gauge acupuncture needles (U Kwong Co Ltd.). After a 5-min needling period and needling 2 mm depth, EA was performed for 60 minutes at a frequency of 15Hz
1 2 3 4 5 6 7 8 9 10 11 12 13 14 15 16 17 18 19 20 21 22
with amplitude of 10 mA using a HANS LY257 acupuncture point and nerve stimulator (Healthtronics, Singapore).
2.3. Experimental Protocol.
To assay the Hypoglycemic Effect of EA, STZ-induced rats with diabetes (N=16) were randomly divided into the EA group (N=8) and the control group (N=8). Animals in the EA group were anesthetized and then subjected to EA for 60 min. Rats in the control group were anesthetized but were not treated with EA. Blood was taken for glucose testing prior to the experiment and at 30 and 60 min, as previously described. At the end of treatment (60 min) in each group, portions of the gastrocnemius muscles were taken as samples for analysis of RNA extraction.
2.4. Plasma Glucose Assay. Animals were anesthetized using pentobarbital (40
mg/kg i.p.). Approximately 0.3–0.5 ml of blood was obtained from a femoral vein using a 1 ml syringe containing heparin. The collected blood was introduced into Eppendorf tubes, lightly shaken and then stored on ice. Following centrifugation at 21880 Xg for 5 min, a Glucose UV reagent (Raichem, USA) was added to test the amount of biological index glucose contained in the serum. The content was measured using a fully automatic biochemical analyzer (Roche COBAS-MIRA-PLUS, USA).
1 2 3 4 5 6 7 8 9 10 11 12 13 14 15 16 17 18 19 20 21 22
2.5. Total RNA extraction. Total RNA was extracted from skeletal muscle
using an RNeasy Mini kit (Qiagen, Valencia, CA). The total RNA was quantified using the Beckman DU800 spectrophotometer (Beckman Coulter, Fullerton, CA). Samples with A260/A280 ratios greater than 1.8 were further evaluated using an Agilent 2100 Bioanalyzer (Agilent Technologies, Santa Clara, CA). RNA samples with an RNA integrity number greater than7.0 were accepted for the subsequent microarray analysis.
2.6. Microarray analysis. Microarray analysis was performed as previous
method. Briefly, after purification, 750 ng of cDNA was hybridized to the Illumina Sentrix RatRef-12 BeadChip microarray (Illumina Inc., San Diego, CA, USA) representing about 22,000 genes, following a standard protocol of Illumina Whole Genome Gene Expression with IntelliHyb, revision A. Hybridization was detected using 1 µg/ml Cy3-streptavidin (GE Healthcare, Little Chalfont, UK). The array was scanned with a BeadArray Reader (Illumina). Expression values were generated with Bead Studio 2.3.1 software (Illumina).The significant sites of gene would follow the standard protocol, such as the normalization and multiple comparison. We selected the Benjamin Hochberg False Discovery Rate(BH-FDR) as the multiple comparison for controlling the false discovery rate under 5%, which was shown the FDR<0.05.
2.7. The relationship between formula treatments and MeSH disease terms
1 2 3 4 5 6 7 8 9 10 11 12 13 14 15 16 17 18 19 20 21 22
The diseases-genes gene sets were built based on the downloadable data from the genetic association database according to Medical Subject Headings (MeSH) terms (http://www.nlm.nih.gov/mesh/meshhome.html). There were 735 MeSH disease terms used in this analysis. To evaluate the possible MeSH disease terms altered by EA treatments, we performed the “geneSetTest” to detect differential expression for groups of genes involved in MeSH disease terms. This function computed a p-value to test the hypothesis that the selected genes tend to be differentially expressed. We calculated the score for each MeSH disease term in EA treatments as the negative logarithm of its p-value computed by “geneSetTest” function. The rank of MeSH disease terms for EA treatments were sorted in descending order of MeSH disease term scores in each formula treatment. We calculated the average rank for each MeSH disease term in EA treatments and the weighted MeSH disease term scores in EA treatment were calculated by multiplying the original MeSH disease term scores with a ratio of the rank of MeSH disease terms over the average rank of those MeSH disease terms.
2.8. Statistical Analysis. All values are expressed as mean ± SE. Area under the
curve (AUC) was calculated for comparisons using the statistical software, MedCalc. Differences in mean values between the experimental group (EA) and the control group (non-EA) were determined using the Student’s t-test, and the
p value were performed as significant, *p<0.05 . A self-paired t-test was used to
1 2 3 4 5 6 7 8 9 10 11 12 13 14 15 16 17 18 19 20 21 22
determine significant changes in levels of plasma indicators before and after treatment. For all comparisons, a p value < 0.05 (two-sided) was considered to represent statistical significance. The multiple comparison was used the Benjamin Hochberg False Discovery Rate(BH-FDR) for adjustment the false discovery rate under 0.05 which would be applied in exploration of differential gene expression between EA treated and control group, and the pathway analyses of differential genes using web-based tool.
1 2 3 4 5 6 7
Results
3.1. Hypoglycemic Effects of EA on STZ Rats. STZ-induced rats with diabetes were
randomly and equally divided into an EA group and a control (non-EA) group. Rats in the EA group received EA at the Zusanli acupuncture point for 60 minutes. Rats in the control group did not receive EA. After 60 minutes, the mean plasma glucose level in the EA group was 178.5 ± 58.4 mg/dL and that in the control group was 369.6 ± 23.3 mg/dL. Also, the AUC of the EA group was 14769 ± 3239, and that in the non-EA group was 22179 ± 1691. The differences in plasma glucose level after 60 min and AUC values between the EA and non-EA groups were significant (p<0.05) (Figure 1).
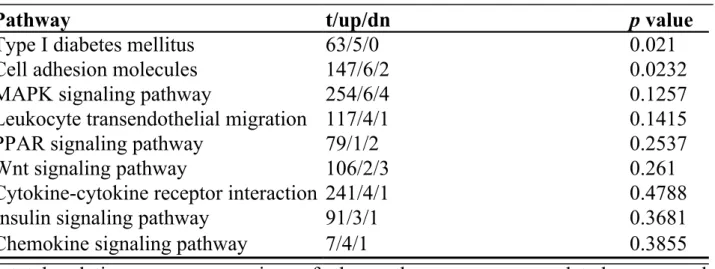
3.2. Pathway analysis of effect of EA on STZ rats. The EA-regulated gene sets in
rat muscle tissue revealed that type I DM, cell adhesion molecules, MAPK signaling pathway, leukocyte trans-endothelial migration, PPAR signaling pathway, Wnt signaling pathway, cytokine-cytokine receptor interaction, insulin signaling pathway, and chemokine signaling pathway were upregulated in muscle tissue (Table 1). Further, the relationship among the intracellular signaling pathways was proposed after EA stimulation; this relationship is shown in Figure 2.
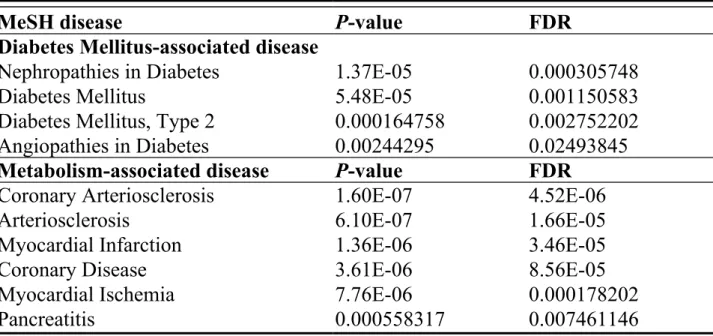
3.4. Gene-expression connection of EA on the STZ-rat with MeSH disease states
We next tested groups of altered genes in MeSH disease terms using the ‘‘geneSetTest’’ and false discovery rate (FDR) estimation for simple multiple testing
1 2 3 4 5 6 7 8 9 10 11 12 13 14 15 16 17 18 19 20 21 22
to establish whether the responses of muscle tissue to EA stimulation in the STZ-rat model were related to disease states. Ten of the 735 tested MeSH disease terms were found to be regulated (p<0.05) in muscle tissue. Based on their main features, the 10 disease terms were classified into two groups (Table 2). In group 1, the DM-associated diseases included nephropathy, type 1 DM, type 2 DM, and angiopathy; In group 2, metabolism-associated diseases included coronary arteriosclerosis, type 1 DM, type 2 DM, and angiopathy.
Discussion
In this study, EA applied on the Zusanli acupuncture point (ST36) in STZ rats reduced blood sugar. The experimental data showed a significant difference in blood glucose between the EA group and the non-EA group at 30- and 60-min time points, compared by t-test, p<0.05 (Figure 1). Also, greater hypoglycemic activity was noted in the EA group than in the non-EA group when the 60-min EA stimulation was finished. This experiment was designed to test not only the hypoglycemic effect
of EA but also the signal transduction pathways by microarray on the ST36 of STZ
rats with diabetes.
Microarray was used to analyze the possible signal pathways of the hypoglycemic effect induced by EA in this study. The partial gastrocnemius muscle of rats was harvested after application of 15Hz EA on the Zusanli (ST36) acupuncture point of STZ rats for microarray analysis. These data were digitalized and Kyoto Encyclopedia of Genes and Genomes (KEGG) pathway analysis was done. This
1 2 3 4 5 6 7 8 9 10 11 12 13 14 15 16 17 18 19 20 21 22
method was employed to study which gene groups involving associated signal pathways were affected by EA and to screen the relationships between these possible gene groups and DM (Table 1). The analysis revealed a number of possible pathways related to the hypoglycemic effect of EA. Type I DM, cell adhesion molecules, MAPK signaling pathway, leukocyte trans-endothelial migration, PPAR signaling pathway, Wnt signaling pathway, cytokine-cytokine receptor interaction, insulin signaling pathway and chemokine signaling pathway were found to be regulated in muscle tissue. According to the statistic result, only cell adhesion
molecules and type I diabetes mellitus were statistic significance with p<0.05. Based
on these results, we proposed a diagram (Figure 2) to explain the all possible signaling pathways that are related to the hypoglycemic effect of EA. Cell adhesion molecules showed significant difference after EA treatment in STZ-induced rats with diabetes by microarray analysis
According to a review of literature, we found cell adhesion molecules, leukocyte
trans-endothelial migration, cytokine-cytokine receptor interaction, and the chemokine signaling pathway were found in muscle tissue. These signaling pathways may be related to immune and inflammation responses . The significant change of cell adhesion molecules could be a possible pathway and effect after EA in STZ-induced rats, but we cannot rule out the possible inflammatory effect of muscle cell triggered by mechanical stimuli via EA.
In STZ rats with diabetes, the hypoglycemic effect of EA may enhance insulin signaling pathway transmission. This hypothesis was supported by the pathway
1 2 3 4 5 6 7 8 9 10 11 12 13 14 15 16 17 18 19 20 21 22
analysis result using microarray. Beside the insulin signaling pathway, the other possible signaling pathways found in microarray data analysis, such as MAPK signaling pathway, PPAR signaling pathway and/or Wnt signaling pathway, might be related to the hypoglycemic effect induced by EA, but there were no statistic significance in this study.
According to a review of the literature, the p38 MAPK subfamily may play a role in activating the insulin-dependent glucose transport system . A number of studies support the potential direct or indirect role of p38 MAPK in the regulation of the glucose transport system in insulin-sensitive tissues, including skeletal muscle , although this concept remains controversial .
The PPAR signaling pathway may also play a role in the hypoglycemic effect and enhance the insulin sensitivity of EA. In this study, microarray analysis showed that the PPAR signaling pathway might be involved in the hypoglycemic effect of EA that might relate to the subject of animal model and the type of diabetes. Further studies are needed to clarify this relationship.
Microarray analysis revealed that the Wnt signal pathway may be another possible pathway related to the hypoglycemic effect of EA. The Wnt/beta-catenin system is a glucose-responsive signaling system that plays a role in pathways involved in sensing changes in metabolic status. The existence of crosstalk between these pathways and Wnt/beta-catenin signaling in skeletal muscle hints at the exciting possibility that organ-selective modulation of Wnt signaling is taking place. Wnt signaling could be involved in the regulation of glucose homeostasis, and
Wnt/β-1 2 3 4 5 6 7 8 9 10 11 12 13 14 15 16 17 18 19 20 21 22
catenin signaling could induce GLUT-4 translocation to the plasma membrane through an insulin-independent pathway.
The pathway analysis of microarray showed that the cell adhesion molecules might be related to the hypoglycemic effect of STZ rats with diabetes induced by EA in this study. Different type of diabetic animal model should had different signal pathways significant involved.
1 2 3 4 5 6
Conclusion:
The signaling pathways of the hypoglycemic effect induced by EA on the ST36 acupuncture point of STZ rats with diabetes may be involved the insulin signaling pathway and other possible relative signaling pathways such as the PPAR signaling pathway, MAPK signaling pathway and Wnt signaling pathway, might be related to the hypoglycemic effect induced by EA. Type I DM, cell adhesion molecules, MAPK signaling pathway, leukocyte trans-endothelial migration, PPAR signaling pathway, Wnt signaling pathway, cytokine-cytokine receptor interaction, insulin signaling pathway and chemokine signaling pathway were found to be regulated in muscle tissue after EA treatment in STZ rats with diabetes, but there were only type
I diabetic mellitus and cell adhesion molecules with statistic significance. The use of
microarray would be helpful in screening the possible targets of signaling pathways.
The pathway analysis of microarray showed that the cell adhesion molecules might
be related to the hypoglycemic effect of STZ rats with diabetes induced by EA in
this study. Further research is required to obtain more evidence on the whole picture
of the hypoglycemic mechanism induced by EA.
1 2 3 4 5 6 7 8 9 10 11 12 13 14 15 16 17 18 19 20 21 22
List of abbreviations:
1. EA: electroacupuncture 2. STZ: Streptozotocin
3. GLUT: glucose transporter
4. PPAR: peroxisome proliferator activated receptors 5. PI3K: phosphatidylinositol 3-kinase
6. PKC: protein kinase C
7. MAPK: mitogen-activated protein kinase
1 2 3 4 5 6 7 8
References
1. Chang SL, Lin JG, Chi TC, Liu IM, Cheng JT. An insulin-dependent hypoglycaemia induced by electroacupuncture at the Zhongwan (CV12) acupoint in diabetic rats. Diabetologia. 1999;42(2):250-5.
2. Lin J, Chang SL, JT. C. Release of beta-endorphin from adrenal gland to lower plasma glucose by the electroacupuncture at Zhongwan acupoint in rats. Neuroscience Lett. 2002;326(1):17-20.
3. Lin JG, Chen WC, Hsieh CL, Tsai CC, Cheng YW, Cheng JT, et al. Multiple sources of endogenous opioid peptide involved in the hypoglycemic response to 15 Hz electroacupuncture at the Zhongwan acupoint in rats. Neurosci Lett. 2004;366(1):39-42.
4. Lee YC, Li TM, Tzeng CY, Chen YI, Ho WJ, Lin JG, et al. Electroacupuncture at the Zusanli (ST-36) Acupoint Induces a Hypoglycemic Effect by Stimulating the Cholinergic Nerve in a Rat Model of Streptozotocine-Induced Insulin-Dependent Diabetes Mellitus. Evidence-based complementary and alternative medicine : eCAM. 2011;2011:650263.
5. Zhao X. [Effect of HC-3 on electroacupuncture-induced immunoregulation]. Zhen Ci Yan Jiu. 1995;20(2):59-62.
6. Rosenson RS. Effects of peroxisome proliferator-activated receptors on lipoprotein metabolism and glucose control in type 2 diabetes mellitus. Am J Cardiol. 2007;99(4A):96B-104B.
7. Furtado LM, Somwar R, Sweeney G, Niu W, Klip A. Activation of the glucose transporter GLUT4 by insulin. Biochemistry and cell biology = Biochimie et biologie cellulaire. 2002;80(5):569-78.
8. Le Roith D, Zick Y. Recent advances in our understanding of insulin action and insulin resistance. Diabetes care. 2001;24(3):588-97.
9. Bryant NJ, Govers R, James DE. Regulated transport of the glucose transporter GLUT4. Nat Rev Mol Cell Biol. 2002;3(4):267-77.
10. Gao YZ, Guo SY, Yin QZ, Hisamitsu T, Jiang XH. An individual variation study of electroacupuncture analgesia in rats using microarray. Am J Chin Med. 2007;35(5):767-78.
11. Chae Y, Park HJ, Hahm DH, Yi SH, Lee H. Individual differences of acupuncture analgesia in humans using cDNA microarray. The journal of physiological sciences : JPS. 2006;56(6):425-31.
12. Chang SL, Lin KJ, Lin RT, Hung PH, Lin JG, Cheng JT. Enhanced insulin sensitivity using electroacupuncture on bilateral Zusanli acupoints (ST 36) in rats. Life sciences. 2006;79(10):967-71.
13. Romita VV, Yashpal K, Hui-Chan CW, Henry JL. Intense peripheral electrical stimulation evokes brief and persistent inhibition of the nociceptive tail withdrawal reflex in the rat. Brain research. 1997;761(2):192-202.
14. Cheng WY, Hsiang CY, Bau DT, Chen JC, Shen WS, Li CC, et al. Microarray analysis of vanillin-regulated gene expression profile in human hepatocarcinoma cells. Pharmacological research : the official journal of the Italian Pharmacological Society. 2007;56(6):474-82.
15. Cheng WY, Wu SL, Hsiang CY, Li CC, Lai TY, Lo HY, et al. Relationship Between San-Huang-Xie-Xin-Tang and its herbal components on the gene expression profiles in HepG2 cells. The American journal of Chinese medicine. 2008;36(4):783-97.
16. Benjamini Y HY. Controlling the false discovery rate: a practical and powerful approach to multiple testing.
1 2 3 4 5 6 7 8 9 10 11 12 13 14 15 16 17 18 19 20 21 22 23 24 25 26 27 28 29 30 31 32 33 34 35 36 37
Journal of the Royal Statistical Society. 1995;Vol.57 No.1:289-300.
17. Shepherd PR, Kahn BB. Glucose transporters and insulin action--implications for insulin resistance and diabetes mellitus. The New England journal of medicine. 1999;341(4):248-57.
18. Sweeney G, Somwar R, Ramlal T, Volchuk A, Ueyama A, Klip A. An inhibitor of p38 mitogen-activated protein kinase prevents insulin-stimulated glucose transport but not glucose transporter translocation in 3T3-L1 adipocytes and L6 myotubes. The Journal of biological chemistry. 1999;274(15):10071-8.
19. Somwar R, Perreault M, Kapur S, Taha C, Sweeney G, Ramlal T, et al. Activation of p38 mitogen-activated protein kinase alpha and beta by insulin and contraction in rat skeletal muscle: potential role in the stimulation of glucose transport. Diabetes. 2000;49(11):1794-800.
20. Konrad D, Somwar R, Sweeney G, Yaworsky K, Hayashi M, Ramlal T, et al. The antihyperglycemic drug alpha-lipoic acid stimulates glucose uptake via both GLUT4 translocation and GLUT4 activation: potential role of p38 mitogen-activated protein kinase in GLUT4 activation. Diabetes. 2001;50(6):1464-71.
21. Geiger PC, Wright DC, Han DH, Holloszy JO. Activation of p38 MAP kinase enhances sensitivity of muscle glucose transport to insulin. American journal of physiology Endocrinology and metabolism. 2005;288(4):E782-8. 22. Somwar R, Koterski S, Sweeney G, Sciotti R, Djuric S, Berg C, et al. A dominant-negative p38 MAPK mutant and novel selective inhibitors of p38 MAPK reduce insulin-stimulated glucose uptake in 3T3-L1 adipocytes without affecting GLUT4 translocation. The Journal of biological chemistry. 2002;277(52):50386-95.
23. Kayali AG, Austin DA, Webster NJ. Stimulation of MAPK cascades by insulin and osmotic shock: lack of an involvement of p38 mitogen-activated protein kinase in glucose transport in 3T3-L1 adipocytes. Diabetes. 2000;49(11):1783-93.
24. Fujishiro M, Gotoh Y, Katagiri H, Sakoda H, Ogihara T, Anai M, et al. MKK6/3 and p38 MAPK pathway activation is not necessary for insulin-induced glucose uptake but regulates glucose transporter expression. The Journal of biological chemistry. 2001;276(23):19800-6.
25. Ho RC, Alcazar O, Fujii N, Hirshman MF, Goodyear LJ. p38gamma MAPK regulation of glucose transporter expression and glucose uptake in L6 myotubes and mouse skeletal muscle. American journal of physiology Regulatory, integrative and comparative physiology. 2004;286(2):R342-9.
26. Anagnostou SH, Shepherd PR. Glucose induces an autocrine activation of the Wnt/beta-catenin pathway in macrophage cell lines. The Biochemical journal. 2008;416(2):211-8.
27. Abiola M, Favier M, Christodoulou-Vafeiadou E, Pichard AL, Martelly I, Guillet-Deniau I. Activation of Wnt/beta-catenin signaling increases insulin sensitivity through a reciprocal regulation of Wnt10b and SREBP-1c in skeletal muscle cells. PloS one. 2009;4(12):e8509.
1 2 3 4 5 6 7 8 9 10 11 12 13 14 15 16 17 18 19 20 21 22 23 24 25 26 27 28 29 30 31 32
Acknowledgements:
The authors would like to thank Miss Xin-Ping Ku for her assistance.
Conflict of Interest statement
The author(s) declare that they have no competing interests.
Contribution of authors:
CYT and SLC carried out the study design, data interpretation, literature review, and manuscript preparation; YIC assisted with the experimental work and data collection; CYT and YCL provided assistance in applying for the supporting grant; THH and TYH provided an excellent research environment and participated in discussion and coordination; JGL, KRL and SLC supervised the work, evaluated the data, and corrected the manuscript for publication. All authors read and proved the final manuscript.
Financial support
This study was supported by grants provided by National Science Council (NSC101-2320-B-039-020, NSC101-2632-E-212-001-MY3), Taichung Veterans General Hospital and DaYeh University joint project (TCVGH-DYU-1018303) and China Medical University Hospital (DMR-100-003) in Taiwan.
Authors' information 1 2 3 4 5 6 7 8 9 10 11 12 13 14 15 16 17 18 19 20 21 22
1. CYT:[email protected] 2. YCL:[email protected] 3. TYH:[email protected] 4. YIC:[email protected] 5. THH:[email protected] 6. JGL: [email protected] 7. KRL: [email protected] 8. SLC:[email protected] 1 2 3 4 5 6 7 8
Table 1. Pathway analysis
Pathway t/up/dn p value
Type I diabetes mellitus 63/5/0 0.021
Cell adhesion molecules 147/6/2 0.0232
MAPK signaling pathway 254/6/4 0.1257
Leukocyte transendothelial migration 117/4/1 0.1415
PPAR signaling pathway 79/1/2 0.2537
Wnt signaling pathway 106/2/3 0.261
Cytokine-cytokine receptor interaction 241/4/1 0.4788
Insulin signaling pathway 91/3/1 0.3681
Chemokine signaling pathway 7/4/1 0.3855
t=total relative gene expression of the pathway; up=up-regulated gene and dn=down-regulated gene after EA were compared to control group (non-EA); fc=fold change, The fold change more than 1.5 (fc>=1.5) means up-regulated gene and less than 1.5 (fc<1.5) means down-regulated gene. The possible signal pathway and molecules found to be regulated in muscle tissue after EA treatment in STZ rats with diabetes were also shown. Only type I diabetic mellitus and cell adhesion molecule with statistical significance were noted (p< 0.05).
1 2 3 4 5 6 7 8 9 10
Table 2. Disease analysis
MeSH disease P-value FDR Diabetes Mellitus-associated disease
Nephropathies in Diabetes 1.37E-05 0.000305748
Diabetes Mellitus 5.48E-05 0.001150583
Diabetes Mellitus, Type 2 0.000164758 0.002752202
Angiopathies in Diabetes 0.00244295 0.02493845
Metabolism-associated disease P-value FDR
Coronary Arteriosclerosis 1.60E-07 4.52E-06
Arteriosclerosis 6.10E-07 1.66E-05
Myocardial Infarction 1.36E-06 3.46E-05
Coronary Disease 3.61E-06 8.56E-05
Myocardial Ischemia 7.76E-06 0.000178202
Pancreatitis 0.000558317 0.007461146
FDR=false discovery rate
1
2 3 4 5
Figure Legends
Figure 1. The plasma glucose-lowering effect of EA applied to the bilateral Zusanli acupuncture points on STZ rats.
EA was applied after 12 hours of fasting; the non-EA condition was the same but without EA. Comparisons of plasma glucose levels at 30 and 60 minutes between the EA and non-EA groups, **p<0.01 by Student’s t-test.
Figure 2. The relationship of the possible intracellular signaling pathways by microarray screen.
Cell adhesion molecules might play a main role in hypoglycemic effect of STZ-induced diabetic type 1 DM elicited by EA on the ST36 acupuncture points. Although there is no statistical significance in the other six pathways, that may have central relationship to the insulin signaling pathway after using the insulin broken STZ-diabetic model. 1 2 3 4 5 6 7 8 9 10 11 12 13 14 15