Introduction
Obesity is an epidemic problem in most industrialized countries and is also a growing public health problem in Taiwan with nearly one quarter of the adult popula-tion currently overweight or obese1. The prevalence of overweight and obese individuals is particularly high
in the elderly. In Taiwan, 48.3% of men and 57.2% of women aged 60–69 years are either overweight or obese (defined as body mass index [BMI] ≥ 24 kg/m2)2. Obesity is associated with diverse health risks, such as increased incidence of diabetes mellitus and coronary heart disease, and mortality of cardiovascular diseases (CVD)3,4. However, the role of body weight as a risk factor for death remains controversial.
Being overweight or obese was positively associ-ated with an increased risk of all-cause mortality in the Cancer Prevention Study II5. The rate of death was lowest among men with a BMI of 23.5–24.9 and among women with a BMI of 22.0–23.4. However, in the
B
ODY
M
ASS
I
NDEX AS A
P
REDICTOR OF
M
ORTALITY IN
O
LDER
P
EOPLE IN
T
AIWAN
Lee-Ching Hwang1,2, Su-Chiu Chen3, Jin-Jin Tjung1, Hung-Yi Chiou4*, Chien-Jen Chen5, Cheng-Ho Tsai6
1Department of Family Medicine, Mackay Memorial Hospital, 2Mackay Medicine, Nursing and Management College, 3Department of Health Care Management, National Taipei College of Nursing, 4School of Public Health, Taipei Medical
University, 5Graduate Institute of Epidemiology, College of Public Health, National Taiwan University, and 6Division of Cardiology, Department of Medicine, Mackay Memorial Hospital, Taipei, Taiwan.
SUMMARY
Background: Obesity is associated with diverse health risks, but its role as a risk factor for death remains con-troversial in the elderly. This study estimated the association of body mass index (BMI) with the risk of death from any cause and from specific diseases in elderly Taiwanese.
Methods: The Six-Community Hypertension Intervention Project Study, a nationwide population-based cohort, was conducted in 1982 and followed up for 23 years. Cause of death was ascertained by review of death certifi-cate files. Proportional hazards models were used to evaluate the association between the baseline BMI and risk of death.
Results: Of 1,568 participants aged 65 years (range, 60–75 years) at study entry, 1,085 (69%) died during follow-up. The relationship between death from any cause and BMI follows a J-shaped pattern. Increasing BMI categories were associated with increased risk of all-cause mortality (BMI, 25–26.9: hazard ratio, HR, 1.36; 95% confidence interval, CI, 1.11–1.67; BMI ≥ 27: HR, 1.46; 95% CI, 1.15–1.85). Death from diabetes, cardiovascular diseases or cancer increased progressively with increasing categories of BMI, and HRs were significantly increased at BMI levels > 23.0 kg/m2(BMI, 23–24.9: HR, 1.29; 95% CI, 1.05–1.60; BMI, 25–26.9: HR, 1.58; 95% CI, 1.21–2.05;
BMI ≥ 27: HR, 1.74; 95% CI, 1.29–2.35). These associations were more obvious in men than in women.
Conclusion: This study found that BMI > 25 kg/m2was a significant independent predictor of all-cause
mortal-ity, especially among older men. BMI > 23 kg/m2also increased risk of mortality from cancer, cardiovascular
diseases and diabetes. The relationship was J-shaped in older Taiwanese. [International Journal of Gerontology 2009; 3(1): 39–46]
Key Words: body mass index, elderly, mortality, obesity, Taiwan
*Correspondence to: Professor Hung-Yi Chiou,
School of Public Health, Taipei Medical University, 250, Wu-Xin Street, Taipei, Taiwan.
E-mail: hychiou@tmu.edu.tw Accepted: January 11, 2009
National Health and Nutrition Examination Survey I, II or III, being overweight was not related to increased mortality6.
The effects of an increasing BMI on mortality risk are less pronounced in the elderly than in young and middle-aged adults7–13. Some studies found a greater BMI to be a risk factor for mortality, while others found different results. Of the 13 studies of individuals aged 65 years or older reviewed by Heiat et al.14in 2001, most showed a non-significant or even a negative asso-ciation between BMI and all-cause mortality. In 2006, Janssen et al.15published a literature review of 26 stud-ies examining the BMI–mortality relationship in the elderly. The findings of this meta-analysis showed that a BMI in the overweight range is not associated with a significantly increased risk of mortality, while a BMI in the obese range is only associated with a modest increase (about 10%) in mortality risk15.
Data are limited on the relationship between obe-sity and survival in the Taiwanese population. The aim of the present study was to examine the association of BMI with the risk of death from any cause and from specific diseases in the elderly in Taiwan.
Materials and Methods
Details of the Six-Community Hypertension Interven-tion Project (SCHIP) Study baseline cohort have been described previously16. This nationwide study was conducted in 1982 and followed up for 23 years. The initiated SCHIP data were collected in six communities in Taiwan from October 1982 to September 1983. A total of 7,763 subjects, representative of the general adult population in Taiwan through stratified system-atic clustering sampling, participated in a nationwide population-based survey. All subjects gave written in-formed consent for participation. Subjects were excluded if they were aged less than 60 years or older than 75 years, and if they had suffered stroke and were bed-ridden. To minimize the effect of existing medical con-ditions on the baseline BMI, we excluded subjects who died during the first 3 years of follow-up. The remaining 1,568 subjects were included in the analyses.
Data collection
Data on sociodemographic characteristics including sex, age, exercise habits, smoking habits, alcohol consump-tion, family history of cardiovascular-related diseases,
physician-diagnosed diseases and medication history were collected by trained public health workers during a home visit. During the visit, sitting blood pressure (BP), weight and height measurements were taken. BMI was calculated as: body weight (kg)/height (m)2.
Survival status and cause of death through December 31, 2006, was ascertained by review of death certificate files (documented underlying cause of death by the International Classification of Diseases, Ninth Revision [ICD-9], from the Department of Health in Taiwan) by a unique subject’s national identification number. A death was ascribed to CVD if the primary cause of death was CVD (ICD-9 codes 390–459). Cancer is defined as ICD-9 codes 140–239. Diabetes is defined as ICD-9 code 250. Death from bronchial or lung diseases is defined as ICD-9 codes 460–519.
Statistical analysis
Data were analyzed using SAS version 9 (SAS Institute Inc., Cary, NC, USA). These cutoffs of BMI values corre-sponded to the definition of overweight and obesity suggested by the 2000 World Health Organization Asian Pacific Guideline17. Subjects were classified into under-weight (BMI< 18.5 kg/m2), normal weight (BMI, 18.5– 22.9), overweight (BMI, 23–24.9), and obese (BMI≥ 25) at baseline. We divided the obesity group into two groups (BMI, 25–26.9, and BMI≥ 27) to match the def-inition of obesity (BMI≥ 27) suggested by the Depart-ment of Health in Taiwan.
Cox’s proportional hazards models were used to eval-uate the association between the baseline BMI and risk of death by adjusting for age, exercise habits, edu-cation level, alcohol drinking, and smoking status. Study subjects with normal BMI scores served as controls. The criteria for statistical significance were p< 0.05 and a 95% confidence interval (CI) of hazard ratios (HRs) that excluded 1.
Results
Sample characteristics
The mean age of the study cohort participants was 65.7± 4.0 years; 55.3% were men, 36.3% had a history of hypertension, and 17.5% had a history of diabetes. The characteristics of the study sample are summa-rized in Table 1. Overall mean BMI was 22.2±3.3kg/m2 (21.8±3.0kg/m2in men and 22.7±3.6kg/m2in women). The distribution of the study population categorized
according to the 2000 World Health Organization Asian Pacific Guideline is as follows: 11.6% were under-weight (BMI< 18.5 kg/m2), 54.3% were normal weight (BMI, 18.5–22.9 kg/m2), 17.5% were overweight (BMI, 23–24.9 kg/m2), and 16.5% were obese (BMI> 25.0 kg/ m2). Based on the categories of classification of the Department of Health in Taiwan, 6.6% of the cohort were obese.
Men had significantly higher rates of smoking and alcohol consumption than women. Men also had sig-nificantly higher levels of diastolic blood pressure than women, but lower BMI, fasting blood glucose and triglyceride levels.
BMI and mortality
Of the 1,568 participants aged 65 years (on average) at study entry (1982–83), 1,085 (69%) died during the 23 years of follow-up (Table 2). The rates of death from cancer in men were greater than in women (24.1% vs. 16.6%), but the rates of death from CVD in men were lower than in women (25.3% vs. 33.3%).
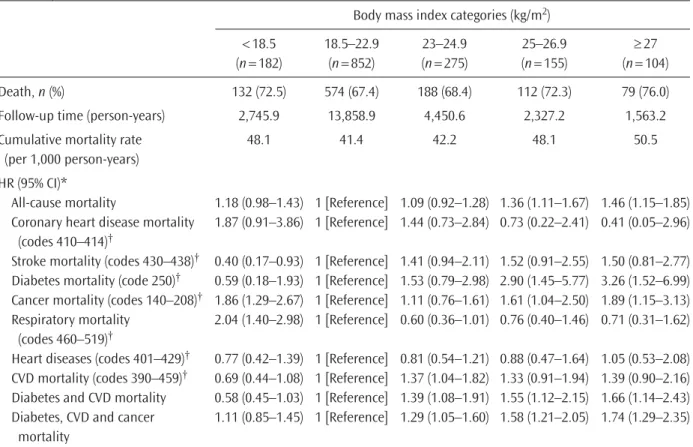
There were more deaths from all causes, cancer, diabetes and CVD in the higher BMI categories com-pared with the normal BMI classification. Excessive risk of death from cancer or lung diseases also was present
in the underweight group. The all-cause mortality (48.1 per 1,000 person-years) was significantly increased at BMI levels > 25.0 kg/m2 (Figure). Elevated BMI scores were associated with increased risks of all-cause mor-tality in adjusted analyses (BMI, 25–26.9: HR, 1.36; 95% CI, 1.11–1.67; BMI≥ 27: HR, 1.46; 95% CI, 1.15– 1.85). Deaths from diabetes, CVD or cancer increased progressively with increasing categories of baseline BMI, and HRs were significantly increased at BMI levels >23.0kg/m2(BMI, 23–24.9: HR, 1.29; 95% CI, 1.05–1.60; BMI, 25–26.9: HR, 1.58; 95% CI, 1.21–2.05; BMI≥ 27: HR, 1.74; 95% CI, 1.29–2.35).
Sex differences
The risk for all causes of death was not significantly different between women with BMI of 18.5–22.9 and those with BMI of 23–24.9 or > 25 (Table 3). There was also no difference in risk of cancer mortality in the over-weight and obese groups compared with the normal-weight group in women.
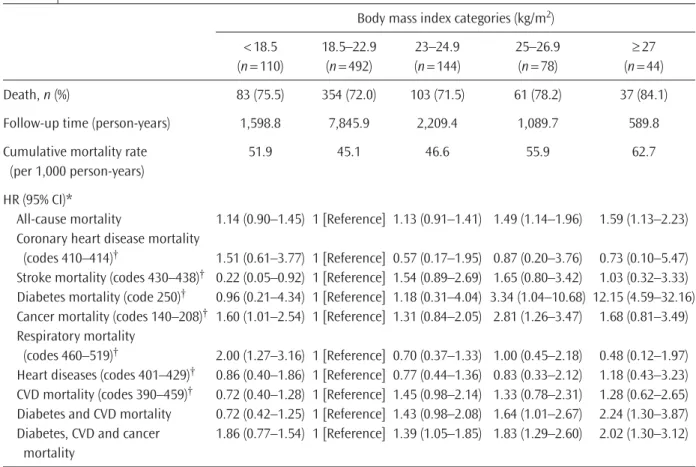
However, the multivariate-adjusted HRs of all causes of death for the overweight group and obesity group in men were 1.49 (95% CI, 1.14–1.96) and 1.59 (95% CI, 1.13–2.23), respectively (Table 4). The risk of death from diabetes, CVD or cancer in men increased progressively
Table 1. Baseline characteristics of this study’s population*
Characteristics Total subjects Men Women p
(n = 1,568) (n = 868) (n = 700)
Age (yr) 65.7± 4.0 65.7± 4.0 65.6± 4.0 0.421 Educational level (yr)
None 903 (57.6) 337 (38.8) 566 (80.9) < 0.0001 1–6 500 (31.9) 389 (44.8) 111 (15.9) > 6 165 (10.5) 142 (16.4) 23 (3.3) Smoking status 561 (35.8) 523 (60.3) 38 (5.4) < 0.0001 Alcohol consumption 244 (15.6) 211 (24.3) 33 (4.7) < 0.0001 Exercise† 986 (70.6) 584 (74.4) 402 (65.8) 0.0005 (n = 1,396) (n = 785) (n = 611) Hypertension history 569 (36.3) 325 (37.4) 243 (34.7) 0.2868 Diabetes history 17.5 13.5 22.7 0.0011 Body mass index (kg/m2) 22.2± 3.3 21.8± 3.0 22.7± 3.6 < 0.0001
Systolic blood pressure (mmHg) 131.7± 22.8 131± 22.5 132.5± 23.1 0.2127 Diastolic blood pressure (mmHg) 79.5± 12.7 80.2± 12.8 78.7± 12.5 0.0275 Fasting plasma glucose (mg/dL) 100.9± 48.3 94.4± 35.6 109.3± 60.1 < 0.0001 Total cholesterol (mg/dL) 242.4± 62.0 239.3± 61.0 246.5± 63.1 0.1105 Triglyceride (mg/dL) 173.1± 70.4 168.2± 63.4 179.6± 78.2 0.0302
Table 2. Relationship of body mass index categories to all-cause and specific disease mortality in overall subjects
Body mass index categories (kg/m2)
< 18.5 18.5–22.9 23–24.9 25–26.9 ≥ 27 (n= 182) (n= 852) (n= 275) (n= 155) (n= 104) Death, n (%) 132 (72.5) 574 (67.4) 188 (68.4) 112 (72.3) 79 (76.0) Follow-up time (person-years) 2,745.9 13,858.9 4,450.6 2,327.2 1,563.2 Cumulative mortality rate 48.1 41.4 42.2 48.1 50.5
(per 1,000 person-years) HR (95% CI)*
All-cause mortality 1.18 (0.98–1.43) 1 [Reference] 1.09 (0.92–1.28) 1.36 (1.11–1.67) 1.46 (1.15–1.85) Coronary heart disease mortality 1.87 (0.91–3.86) 1 [Reference] 1.44 (0.73–2.84) 0.73 (0.22–2.41) 0.41 (0.05–2.96)
(codes 410–414)†
Stroke mortality (codes 430–438)† 0.40 (0.17–0.93) 1 [Reference] 1.41 (0.94–2.11) 1.52 (0.91–2.55) 1.50 (0.81–2.77)
Diabetes mortality (code 250)† 0.59 (0.18–1.93) 1 [Reference] 1.53 (0.79–2.98) 2.90 (1.45–5.77) 3.26 (1.52–6.99)
Cancer mortality (codes 140–208)† 1.86 (1.29–2.67) 1 [Reference] 1.11 (0.76–1.61) 1.61 (1.04–2.50) 1.89 (1.15–3.13)
Respiratory mortality 2.04 (1.40–2.98) 1 [Reference] 0.60 (0.36–1.01) 0.76 (0.40–1.46) 0.71 (0.31–1.62) (codes 460–519)†
Heart diseases (codes 401–429)† 0.77 (0.42–1.39) 1 [Reference] 0.81 (0.54–1.21) 0.88 (0.47–1.64) 1.05 (0.53–2.08)
CVD mortality (codes 390–459)† 0.69 (0.44–1.08) 1 [Reference] 1.37 (1.04–1.82) 1.33 (0.91–1.94) 1.39 (0.90–2.16)
Diabetes and CVD mortality 0.58 (0.45–1.03) 1 [Reference] 1.39 (1.08–1.91) 1.55 (1.12–2.15) 1.66 (1.14–2.43) Diabetes, CVD and cancer 1.11 (0.85–1.45) 1 [Reference] 1.29 (1.05–1.60) 1.58 (1.21–2.05) 1.74 (1.29–2.35)
mortality
*Cox regression model: adjusted for age, sex, alcohol intake status, smoking status, education levels and exercise; †death certificates
using the National Death Files (International Classification of Diseases, Ninth Revision). HR = hazard ratio; CI = confidence interval; CVD = cardiovascular disease.
All cause mortality
30 35 40 45 50 55 60 65
Body mass index categories
Cumulative mor tality (per 1 ,000 per son-year s) Overall subjects Men Women
Diabetes mellitus and cardiovascular disease mortality
8 11 14 17 20 23 26 ≥ 27 Body mass index categories
Cumulative mor tality (per 1 ,000 per son-year s) < 18.5 18.5–22.9 23–24.9 25–26.9 ≥ 27 < 18.5 18.5–22.9 23–24.9 25–26.9 Cancer mortality 3 6 9 12 15 18 Cumulative mor tality (per 1 ,000 per son-year s)
Body mass index categories
0 3 6 9 12 15
18 Lung disease mortality
Cumulative mor tality (per 1 ,000 per son-year s) ≥ 27 Body mass index categories
< 18.5 18.5–22.9 23–24.9 25–26.9 ≥ 27
< 18.5 18.5–22.9 23–24.9 25–26.9
Figure. Relationship of categories of body mass index to cumulative all-cause mortality and specific cause mortality in men and women.
with scores of baseline BMI > 23.0 kg/m2, and HRs were significantly increased (BMI, 23–24.9: HR, 1.39; 95% CI, 1.05–1.85; BMI≥ 27: HR, 1.83; 95% CI, 1.29–2.60; BMI, 25–26.9: HR, 2.02; 95% CI, 1.30–3.12).
Discussion
In this nationwide cohort of the elderly, the average baseline BMI was 22.2 kg/m2and BMI was a significant independent predictor of all-cause, cancer, CVD and diabetes mortality. A BMI > 25 kg/m2 was associated with an increased risk of all-cause mortality, and a BMI > 23 kg/m2 also increased the risk of mortality from cancer, CVD and diabetes. However, these associations were more obvious in men than in women. Our study showed that the relationship between death from any cause and BMI follows a J-shaped pattern in elderly men and women.
Obesity and overweight combined is the second leading cause of preventable death18. Previous studies
have demonstrated a strong association between obesity and decreased survival in the general population, pri-marily because of the increased risk of CVD3,19. A BMI > 30 kg/m2was associated with an increased risk of all-cause mortality in a cohort study of 7,735 middle aged men19and with a significantly increased risk of death from CVD in the Nurses’ Health Study3.
In contrast to the general population, the role of increased BMI as a risk factor for death remains con-troversial in elderly subjects. Kulminski et al.20reported in their 9-year follow-up study of older Americans that the mortality risk pattern was higher for lower BMI (< 22.0) and flat for higher BMI. Overweight or obesity scores (BMI, 25.0–34.9) were not risk factors for all-cause mortality. The relationship between BMI and mortality exhibited an inverse J shape. Corrada et al.21 also showed similar relationships in a California co-hort study. Being overweight (relative risk, 1.01) was not associated with excess mortality, but obese partic-ipants (relative risk, 1.25) had significantly increased mortality.
Table 3. Relationship of categories of body mass index to all-cause and specific disease mortality in women
Body mass index categories (kg/m2)
< 18.5 18.5–22.9 23–24.9 25–26.9 ≥ 27 (n= 72) (n= 360) (n= 131) (n= 77) (n= 60) Death, n (%) 49 (68.1) 220 (61.1) 85 (64.9) 51 (66.2) 42 (70.0) Follow-up time (person-years) 1,147.2 6,012.9 2,241.3 1,237.4 973.4 Cumulative mortality rate 42.7 36.6 37.9 41.2 43.1
(per 1,000 person-years) HR (95% CI)*
All-cause mortality 1.23 (0.89–1.67) 1 [Reference] 1.04 (0.81–1.24) 1.21 (0.89–1.64) 1.34 (0.96–1.87) Coronary heart disease mortality 2.43 (0.71–8.34) 1 [Reference] 3.10 (1.19–8.06) 0.68 (0.08–5.49) –
(codes 410–414)†
Stroke mortality (codes 430–438)† 0.66 (0.23–1.88) 1 [Reference] 1.30 (0.72–2.37) 1.39 (0.67–2.92) 1.78 (0.85–3.73)
Diabetes mortality (code 250)† 0.36 (0.05–2.71) 1 [Reference] 1.70 (0.77–3.75) 2.54 (1.07–6.02) 0.90 (0.21–3.93)
Cancer mortality (codes 140–208)† 2.33 (1.27–4.28) 1 [Reference] 0.72 (0.34–1.50) 0.91 (0.38–2.18) 1.93 (0.95–3.94)
Respiratory mortality 2.22 (1.24–4.33) 1 [Reference] 0.49 (0.21–1.17) 0.48 (0.15–1.57) 0.98 (0.34–2.78) (codes 460–519)†
Heart diseases (codes 401–429)† 0.55 (0.20–1.52) 1 [Reference] 0.87 (0.49–1.53) 0.90 (0.39–2.08) 0.89 (0.35–2.28)
CVD mortality (codes 390–459)† 0.67 (0.33–1.35) 1 [Reference] 1.33 (0.89–1.99) 1.23 (0.72–2.09) 1.42 (0.81–2.50)
Diabetes and CVD mortality 0.61 (0.32–1.18) 1 [Reference] 1.36 (0.95–1.95) 1.44 (0.92–2.25) 1.31 (0.78–2.21) Diabetes, CVD and cancer 1.13 (0.74–1.73) 1 [Reference] 1.18 (0.86–1.63) 1.30 (0.87–1.93) 1.48 (0.98–2.26)
mortality
*Cox regression model: adjusted for age, sex, alcohol intake status, smoking status, education levels and exercise; †death certificates
using the National Death Files (International Classification of Diseases, Ninth Revision). HR = hazard ratio; CI = confidence interval; CVD = cardiovascular disease.
The literature review in an elderly population sur-vey by Janssen et al.15showed that the summary rela-tive risk of all-cause mortality for a BMI of 25–29.9 was 1.00 and that for a BMI within the obese range was 1.10 (95% CI, 1.06–1.13). According to selective survival hypothesis, individuals susceptible to the risky effects of an elevated BMI may have already died before get-ting old. With increasing age, subjects are progressively more strongly selected survivors. Thus, if we select an elderly group to evaluate BMI effect, the results tend to be neutral because they are resistant to the effects of a high BMI. Our findings did not support this conten-tion as the HRs of all-cause mortality were significant for a BMI > 25. This study showed that the relationship between BMI and mortality in the elderly was not different from that in the general population. The dif-ference in results between our study and the study of Janssen et al.15 may be explained by differences in average BMI scores between cohorts. Asians obviously have lower BMI values and lower CVD mortality than Western populations. The adverse effects of high BMI
on mortality might be postponed and last into the geriatric phase of life.
In previous studies of older Chinese and Japanese people22,23, BMI was apparently inversely related to all-cause mortality after a short-term follow-up (e.g., 4 years). In those with multiple comorbidities, obesity was associated with better outcomes, whereas in those with initially good health status, obesity was associ-ated with worsened outcomes. To minimize the effect of existing medical comorbidities on the BMI in our study, subjects who died during the first 3 years of follow-up were excluded. Therefore, long-term effects of a high BMI were positively associated with all-cause mortality.
Our study confirms the findings of previous studies demonstrating that the relationship between all-cause mortality and BMI categories follows a J-shaped pat-tern24,25. In the Korean Cancer Prevention Study, the J-shaped risk relationship has been documented; however, the relative risk associated with BMI declined in the elderly. Loss of J-shaped pattern was noticed in
Table 4. Relationship of categories of body mass index to all-cause and specific disease mortality in men
Body mass index categories (kg/m2)
< 18.5 18.5–22.9 23–24.9 25–26.9 ≥ 27 (n= 110) (n= 492) (n= 144) (n= 78) (n= 44) Death, n (%) 83 (75.5) 354 (72.0) 103 (71.5) 61 (78.2) 37 (84.1) Follow-up time (person-years) 1,598.8 7,845.9 2,209.4 1,089.7 589.8 Cumulative mortality rate 51.9 45.1 46.6 55.9 62.7
(per 1,000 person-years) HR (95% CI)*
All-cause mortality 1.14 (0.90–1.45) 1 [Reference] 1.13 (0.91–1.41) 1.49 (1.14–1.96) 1.59 (1.13–2.23) Coronary heart disease mortality
(codes 410–414)† 1.51 (0.61–3.77) 1 [Reference] 0.57 (0.17–1.95) 0.87 (0.20–3.76) 0.73 (0.10–5.47)
Stroke mortality (codes 430–438)† 0.22 (0.05–0.92) 1 [Reference] 1.54 (0.89–2.69) 1.65 (0.80–3.42) 1.03 (0.32–3.33)
Diabetes mortality (code 250)† 0.96 (0.21–4.34) 1 [Reference] 1.18 (0.31–4.04) 3.34 (1.04–10.68) 12.15 (4.59–32.16)
Cancer mortality (codes 140–208)† 1.60 (1.01–2.54) 1 [Reference] 1.31 (0.84–2.05) 2.81 (1.26–3.47) 1.68 (0.81–3.49)
Respiratory mortality
(codes 460–519)† 2.00 (1.27–3.16) 1 [Reference] 0.70 (0.37–1.33) 1.00 (0.45–2.18) 0.48 (0.12–1.97)
Heart diseases (codes 401–429)† 0.86 (0.40–1.86) 1 [Reference] 0.77 (0.44–1.36) 0.83 (0.33–2.12) 1.18 (0.43–3.23)
CVD mortality (codes 390–459)† 0.72 (0.40–1.28) 1 [Reference] 1.45 (0.98–2.14) 1.33 (0.78–2.31) 1.28 (0.62–2.65)
Diabetes and CVD mortality 0.72 (0.42–1.25) 1 [Reference] 1.43 (0.98–2.08) 1.64 (1.01–2.67) 2.24 (1.30–3.87) Diabetes, CVD and cancer 1.86 (0.77–1.54) 1 [Reference] 1.39 (1.05–1.85) 1.83 (1.29–2.60) 2.02 (1.30–3.12)
mortality
*Cox regression model: adjusted for age, sex, alcohol intake status, smoking status, education levels and exercise; †death certificates
using the National Death Files (International Classification of Diseases, Ninth Revision). HR = hazard ratio; CI = confidence interval; CVD = cardiovascular disease.
the group above the age of 64 years. In our study, those with a low BMI had higher risk from respiratory death, whereas those with a high BMI had higher risk from cancer, diabetes and CVD. The J-shaped risk rela-tionship has still remained in this older Taiwanese population.
Higher BMIs are most likely to contribute to the risk associated with CVD in Western countries. Since the dis-tribution of major causes of death may differ between Taiwanese and inhabitants of Western countries, obesity is likely to contribute to the risk of death from cancer and diabetes in this 23-year prospective study.
Progressive increases in risks associated with BMI were seen in both sexes; however, HRs for all-cause mortality were significant only among men. Low BMI (< 18.5) was associated with higher mortality of cancer and respiratory disease in both sexes. Some studies have also found differences in the BMI–mortality asso-ciation for men and women26,27.
Limitation
When interpreting our results regarding baseline BMI scores, it is important to note that we were unable to evaluate weight changes, body fat or fat distribution during the follow-up period. We assumed that the influ-ence of being overweight or obese defined by BMI on the risk of death is, in part, reflected by the increased body fat mass in those with an elevated BMI. However, the relationship between BMI with body fatness is weaker in the elderly compared with younger adults28. Furthermore, in a study by Heitmann et al.29, greater body fat quintile was a risk for mortality in a group of 60-year-old Swedish men. The effect of a high BMI on mortality might be underestimated in older men and women. Limitations include a single baseline mea-surement of BMI to predict events several years in the future.
Conclusion
The purpose of this study was to determine the effect of an elevated BMI on mortality risk from any cause and major causes in men and women aged 60 years and older. The result showed that BMI is an indepen-dent risk factor for all causes, cancer, diabetes or CVD mortality in this cohort. It is clear that a BMI in the obesity range is associated with a significantly increased risk of all-cause mortality in the elderly, and a BMI in
the overweight range is associated with a significantly increased risk of mortality from cancer, diabetes and CVD in elderly Taiwanese. These findings need to be confirmed by additional studies.
References
1. Lin YC, Yen LL, Chen SY, Kao MD, Tzeng MS, Huang PC, et al. Prevalence of overweight and obesity and its asso-ciated factors: findings from National Nutrition and Health Survey in Taiwan, 1993–1996. Prev Med 2003; 37: 233–41.
2. Hwang LC, Bai CH, Chen CJ. Prevalence of obesity and metabolic syndrome in Taiwan. J Formos Med Assoc 2006; 105: 626–35.
3. Manson JE, Willett WC, Stampfer MJ, Colditz GA, Hunter DJ, Hankinson SE, et al. Body weight and mortality among women. N Engl J Med 1995; 333: 677–85. 4. Calle EE, Rodriguez C, Walker-Thurmond K, Thun MJ.
Overweight, obesity, and mortality from cancer in a prospectively studied cohort of U.S. adults. N Engl J Med 2003; 348: 1625–38.
5. Calle EE, Thun MJ, Petrelli JM, Rodriguez C, Heath CW Jr. Body-mass index and mortality in a prospective cohort of U.S. adults. N Engl J Med 1999; 341: 1097–105. 6. Flegal KM, Graubard BI, Williamson DF, Gail MH. Excess
deaths associated with underweight, overweight, and obesity. JAMA 2005; 293: 1861–7.
7. Stevens J, Cai J, Pamuk ER, Williamson DF, Thun MJ, Wood JL. The effect of age on the association between body-mass index and mortality. N Engl J Med 1998; 338: 1–7.
8. Waaler HT. Hazard of obesity—the Norwegian experi-ence. Acta Med Scand Suppl 1988; 723: 17–21. 9. Stevens J. Impact of age on associations between
weight and mortality. Nutr Rev 2000; 58: 129–37. 10. Rissanen A, Heliovaara M, Knekt P, Aromaa A, Reunanen
A, Maatela J. Weight and mortality in Finnish men. J Clin Epidemiol 1989; 42: 781–9.
11. Lindsted K, Tonstad S, Kuzma JW. Body mass index and patterns of mortality among Seventh-day Adventist men. Int J Obes 1991; 15: 397–406.
12. Campbell AJ, Spears GF, Brown JS, Busby WJ, Borrie MJ. Anthropometric measurements as predictors of mortal-ity in a communmortal-ity population aged 70 years and over. Age Ageing 1990; 19: 131–5.
13. Tayback M, Kumanyika S, Chee E. Body weight as a risk factor in the elderly. Arch Intern Med 1990; 150: 1065–72.
14. Heiat A, Vaccarino V, Krumholz HM. An evidence-based assessment of federal guidelines for overweight and
obesity as they apply to elderly persons. Arch Intern Med 2001; 161: 1194–203.
15. Janssen I, Mark AE. Elevated body mass index and mortality risk in the elderly. Obes Rev 2007; 8: 41–59. 16. Hwang LC, Chen CJ, Tsieng WP. A nested case control
study on multiple risk factors for acute fatal cerebrovas-cular accident and coronary heart disease. Chin J Fam Med 1997; 7: 121–30.
17. Kanazawa M, Yoshiike N, Osaka T, Numba Y, Zimmet P, Inoue S. Criteria and classification of obesity in Japan and Asia-Oceania. Asia Pac J Clin Nutr 2002; 11 (Suppl 8): S732–7.
18. National Institutes of Health. Clinical guidelines on the identification, evaluation, and treatment of overweight and obesity in adults—the evidence report. Obes Res 1998; 6 (Suppl 2): S51–209.
19. Shaper AG, Wannamethee SG, Walker M. Body weight: implications for the prevention of coronary heart dis-ease, stroke, and diabetes mellitus in a cohort study of middle aged men. BMJ 1997; 314: 1311–7.
20. Kulminski AM, Arbeev KG, Kulminskaya IV, Ukraintseva SV, Land K, Akushevich I, et al. Body mass index and nine-year mortality in disabled and nondisabled older U.S. individuals. J Am Geriatr Soc 2008; 56: 105–10. 21. Corrada MM, Kawas CH, Mozaffar F, Paganini-Hill A.
Association of body mass index and weight change with all-cause mortality in the elderly. Am J Epidemiol 2006; 163: 938–49.
22. Schooling CM, Lam TH, Li ZB, Ho SY, Chan WM, Ho KS, et al. Obesity, physical activity, and mortality in a
prospective Chinese elderly cohort. Arch Intern Med 2006; 166: 1498–504.
23. Kalmijn S, Curb JD, Rodriguez BL, Yano K, Abbott RD. The association of body weight and anthropometry with mortality in elderly men: the Honolulu Heart Program. Int J Obes Relat Metab Disord 1999; 23: 395–402. 24. Katzmarzyk PT, Janssen I, Ardern CI. Physical inactivity,
excess adiposity and premature mortality. Obes Rev 2003; 4: 257–90.
25. Jee SH, Sull JW, Park J, Lee SY, Ohrr H, Guallar E, et al. Body-mass index and mortality in Korean men and women. N Engl J Med 2006; 355: 779–87.
26. Lahmann PH, Lissner L, Gullberg B, Berglund G. A pro-spective study of adiposity and all-cause mortality: the Malmo Diet and Cancer Study. Obes Res 2002; 10: 361–9.
27. Losonczy KG, Harris TB, Cornoni-Huntley J, Simonsick EM, Wallace RB, Cook NR, et al. Does weight loss from middle age to old age explain the inverse weight mor-tality relation in old age? Am J Epidemiol 1995; 141: 312–21.
28. Gallagher D, Visser M, Sepulveda D, Pierson RN, Harris T, Heymsfield SB. How useful is body mass index for comparison of body fatness across age, sex, and ethnic groups? Am J Epidemiol 1996; 143: 228–39.
29. Heitmann BL, Erikson H, Ellsinger BM, Mikkelsen KL, Larsson B. Mortality associated with body fat, fat-free mass and body mass index among 60-year-old Swedish men—a 22-year follow-up. The study of men born in 1913. Int J Obes Relat Metab Disord 2000; 24: 33–7.