Protein-Protein Interactions
Hsien-Da Huang,
†Tzong-Yi Lee,
†Li-Cheng Wu,
‡Feng-Mao Lin,
‡Hsueh-Fen Juan,
§Jorng-Tzong Horng,*
,‡,|and Ann-Ping Tsou*
,⊥Department of Biological Science and Technology and Institute pf Bioinformatics, National Chiao-Tung University, Hsin-Chu 300, Taiwan, Department of Computer Science and Information Engineering, National Central University, Chung-Li 320, Taiwan, Department of Life Science and Institute of Molecular and Cellular
Biology, National Taiwan University, Taipei 106, Taiwan, Department of Life Science, National Central University, Chung-Li 320, Taiwan, and Institute of Biotechnology in Medicine, National Yang-Ming University,
Taipei 112, Taiwan
Received September 16, 2004
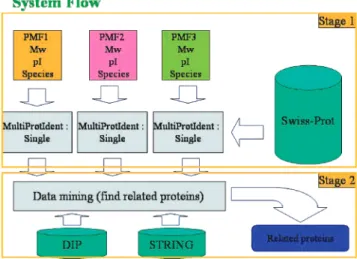
Protein identification is important in proteomics. Proteomic analyses based on mass spectra (MS) constitute innovative ways to identify the components of protein complexes. Instruments can obtain the mass spectrum to an accuracy of 0.01 Da or better, but identification errors are inevitable. This study shows a novel tool, MultiProtIdent, which can identify proteins using additional information about protein-protein interactions and protein functional associations. Both single and multiple Peptide Mass Fingerprints (PMFs) are input to MultiProtIdent, which matches the PMFs to a theoretical peptide mass database. The relationships or interactions among proteins are considered to reduce false positives in PMF matching. Experiments to identify protein complexes reveal that MultiProtIdent is highly promising. The website associated with this study is http://dbms104.csie.ncu.edu.tw/.
Keywords: protein identification • peptide mass fingerprint • protein-protein interaction
Introduction
Identifying proteins is an essential task in proteomics. Numerous proteomic experimental steps are required to identify a protein. The unknown proteins are separated by one-or two-dimensional (1D one-or 2D) gel electrophone-oresis, and some protein-specific attributes, e.g., molecular weight (Mw) or isotopic point (pI), are measured. The separated proteins are digested with an enzyme and the proteolytic peptides are measured by mass spectrometry (MS) which yields peptide mass fingerprints (PMF). The protein sequence database is searched to identify the protein that matches the PMF, Mw, and pI.1Several similar programs search with PMF; each uses different scoring algorithms for identifying proteins. PeptIdent (http://us.expasy.org/tools/peptident.html),2 MS-Fit (http:// prospector.ucsf.edu/ucsfhtml3.2/msfit.htm),3PepSea (http://
pepsea.protana.com/PA_PepSeaForm.html),4and PepFrag (ht-tp://www.proteometrics.com/prowl/PepFragch.html)5calculate the scores for proteins in the database, according to the number of matching peptides.1 The MOWSE (http://srs.hgmp.mr-c.ac.uk/cgi-bin/mowse) algorithm considers the number of matching peptides, the protein size and the relative abundances of the peptides of the given mass in the database.6Tandem mass spectrometry (MS/MS) further yields the actual pep-tide sequence and increases the success rate of protein identification. Some such programs such as Mascot (http:// www.matrixscience.com), ProFound (http://www.proteomet-rics.com/prowl-cgi/ProFound.exe), and SEQUEST (http:// thompson.mbt.washington.edu/sequest/) can also be used to search using tandem mass spectra.
Proteins cooperate by binding to form multicomponent complexes that perform specific functions.7 MS-based pro-teomic analysis is a new means of identifying the components of multi-protein complexes.8,9Two general approaches to the MS analysis of protein-protein interactions and complexes exist. The first is to resolve proteins on a 1D-SDS-PAGE gel; stain, and select the protein bands; digest them, and analyze by MALDI-TOF. The second is to digest them directly (without first separating them from each other) and then analyze the peptide-digest mixture using MALDI-TOF MS or LC-MS/MS.10 Reliable and unambiguous protein identification by peptide mass fingerprinting depends on highly accurate mass measure-ments. In practice, not every mass in PMF matches the theoretical digested mass. The lack of matching of masses in
* To whom correspondence should be addressed. Jorng-Tzong Horng. E-mail: [email protected]. Phone: +886-3-4227151 Extn. 35307. Fax: +886-3-4222681. Address: Department of Computer Science and Information Engineering, National Central University, Chung-Li City 320, Taiwan. Ann-Ping Tsou. E-mail: [email protected]. Phone: +886-2-28267155. Fax: +886-2-28264092. Address: Institute of Biotechnology in Medicine, National Yang-Ming University, Taipei 112, Taiwan.
†Department of Biological Science and Technology and Institute of Bioinformatics, National Chiao-Tung University.
‡Department of Computer Science and Information Engineering, National Central University.
§Department of Life Science & Institute of Molecular and Cellular Biology, National Taiwan University.
|Department of Life Science, National Central University.
⊥Institute of Biotechnology in Medicine, National Yang-Ming University.
PMF may have various causes, including the post-translational modification (PTM) of protein, cross contamination and the presence of Keratins.11 As well as PMF, numerous protein-specific attributes including species, molecular weight and isotopic point are considered in protein identification. How-ever, false positives still arise in the identification of proteins caused by the quality of the MS spectra, various parameters and experimental errors. Although most modern MALDI-TOF instruments equipped with reflectrons or delayed extraction, can measure the mass data to within 0.005 unit, errors are nevertheless inevitable.10
During an analysis of proteins on a 2D gel, some relationship, such as protein-protein interaction or functional association, may exist among the proteins extracted from the same the 2D gel. Some protein-protein interactions or functional associa-tions have already been discovered and a biological database created. On the basis of the assumption of the existence of a relationship among these unknown proteins, identifying these proteins simultaneously with information on protein-protein interaction or functional association will increase the accuracy of identification. Protein identification tools before this work could not identify many proteins simultaneously, even with the assistance of information on the protein- protein interaction or functional association. This work presents a tool, MultiPro-tIdent, to many proteins simultaneously with the assistance of the protein-protein interaction information from the DIP (http://dip.doe-mbi.ucla.edu) database and functional associa-tion informaassocia-tion from the STRING (http://www.bork.embl-heidelberg.de/STRING/) database. More than one set of PMFs are input to MultiProtIdent and proteins and possible relation-ships among proteins are returned. MultiProtIdent provides more information to help to elucidate the relationship among candidate proteins.
Materials
The protein sequence database, SWISS-PROT, is employed in this study because it offers a high level of annotation, including a description of the function of a protein, post-translational modifications, domain structure and variants. MultiProtIdent uses two protein-protein interaction databases. One is the DIP database that experimentally determined protein-protein interactions. The DIP database consists of three linked tablessa table of protein information, a table of protein-protein interactions and a table of details of experi-ments for detecting protein-protein interactions.12Another is the STRING database, which predicts functional associations among genes/proteins. The three types of functional associa-tions are recurring neighborhood, phylogenetic co-occurrence, and gene-fusion events.13STRING integrates this information from as many genomes as possible to predict functional links among proteins, and the database currently contains 356775 genes in 110 species. These two databases DIP and STRING are integrated into the pro-posed system.
Methods
This work presents a proteomic tool, MultiProtIdent, to identify proteins using peptide mass fingerprints. Figure 1 depicts the two stages of the system flow in MultiProtIdent. In the first stage, the user can input more than one set of MALDI-TOF spectra and some protein-specific attributes such as species, Mw, pI and the number of missed cleavages of a
protein, to identify the proteins. Each PMF and the protein-specific attributes are employed to search for protein sequence databases SWISS-PROT for protein entries that match the input data. The search results are a list of candidate proteins associated with scores that match the input PMF in the database. In Figure 2, three peptide mass fingerprints (PMF1, PMF2, and PMF3) and their related protein-specific attributes are submitted to Stage 1 of MultiProtIdent, and the results are the three sets of proteins SPMF1, SPMF2and SPMF3,respectively. Each protein in the candidate set has a score that is calculated using the protein identification scoring algorithm. The proteins in SPMF1are denoted as A_1, A_2, ..., A_10 with scores Sa_1, Sa_2, ..., Sa_10, respectively.
MultiProtIdent employs two scoring schemes. The first involves PeptIdent and Mascot; each peptide mass inputted by a user has a score given by the formula -10*log10P, where P is the probability associated with the mass value in the
database.14Each protein sequence in the database that matches the experimental data is scored by summing the scores of the matched theoretical peptide masses and inputted peptide
Figure 1. System flow of MultiProtIdent. MultiProtIdent consists
of two stages. The first is to identify candidate protein sets and the second is to find relations among proteins.
Figure 2. Three sets of peptide mass fingerprints (PMF1, PMF2,
PMF3) and related protein-specific attributes are input. The top 10 candidate proteins in each set are presented with correspond-ing scores.
masses.2The second scheme involves intensity and is based on a scoring algorithm that scores each observed peptide mass according to the intensity of the peak on the MALDI-TOF spectra. If the intensity is not inputted, then the MultiProtIdent will automatically select a probability score.
In Stage 2 of the proposed system, MultiProtIdent analyzes the relationships among the sets of ranked candidate proteins using the protein-protein interaction database DIP or the functional association database STRING. Some relationships such as protein-protein interaction or functional association may exist among the proteins, such as in a protein complex, extracted from a 1D or 2D gel. The integration and preprocess-ing of DIP and STRING, as shown in Table 1 enables protein-protein interactions or functional associations between each pair of proteins in the candidate protein sets to be found if they exist. Figure 3 presents an example of relations among SPMF1, SPMF2, and SPMF3. The protein interaction data from the DIP database are experimentally determined, and the data from STRING are predicted using three functional associations. Users can choose the interaction databases they use to search. The protein-protein interactions or functional associations are visualized as an undirected graph G ) (V, E), where x, y∈ V and (x, y) ∈ E. X and y represent proteins and (x, y) ∈ E represents an interaction or association between proteins x and
y.15In MultiProtIdent, V is referred to all proteins in SWISS-PROT, and E is referred to all protein-protein interactions in DIP or STRING database. The subgraph of G is first defined as follows to enable the interaction search. Let x′, y′∈ V′ and represent the proteins in candidate protein sets and (x′, y′)∈
E′represent an interaction or association between proteins x′ and y′. The graph G′) (V′, E′) is a subgraph of G, where V′⊂
V and E′⊂ E. Figure 3 presents an example of a subgraph of a
protein interaction network G. In this instance, the three sets of candidate proteins SPMF1, SPMF2, and SPMF3are subsets of V′, so SPMF1∪ SPMF2∪ SPMF3) V′. All the edges between proteins constitute the edge set E′.
In Figure 3, the black lines and dotted lines represent the DIP protein-protein interactions and STRING functional as-sociations, respectively. With reference to both DIP and STRING, vertexes A_8, B_9, C_9 and edges (A_8, B_9), (B_9, C_9) form a connected subgraph of G′ that meets the condition. Vertexes A_8, B_8, B_9 and edges (A_8, B_8), (A_8, B_9) do not satisfy match the condition because B_8 and B_9 are from the same candidate protein set SPMF2. A weighted score of the edge (interaction) between each pair of proteins is determined by summing the ranking scores of the two proteins. The weighted scores of (A_8, B_9) and (B_9, C_9) are Sa_8+ Sb_9and Sb_9+ Sc_9respectively, and the total score of the connected subgraph is (Sa_8+ Sb_9) + (Sb_9+ Sc_9).
In the example in Figures 2 and 3, A_1, B_1, and C_1 have the highest score in traditional protein identification tools. False positive occur in traditional protein identification because of the quality of MS spectra, parameters, cross contamination and keratins,11A_1, B_1, and C_1 may not be the correct protein. If interaction among proteins is assumed to be according to Figure 3, A_9, B_6, and C_7 are more likely to be the correct protein. MultiProtIdent will identify A_9, B_6, and C_7 as rank 1 in result and the score for multiple protein identification equals (Sa_9+ Sb_6) + (Sb_6+ Sc_7) + (Sa_9+ Sc_7).
Results
Protein complexes are used to test the analysis of many PMFs that exhibit protein-protein interactions or functional associa-tions among, to validate the proposed approach. Table 2 includes five sets of test data on cellular complexes from MIPS (http://mips.gsf.de/)16and some proteins that are randomly selected from Saccharomyces cerevisiae.
Figure 4 concerns computer simulations for generating PMFs of component proteins in each cellular complex.17For instance, the second cellular complex cAMP-dependent protein kinase in Table 2 has four entries - YIL033c, YJL164c, YKL166c and YPL203w. Corresponding SWISS-PROT protein ID KAPA-_YEAST, KAPBKAPA-_YEAST, KAPC_YEAST and KAPR_YEAST are retrieved in Step 1. These protein sequences are submitted for theoretically tryptic digestion by PeptideMass (http://us.ex-pasy.org/tools/peptide-mass.html) with the allowance of two missed cleavages and some post-translational modifications in Step 2. Three peptide masses with missed cleavages e 1 but without post-translational modification are randomly chosen from the theoretical digested peptide masses in Step 3. A random value of between -1 to +1 Da is added to each of the three randomly selected peptide masses in Step 4, a mass error tolerance that is similar to that which is found.18However, seven peptide masses are randomly selected with two missed cleavages or with post-translational modification (PTM) from the theoretical digested peptide masses in Step 5. Finally, all
Table 1. Protein-Protein Interaction or Functional Association Exists between the Proteins KAPA_YEAST and KAPR_YEAST, and
the Information Source (DIP:244E)
ID Protein_a_id Protein_b_id Description
1 KAPA_YEAST KAPR_YEAST DIP:244E
2 KAPR_YEAST KAPB_YEAST DIP:245E
3 KAPR_YEAST KAPC_YEAST DIP:246E
4 YUNK_HUMAN HGCG_HUMAN STRING:COG0226-COG1117
: : : :
Figure 3. All relationships are presented among the proteins in
the three candidate protein. The black line and dotted line represent the DIP protein-protein interaction and STRING func-tional association, respectively.
10 peptide masses are regarded as simulated PMF for each protein. The simulated PMFs will be submitted to MultiProtI-dent for multiple PMF analysis. Each test datum is obtained five times in the simulation.
The experimental results are compared with those of Pep-tIdent and Mascot. In all experiments, the parameters used in the identification programs are presented as follows. The searched database is SWISS-PROT; the selected species is
Saccharomyces cerevisiae; the digested enzyme is Trypsin; the
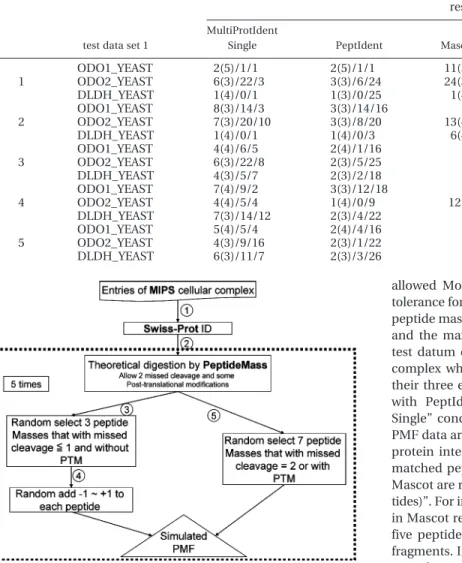
allowed Molecular Weight variability is (30%; the maximal tolerance for masses is 1 Da; the minimum number of matched peptide masses is three; zero or one missed cleavage is allowed and the maximum number of listed results is 30.18The first test datum concerns a 2-oxoglutarate dehydrogenase cellular complex which exhibits protein-protein interactions among their three entries. Table 3 compares the proposed approach with PeptIdent and Mascot. The column “MultiProtIdent Single” concerns identification using MultiProtIdent, but the PMF data are input one at a time and the function of protein-protein interactions is not applied. The rank and number of matched peptides for “MultiProtIdent Single”, PeptIdent and Mascot are represented as “rank (the number of matched pep-tides)”. For instance, entry 11(5) in the test data “ODO1_YEAST” in Mascot represents the ODO1_YEAST in the 11th place, and five peptide masses are matched to the theoretical digested fragments. In the experiments on “MultiProtIdent Single” and PeptIdent, more than one protein share a single rank. For instance, the result 2(3) may not be favorable because more than 20 proteins may be preset with ranks 1 and 2. Restated, even the result 2(3) may represent more than 20 proteins that can be considered to be possible identification candidates. The number of proteins above the current rank and the number of proteins in the current rank are also given. The third and fourth values in the results of “MultiProtIdent Single” and PeptIdent are the number of proteins above the current rank and the number of proteins with the current rank, respectively. For example, the result ODO2_YEAST in PepIdent is represented as 3(3)/6/24, which indicates “ODO2_YEAST has of the third
Table 2. Five Test Data Sets Include Cellular Complexes from the MIPS Databasea
test data SWISS-PROT ID of each entries
1 2-oxoglutarate dehydrogenase (YDR148c, YFL018c, YIL125w)
ODO1_YEAST_ODO2_YEAST_DLDH_YEAST
2 cAMP-dependent protein kinase
(YIL033c, YJL164c, YKL166c, YPL203w)
KAPA_YEAST_KAPB_YEAST_KAPC_YEAST_ KAPR_YEAST
3 2-oxoglutarate dehydrogenase
(YIL125w, YDR148c, YFL018c) and YMR105c
ODO1_YEAST_ODO2_YEAST_DLDH_YEAST_ PGM2_YEAST
4 Anthranilate synthase
(YER090w, YKL211c) and YDR256C
TRPE_YEAST_TRPG_YEAST_CATA_YEAST
5 Anthranilate synthase
(YER090w, YKL211c) + Fatty acid synthetase cytoplasmic (YKL182w, YPL231w)
TRPE_YEAST_TRPG_YEAST_FAS1_YEAST_ FAS2_YEAST
aThe first set is a cellular complex that consists of three entries - YDR148c, YFL018c, and YIL125w. Their SWISS-PROT IDs are ODO1_YEAST, ODO2_YEAST,
and DLDH_YEAST, respectively.
Table 3. Comparative Results for the First Test Data Set
results test data set 1
MultiProtIdent
Single PeptIdent Mascot
MultiProtIdent (DIP)
MultiProtIdent (DIP & STRING)
ODO1_YEAST 2(5)/1/1 2(5)/1/1 11(5) 1(3) 1(3) 1 ODO2_YEAST 6(3)/22/3 3(3)/6/24 24(3) DLDH_YEAST 1(4)/0/1 1(3)/0/25 1(4) ODO1_YEAST 8(3)/14/3 3(3)/14/16 - 1(3) 1(3) 2 ODO2_YEAST 7(3)/20/10 3(3)/8/20 13(4) DLDH_YEAST 1(4)/0/1 1(4)/0/3 6(4) ODO1_YEAST 4(4)/6/5 2(4)/1/16 - 1(3) 1(3) 3 ODO2_YEAST 6(3)/22/8 2(3)/5/25 -DLDH_YEAST 4(3)/5/7 2(3)/2/18 -ODO1_YEAST 7(4)/9/2 3(3)/12/18 - 1(3) 1(3) 4 ODO2_YEAST 4(4)/5/4 1(4)/0/9 12(4 DLDH_YEAST 7(3)/14/12 2(3)/4/22 -ODO1_YEAST 5(4)/5/4 2(4)/4/16 - 1(3) 1(3) 5 ODO2_YEAST 4(3)/9/16 2(3)/1/22 -DLDH_YEAST 6(3)/11/7 2(3)/3/26
-Figure 4. Flow for generating simulated PMFs. Processes indi-cated by the dotted line are repeated five times.
rank and three peptide fragments are matched, but a total of six proteins have rank 1 or 2, and 24 proteins have rank 3”. The results of MultiProtIdent consist of the rank and number of matched interactions. Multiple PMF analysis yields two different results; one is obtained using DIP and the other obtained using DIP and STRING. A dash (-) represents a miss as determined from the maximum of 30 results. Table 3 reveals that MultiProtIdent outperforms PeptIdent and Mascot in identifying protein complexes. Although the single identifica-tion did not outperform other tools, all multiple identificaidentifica-tion results have the best rank.
Table 4 compares the results concerning the second test dataset. The second test data concern a cAMP-dependent
pro-tein kinase cellular complex that is composed of four propro-teins.
Table 4 shows six protein-protein interactions exist among the four proteins in the DIP database. The multiple identification results in Table 4 are similar to those in Table 3, indicating multiple PMF identification is perfect in this example.
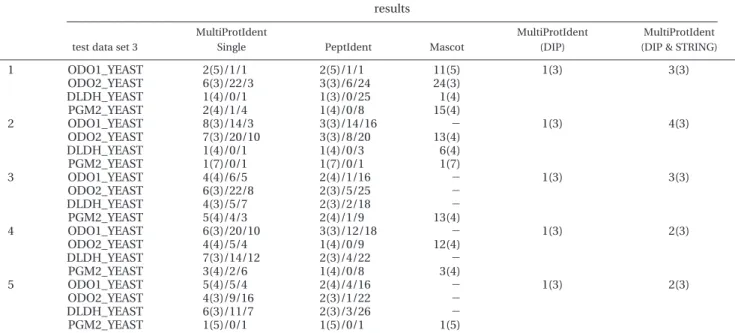
Table 5 compares the results concerning the third test dataset. The third test data involve a 2-oxoglutarate
dehydro-genase cellular complex associate with the first test data, and
a protein PGM2_YEAST which is randomly selected from YEAST. Several protein-protein interactions are known to occur among ODO1_YEAST, ODO2_YEAST, and DLDH_YEAST. In this test dataset, the results of multiple PMF analysis are favorable if DIP is chosen as the only source of protein interaction. The result of multiple PMFs analysis using both DIP and STRING as a source of protein interaction database, are not as good as those obtained using only DIP. However, Table 6 presents an interesting result related to rank 1. The table shows that the 2-oxoglutarate dehydrogenase cellular complex and PGM2_YEAST can be identified simultaneously. Two additionally relationships of functional association in STRING are found among the cellular complex and PGM2_YEAST. PGT2_YEAST is chosen randomly, so the exist-ence of the interaction is not known. The interactions in
Table 4. Comparison of Results Concerning Second Test Data Set
results test data set 2
MultiProtIdent
Single PeptIdent Mascot
MultiProtIdent (DIP)
MultiProtIdent (DIP & STRING)
1 KAPA_YEAST 2(3)/1/3 1(3)/0/4 22(3) 1(6) 1(6) KAPB_YEAST 1(5)/0/1 1(5)/0/1 1(5) KAPC_YEAST 1(3)/0/2 1(3)/0/6 4(3) KAPR_YEAST 3(3)/7/2 2(3)/2/15 -2 KAPA_YEAST 3(3)/6/4 1(3)/0/12 28(3) 1(6) 1(6) KAPB_YEAST 1(4)/0/1 1(4)/0/1 2(4) KAPC_YEAST 1(3)/0/3 1(3)/0/5 10(3) KAPR_YEAST 1(3)/0/8 2(3)/1/18 16(3) 3 KAPA_YEAST 3(3)/5/3 1(3)/0/13 9(3) 1(6) 1(6) KAPB_YEAST 1(4)/0/3 1(4)/0/3 1(4) KAPC_YEAST 1(3)/0/1 1(3)/0/15 13(3) KAPR_YEAST 5(3)/5/6 2(3)/1/17 -4 KAPA_YEAST 3(3)/2/4 3(3)/3/14 5(3) 1(6) 1(6) KAPB_YEAST 2(3)/1/3 2(3)/1/11 15(3) KAPC_YEAST 1(4)/0/1 1(4)/0/1 4(4) KAPR_YEAST 3(3)/5/5 1(3)/0/14 11(3) 5 KAPA_YEAST 2(3)/1/6 1(3)/0/13 22(3) 1(6) 1(6) KAPB_YEAST 1(4)/0/3 1(4)/0/3 5(4) KAPC_YEAST 2(3)/1/2 1(3)/0/12 9(3) KAPR_YEAST 5(3)/10/9 2(3)/5/20
-Table 5. Comparative Results Concerning the Third Test Data
results test data set 3
MultiProtIdent
Single PeptIdent Mascot
MultiProtIdent (DIP)
MultiProtIdent (DIP & STRING)
1 ODO1_YEAST 2(5)/1/1 2(5)/1/1 11(5) 1(3) 3(3) ODO2_YEAST 6(3)/22/3 3(3)/6/24 24(3) DLDH_YEAST 1(4)/0/1 1(3)/0/25 1(4) PGM2_YEAST 2(4)/1/4 1(4)/0/8 15(4) 2 ODO1_YEAST 8(3)/14/3 3(3)/14/16 - 1(3) 4(3) ODO2_YEAST 7(3)/20/10 3(3)/8/20 13(4) DLDH_YEAST 1(4)/0/1 1(4)/0/3 6(4) PGM2_YEAST 1(7)/0/1 1(7)/0/1 1(7) 3 ODO1_YEAST 4(4)/6/5 2(4)/1/16 - 1(3) 3(3) ODO2_YEAST 6(3)/22/8 2(3)/5/25 -DLDH_YEAST 4(3)/5/7 2(3)/2/18 -PGM2_YEAST 5(4)/4/3 2(4)/1/9 13(4) 4 ODO1_YEAST 6(3)/20/10 3(3)/12/18 - 1(3) 2(3) ODO2_YEAST 4(4)/5/4 1(4)/0/9 12(4) DLDH_YEAST 7(3)/14/12 2(3)/4/22 -PGM2_YEAST 3(4)/2/6 1(4)/0/8 3(4) 5 ODO1_YEAST 5(4)/5/4 2(4)/4/16 - 1(3) 2(3) ODO2_YEAST 4(3)/9/16 2(3)/1/22 -DLDH_YEAST 6(3)/11/7 2(3)/3/26 -PGM2_YEAST 1(5)/0/1 1(5)/0/1 1(5)
STRING are predicted functional associations, and a protein interaction that has not yet been experimentally discovered, may occur between the 2-oxoglutarate dehydrogenase cellular complex and protein PGM2_YEAST.
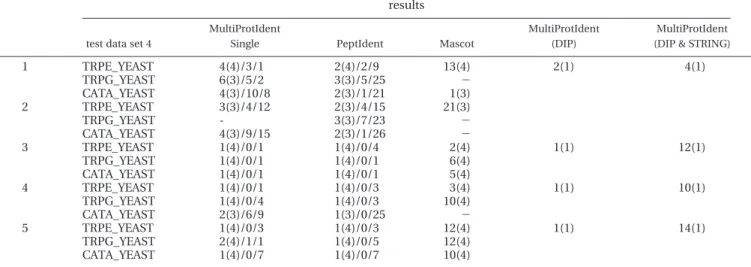
Table 7 compares results concerning the fourth test data set. The fourth test data set involves an Anthranilate synthase cellular complex and a protein CATA_YEAST, which is also randomly chosen. MultiProtIdent in Table 7 yields no new protein interaction. The identification of multiple proteins using both DIP and STRING database is not as good as the previous identification. More protein-protein interactions exist when both DIP and STRING are used than when only DIP is used. The interactions in STRING are predicted, so an attempt may be made to score differently each interaction in different databases in further work. The multiple protein identification result using only the DIP database is better except in round 2 of the experiments referred to in Table 7. The TRPG_YEAST is not correctly identified as a candidate protein in protein identification, so the result of multiple protein identification does not yield the correct answer. Mascot does not correctly identify TPRG_YEAST in round 2 and the rank in PepIdent is also not very well determined. These findings reveal that,
although multiple protein identification helps to identify interacting proteins, correct PMF data are crucial. Although the identification of multiple proteins in MultiProtIdent performs very well, it is not a panacea and may still be influenced by terribly damaged PMF values, as shown in round 2 of Table 7. Table 8 compares results concerning the fifth test data set. Instead of only one set of cellular complex, the fifth test data involve two sets of protein complexessan Anthranilate synthase cellular complex that consists of TRPE_YEAST and TRPG-_YEAST and a fatty acid synthetase cytoplasmic cellular complex that consists of FAS1_YEAST and FAS2_YEAST. Both cellular complexes have two entries. Although Table 8 reveals the two complex groups, one of which is TRPE_YEAST and TRPG-_YEAST, and the other of which is FAS1_YEAST and FAS2TRPG-_YEAST, the results of the multiple PMFs’ analysis are not as good as in the previous case; actually, the user does not know that there are two sets of cellular complexes involved in the four PMFs. The results reveal the existence of some interesting relation-ships. In the observation of round 1, if the rank 1 result, which shows that PMF1 and PMF2 represent TRPE_YEAST and TRPG_YEAST, respectively, is trusted, and other interactions related to PMF1 and PMF2 are removed, (ex: rank 2∼7) then the interaction in FAS1_YEAST and FAS2_YEAST will be of rank 1 left between PMF3 and PMF4. The data set with two sets of interaction is a special case and the user cannot be assumed to trust the results in rank 1 so the other combination that overlaps with the proteins identified in rank 1 (ex: rank 2∼7) is not eliminated. Therefore, the identification of FAS1_YEAST and FAS2_YEAST is not of rank 2 but of rank 8. However, the result in rank 1 and the results in ranks 2 to 7 cannot coexist when representing two protein complex sets, since overlap exists in the identification of a single PMF.
Discussion
MultiProtIdent is the first protein identification tool that can simultaneously identify multiple proteins using information on protein-protein interactions or functional associations. Some relationships such as protein-protein interactions or functional associations may exist among proteins that are excised from a 1D/2D gel or from two compared2D gels. Multiple PMFs analysis is highly precise when applied to identify a protein com-plex or proteins that exhibit some interactions or functional associations. In particular, the identification of the protein complex exploits of available protein-protein interaction
Table 6. Results of Multiple PMF Analysis with DIP and
STRING for the Third Test Data
results
test data set 3 MultiProtIdent (DIP & STRING)
1 ODO1_YEAST 3(3) 1(5) ODO2_YEAST DLDH_YEAST PGM2_YEAST 2 ODO1_YEAST 4(3) 1(5) ODO2_YEAST DLDH_YEAST PGM2_YEAST 3 ODO1_YEAST 3(3) 1(5) ODO2_YEAST DLDH_YEAST PGM2_YEAST 4 ODO1_YEAST 2(3) 1(5) ODO2_YEAST DLDH_YEAST PGM2_YEAST 5 ODO1_YEAST 2(3) 1(5) ODO2_YEAST DLDH_YEAST PGM2_YEAST
Table 7. Comparative Results Concerning the Fourth Test Data
results test data set 4
MultiProtIdent
Single PeptIdent Mascot
MultiProtIdent (DIP)
MultiProtIdent (DIP & STRING)
1 TRPE_YEAST 4(4)/3/1 2(4)/2/9 13(4) 2(1) 4(1) TRPG_YEAST 6(3)/5/2 3(3)/5/25 -CATA_YEAST 4(3)/10/8 2(3)/1/21 1(3) 2 TRPE_YEAST 3(3)/4/12 2(3)/4/15 21(3) TRPG_YEAST - 3(3)/7/23 -CATA_YEAST 4(3)/9/15 2(3)/1/26 -3 TRPE_YEAST 1(4)/0/1 1(4)/0/4 2(4) 1(1) 12(1) TRPG_YEAST 1(4)/0/1 1(4)/0/1 6(4) CATA_YEAST 1(4)/0/1 1(4)/0/1 5(4) 4 TRPE_YEAST 1(4)/0/1 1(4)/0/3 3(4) 1(1) 10(1) TRPG_YEAST 1(4)/0/4 1(4)/0/3 10(4) CATA_YEAST 2(3)/6/9 1(3)/0/25 -5 TRPE_YEAST 1(4)/0/3 1(4)/0/3 12(4) 1(1) 14(1) TRPG_YEAST 2(4)/1/1 1(4)/0/5 12(4) CATA_YEAST 1(4)/0/7 1(4)/0/7 10(4)
databases, such as DIP, to identify the components of protein complexes that have already been discovered and are stored in databases.
In the experiment, most cellular complexes from MIPS are identified correctly. The results of multiple PMF analysis using interaction data from only the DIP database are better than those using interaction data from both DIP and STRING data-bases. The quantity and quality of the predicted functional associations of STRING are responsible for false positives in the identification of protein complex. In the current configura-tion, the user can select the interaction sources, such as DIP or STRING, and only the DIP is selected as a default option. However, most protein-protein interactions in the DIP data-base relate to Drosophila melanogaster and Saccharomyces
cere-visiae. The authors plan to add more protein-protein
interac-tion databases such as BIND (http://www.blueprint.org/bind/ bind.php),19MINT (http://160.80.34.4/mint/),20MIPS and KEGG (KEGG http://www.genome.ad.jp/kegg/)21in the future works. The KEGG (KEGG http://www.genome.ad.jp/kegg/) pathway database of detailed biological processes is now being inte-grated to identify multiple proteins.
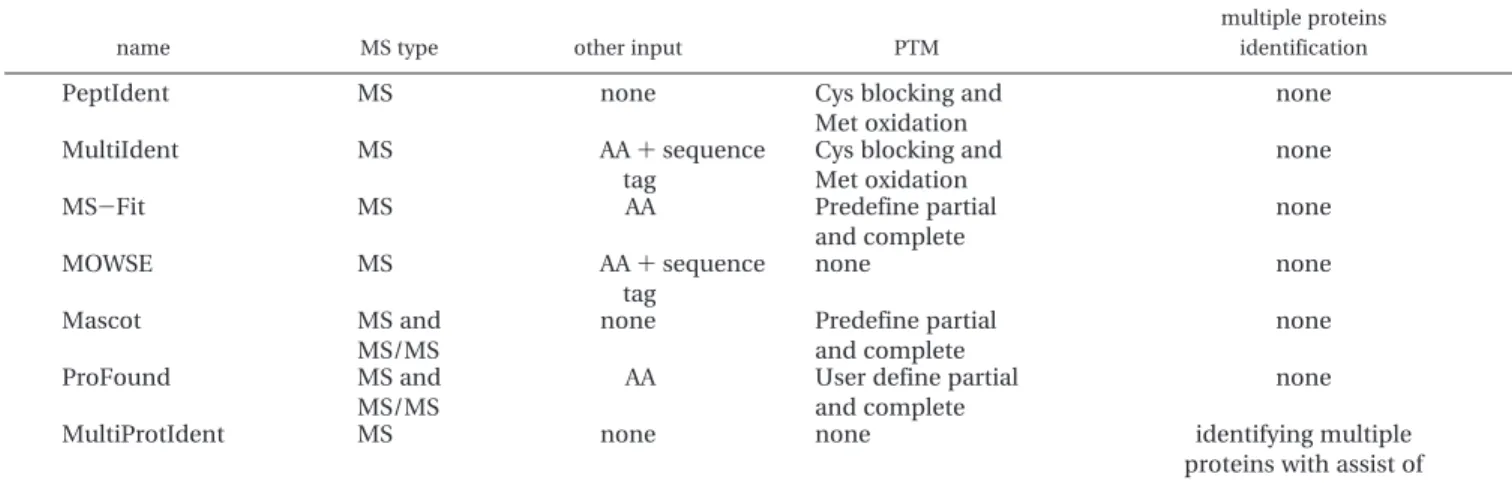
Table 9 compares the proposed MultiProtIdent to other pop-ular protein identification tools. The main characteristic of MultiProtIdent is that it can identify proteins using information on protein-protein interaction. In the future, PIR-NREF or Uni-Prot (http://www.pir.uniprot.org/) will be used as alternatives to provide protein sequences. For multiplicity, the peptide sequences of proteins can be submitted to the system to iden-tify numerous proteins. For accuracy, the scoring function in the proposed protein identification and the function for weight-ing associated with the interaction between proteins will be refined. For instance, as databases DIP and STRING are used here, the weight of interaction derived from the former database will be greater than the latter, because of the quality of the interaction source. Moreover, post-translational modification will also be considered, which can improve the accuracy of protein identification. Finally a visualization interface that presents the interaction is also considered, and a graph layout algorithm may be employed to explicate the relationships among the results of multiple PMFs analysis, as depicted in ref 22.
Table 8. Comparative Results Concerning the Fifth Test Data Set
results test data set 5
MultiProtIdent
Single PeptIdent Mascot
MultiProtIdent (DIP)
MultiProtIdent (DIP & STRING)
1 TRPE_YEAST 4(4)/3/1 2(4)/2/9 134) 1(1) 1(1) TRPG_YEAST 6(3)/5/2 3(3)/5/25 -FAS1_YEAST 1(7)/0/1 1(7)/0/2 1(7) 8(1) 11(1) FAS2_YEAST 6(3)/15/5 3(3)/15/15 -2 TRPE_YEAST 3(3)/4/12 2(3)/4/15 21(3) - -TRPG_YEAST - 2(3)/9/21 -FAS1_YEAST 6(4)/8/6 3(4)/6/15 - 2(1) 2(1) FAS2_YEAST 1(6)/0/1 1(6)/0/1 1(6) 3 TRPE_YEAST 1(4)/0/1 1(4)/0/4 2(4) 1(1) 4(1) TRPG_YEAST 1(4)/0/1 1(4)/0/1 6(4) FAS1_YEAST 10(3)/20/8 5(3)/18/12 - 3(1) 14(1) FAS2_YEAST 5(3)/18/10 3(3)/10/19 -4 TRPE_YEAST 6(3)/9/5 2(3)/5/22 - 7(1) 7(1) TRPG_YEAST 4(3)/4/4 2(3)/3/21 23(3) FAS1_YEAST 4(4)/5/6 3(4)/3/9 - 4(1) 4(1) FAS2_YEAST 4(4)/5/4 2(4)/4/6 -5 TRPE_YEAST 4(3)/16/7 2(3)/1/22 - 3(1) 32(1) TRPG_YEAST 1(4)/0/2 1(4)/0/2 3(4) FAS1_YEAST 2(6)/1/1 1(6)/0/1 10(6) 2(1) 29(1) FAS2_YEAST 6(3)/13/12 3(3)/9/21
-Table 9. Comparison of MultiProtIdent and Other Popular Protein Identification Tools (see ref 1)a
name MS type other input PTM
multiple proteins identification
PeptIdent MS none Cys blocking and
Met oxidation
none
MultiIdent MS AA + sequence
tag
Cys blocking and Met oxidation
none
MS-Fit MS AA Predefine partial
and complete none MOWSE MS AA + sequence tag none none Mascot MS and MS/MS
none Predefine partial
and complete
none
ProFound MS and
MS/MS
AA User define partial
and complete
none
MultiProtIdent MS none none identifying multiple
proteins with assist of protein-protein interaction
References
(1) Ronald C.; Beavis, D. F. Database searching with mass-spectro-metric information. Proteomics 2000.
(2) Wilkins, M. R.; Williams, K. L. Cross-species protein identification using amino acid composition, peptide mass fingerprinting, isoelectric point and molecular mass: a theoretical evaluation. J. Theor. Biol. 1997, 186(1), 7-15.
(3) Clauser, K. R.; Baker, P.; et al. Role of accurate mass measurement (( 10 ppm) in protein identification strategies employing MS or MS/MS and database searching. Anal. Chem. 1999, 71(14), 2871-2882.
(4) Mann, M.; Hojrup, P.; et al. Use of mass spectrometric molecular weight information to identify proteins in sequence databases. Biol. Mass. Spectrom. 1993, 22(6), 338-345.
(5) Fenyo, D.; Qin, J.; et al. Protein identification using mass spectrometric information. Electrophoresis 1998, 19(6), 998-1005. (6) Pappin, D. J. C.; Hojrup, P.; Bleasby, A. J. Rapid identification of proteins by peptide-mass fingerprinting. Curr. Biol. 1993, 3, 327-332.
(7) Liebler, D. C. p., Ed. Introduction to Proteomics; Humana Press Inc.: Totowa, New Jersey, 2002.
(8) Ho, Y.; Gruhler, A.; et al. Systematic identification of protein complexes in Saccharomyces cerevisiae by mass spectrometry. Nature 2002, 415(6868), 180-183.
(9) Gavin, A. C.; Bosche, M.; et al. Functional organization of the yeast proteome by systematic analysis of protein complexes. Nature 2002, 415(6868), 141-147.
(10) Liebler, D. C., Ed. Introduction to Proteomics; Tools for the New Biology. Humana Press Inc.: Totowa, New Jersey; 2002. (11) Ding, Q.; Xiao, L.; et al. Unmatched masses in peptide mass
fingerprints caused by cross-contamination: an updated statisti-cal result. Proteomics 2003, 3(7), 1313-1317.
(12) Xenarios, I.; Salwinski, L.; et al. DIP, the Database of Interacting Proteins: a research tool for studying cellular networks of protein interactions. Nucleic Acids Res. 2002, 30(1), 303-305.
(13) von Mering, C.; M. H., Jaeggi, D.; Schmidt, S.; Bork, P.; Snel, B. STRING: a database of pridicted functional associations between proteins. Nucleic Acids Res. 2003, 31(1), 258-261.
(14) Perkins, D. N.; Pappin, D. J.; et al. Probability-based protein identification by searching sequence databases using mass spectrometry data. Electrophoresis 1999, 20(18), 3551-3567. (15) Han, K.; Ju, B. H. A fast layout algorithm for protein interaction
networks. Bioinformatics 2003, 19(15), 1882-1888.
(16) Mewes, H. W.; Amid, C.; et al. MIPS: analysis and annotation of proteins from whole genomes. Nucleic Acids Res. 2004, 32(1), D41-44.
(17) Masselon, C.; L. P.-T.; Lee, S.-W.; Li, L.; Anderson, G. A.; Harkewicz, R.; Smith, R. D. Identification of tryptic peptides from large databases using multiplexed tandem mass spectrometry: simulations and experimental results. Proteomics 2003, 3, 1279-1286.
(18) Gras, R.; Muller, M.; et al. Improving protein identification from peptide mass fingerprinting through a parametrized multi-level scoring algorithm and an optimized peak detection. Electrophore-sis 1999, 20(18), 3535-3550.
(19) Bader, G. D.; Betel, D.; et al. BIND: the Biomolecular Interaction Network Database. Nucleic Acids Res. 2003, 31(1), 248-250. (20) Zanzoni, A.; Montecchi-Palazzi, L.; et al. MINT: a Molecular
INTeraction database. FEBS Lett. 2002, 513(1), 135-140. (21) Kanehisa, M.; Goto, S.; et al. The KEGG databases at GenomeNet.
Nucleic Acids Res. 2002, 30(1), 42-46.
(22) Becker, M. Y.; Rojas, I. A graph layout algorithm for drawing metabolic pathways. Bioinformatics 2001, 17(5), 461-467.