E L S E V I E R Microelectronic Engineering 35 (1997) 461-464 MICROI~IJI~"I'RONIC ENGINEERING S T U D Y O N O P T I M I Z A T I O N O F A N N U L A R O F F - A X I S I L L U M I N A T I O N U S I N G T A G U C H I M E T H O D F O R 0.35 ~tm D E N S E L I N E / S P A C E b Wen-an Loong a, Jin-chi Tseng a , Tzu-ching Chen a and Chien-an Lung
alnstitute of Applied Chemistry, National Chiao Tung University, Hsin-Chu, Taiwan 300, Republic of China bGroup of Mathematics Education, National I-Lan Institute of Agriculture and Technology, I-Lan, Taiwan 260, Republic of China
The simulation and experiment study on optimizations of process factors under annular off-axis illumination (AOAI) using Taguchi method for design of experiment (DOE) for 0.35 ~tm dense line/space in i-line was reported in this paper. The optimized simulation results for both resolution and DOF are as follows: inner ring cri = 0.35, outer ring ~o= 0.70, NA = 0.5, negative bias on mask for line in dense line/space - 0.03 ~tm (L/S = 0.320/0.380 pan), positive bias on mask for isolated line - 0.03 ttm (iso. L = 0.38 ~aa), overlapped DOF (dense + isolated) - 1.86 ~tm, exposure dose - 278 mJ/cm 2. The experimental results are in good agreement with simulations. The optimized results by experiments with a NA of 0.57 and with AOAI are as follows: inner ring ~i = 0.35, outer ring Co = 0.70, negative bias on mask for line in dense line/space- 0.015 pan (L/S=0.335/0.365 lain), positive bias on mask for isolated l i n e - 0.03 ~ n (iso. L = 0.38 tam), overlapped DOF (dense + isolated) ~ 1.7 l~m, exposure time - 520 ms (exact dose uncertain). Without AOAI but with the same mask bias, the overlapped DOF is - 1.2 ttm by experiment. The overlapped DOF from mask patterns without any bias (L/S = 0.35/0.35 Inn; iso. L = 0.35 Ixrn) with 1/2 AOAI is - 0.93 lain; and from conventional illumination without mask bias is up t o - 0.72 ~tm at most. The DOF, proximity effect and resolution for dense L/S are obviously improved from 1/2 AOAI exposure after optimization ff compared with conventional exposure. The Taguchi method is also proved valuable in this study.
1. Introduction
Off-axis illumination (OAI) has several merits when applied to microlithography. The most important merit is that depth of focus (DOF) could be largely improved while conventional i-line processes remain unchanged. Next, the application of OAI is quite easy, the simplest way to apply OAI is the adding of an aperture stop in stepper. The disadvantage of OAI is that the improvement is dependent of pattern orientation from types of quadrupole, dipole and slit. The homogeneity of illumination beams also needs to be improved. Although annular OAI (AOAI) is not the best type of OAI for the improvement of resolution and DOF, however, AOAI is independent of pattern orientation, therefore, its applicability to production line is much higher than those other mentioned types [1,2]. Besides the using of OAI, the careful
optimizations of both mask design and related optical parameters are still very critical. In this paper, the Taguehi Genichi methodology of design of experiment (DOE) [3] has been applied by using L9 and L18 orthogonal arrays to study the optimizations of these parameters and their effects on the DOF and proximity effect for the 0.35 lim dense line/space patterns in i-line.
2. Experimental
The simulation tools are OPTOLITH from Silvaeo and SOLID-C V.5.10 from Sigma-C. Kim's model of resist development was chosen because of fewer variances needed for data input. The nmsl~ used for simulations and experiments are clear field conventional Cr mask. The positive tone resist used for simulation and patterning on wafer is TOK IP3100 which has a thickness o f - 1 0 7 0 nm and
0167-9317(97)/$17.00 © 1997 Elsevier Science B.V All rights reserved. PII: S0167-9317(96)00181-5
462 W-a. Loong et al. / Microelectronic Engineering 35 (1997) 461-464
without anti-reflection coating. The design rule is 0.35 larn with CD +10% in i-line. The 5X Nikon NSR i-line stepper (NA 0.57) with an OAI option is used for experiments. The design and calculations of DOE by Taguchi Genichi method is carried out by using a software package, Qulitek-4, from Nutek. SEM used is JEOL JSM 6300F.
3. Results and Discussion L Taguchi method
Orthogonal arrays of L9 (4 factors, 3 levels, 9 combinations) were applied mainly. The 4 control factors which are outer ring coherence co, ring type of AOAI (ratio of inner ring ci / outer ring Co), NA (numerical aperture) and bias on mask were selected. The factors such as baking time, baking temperature, development time etc. are quite routine processes in fab, and not very meaningful for
optimization. Therefore, these factors are not
selected in orthogonal arrays. Exposure dose which is a very importent factor for process optimization was tested by a series of various exposure time in lab to find out the best value. Hence, dose is also not selected as a factor. However, with the adding of dose as the fifth factor, LIB (5 factors, 3 levels, 18 combinations) was also tried. Since L18 is quite complicated and the simulation studies did not bring in a clear conclusion. Data generated from L 18 was not used in this study. The possible reason is that the complicated interactions may occur among these 5 control factors. Further study on this issue was not tried so far. Finally, the simpler and effective L9 and nominal-the-best type were applied for optimization
study.
11. SimulationThe stepper used has only several coherence settings for AOAI. The levels of Co and ring type were determined based on these available settings. The other levels were selected by lab's experiences. The table 1 shows the factors and levels. The table 2 indicates the average signal to noise ratios 77 of each level. The highest values of rl were underscored. The levels with underscores are optimized levels for
each factor. The optimized process factors by
simulations using Taguchi with AOAI are concluded as follows:
Inner ring ci = 0.35, outer ring Co = 0.70, AOAI ring type = 1/2, N A = 0.5, Negative bias on mask for
line in dense line/space - 0.03 ~m (L/S =
0.320/0.380 lun), Positive bias on mask for isolated line - 0.03 ~tm (iso. L = 0.38 ~tm), DOF (dense + isolated) - 1.86 ~tm, Dose - 278 mJ/cm 2.
111. Experiments
A. 1/2 AOAI with mask bias
A series of mask bias ( + 0.03 - --0.03 ~ma) and exposure time (460 - 580 ms) were tested by experiments using a Nikon stepper with limited AOAI coherence settings and with a NA of 0.57 which can not be adjusted. The regarding DOFs were measured. The optimized results are concluded as follows:
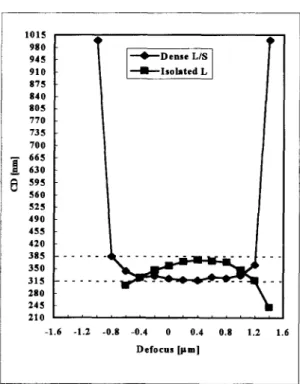
Inner ring ci = 0.35, outer ring co = 0.70, AOAI ring type = 1/2, Negative bias on mask for line in dense line/space - 0.015 lain (L/S=0.335/0.365 lain), Positive bias on mask for isolated line - 0.03 ~tm (iso. L = 0.38 ~trn), Exposure - 520 ms (exact dose is not sure). The smile curves from above experiments are shown in Fig. 1. The DOF is calculated as 2.0 lun for dense L/S; 1.7 pm for isolated line. The overlapped DOF (dense + isolated) is - 1.7 Ixrn. SEM of dense L/S is shown in Fig. 3 in which only slight proximity effect is indicated. The length of lines in outer flanks is only - 1 0 nm shorter than the line in center position. In general, the experimental results are in good agreement with simulations.
B. Conventional illumination with mask bias The smile curves without using of OAI (NA= 0.57, tr=0.52, exposure 540 ms) using same mask biases from experiments with AOAI are shown in Fig. 2. The DOF of dense L/S is calculated as 1.4 lma; of isolated line as 1.2 jxrn. The overlapped DOF (dense + isolated) is - 1.2 I~m. SEM of dense L/S is shown in Fig. 4. The serious proximity effect is observed. The length of lines in outer flanks is - 9 0 nm shorter than the line in center position.
C. 1/2 AOAI without mask bias
The overlapped DOF from mask patterns without any mask bias (L/S = 0.35/0.35 ~rn; iso. L = 0.35 Ixm) using 1/2 AOAI is ~ 0.93 ~rn. In theory, The
using of OAI could increase DOF largely. In
practice, the increase of DOF is rather limited. The regarding optical and process factors must be optimized to obtain the merit of OAI.
W-a. Loong et al. / Microelectronic Engineering 35 (1997) 461-464 463
Table 1. Factors and levels of L9
Factor A . (~o B. Ring Type C. NA D. Bias (lam)# Levels* 1 2 3 0.6 0.7 0.8 1/3 1/2 2/3 0.50 0.55 0.60 +0.03 0 -0.03
~o:Oegree
of coherence of outer ring. *:The starting level for each factor isidentified by an underscore.
#:+ stands for positive bias; - for negative bias.
Table 2. Average 77 of levels of factors
Factor h . (~o B. Ring Type C. NA D. Bias(lJm) Levels* 1 2 3 17.47 19.60 17.74 18.36 18.58 17.87 18.61 18.41 17.80 17.64 17.80 19.37 :Signal-to-noise (S/N) ratio.
* :The optimum level for each factor is identified by an underscore. 1 0 1 5 9 8 0 9 4 5 9 1 0 8 7 5 0 4 0 0 0 5 7 7 0 7 3 5 7 0 0 6 6 5 6 3 0 5 9 5 5 6 0
[
~ D e n s e L I S - - l - - - I s o l a t e d L , 2 ,iiiiii
4 9 0 4 5 5 4 2 0 3 8 5 3 5 0 3 1 5 2 8 0 2 4 5 | 2 1 0 i i i i i i i i i J , , , , , - 1 . 6 - 1 . 2 - 0 . 8 - 0 . 4 0 0 . 4 0 . 8 1.2 1.6 D e f o c u s [ p m ] 1 0 1 5 980 9 4 5 9 1 0 8 7 5 8 4 0 8 0 5 7 ? 0 7 3 5 7 0 0 6 6 5 6 3 0 5 9 5 5 6 0 5 2 5 4 9 0 4 5 5 4 2 0 3 8 5 3 5 0 3 1 5 2 8 0 2 4 5 2 1 0 -1.6 - - - 4 , - - D e n s e L / S I s o l a t e d Liiiiiiii
. . . , , i i i i , - 1 . 2 - 0 . 8 - 0 . 4 0 0 . 4 0 . 0 D e f o c u s [ p m ] I i i i 1.2 1.6Fig. 1 Smile curves from 1/2 AOAI. DOF of dense
L/S: 2.0 Fun; isolated line: 1.7 jam, overlapped DOF:
1.7 ~m.
Fig. 2 Smile curves from conventional exposure without OAI. DOF of dense L/S: 1.4 gin; isolated line: 1.2 Jim; overlapped DOF: 1.2 Fun.
464 W-a. Loong et al. / Microelectronic Engineering 35 (1997) 461-464
D. Conventional illumination without mask bias The DOFs were measured up t o - 0.72 pm at most in this case. The proximity effect were very serious for dense L/S. A serious rounding from terminals of both dense and isolated lines were also observed.
4. Conclusions
Fig. 3 SEM of 0.35 Ixrn dense L/S from biased mask and 1/2 AOAI indicated only slight proximity effect.
The correction of mask by negative bias for dense line/space and by positive bias for isolated line on clear field Cr mask were proved. The DOF and resolution for dense L/S are obviously improved from 1/2 AOAI exposure if compared with conventional exposure with or without mask bias. Optical proximity correction for arbitrary mask layouts is essential and necessary even with the using of OAI. The optimization of related optical and process factors is also the critical issue. Some sort of compromise or trade-off is needed to obtain a reasonably global improvement with an arbitrary mask layouts. Since DOF will be much shorter for arbitrary mask patterns, the chemical mechanical polishing (CMP) on wafer might become a key issue for deep submicron resolution. Applying Taguchi method in both simulation and experiment is also proved to be valuable and significant in the study of optimization of these control factors and variances [4].
Acknowledgment
This study was supported by National Chiao Tung University, National Science Council and United Microelectronics Corp. of ROC.
References
Fig. 4 SEM of 0.35 inn dense L/S from biased mask and conventional exposure without OAI indicated serious proximity effect.
1. T. Ogawa et al., SPIE, 2440 (1995) 772. 2. K. Ronse et al., J. Vac. Sci. Technol., 1112(6)
(1994) 3783.
3. M. S. Phadke, "Quality Engineering Using Robust Design", Prentice Hall, New Jersey,
1989.
4. W. A. Loong and C. H. Yeh, SPIE, 2440 (1995) 448.