A STUDY OF THE RELATIONSHIP BETWEEN TWO MUSICAL
RHYTHM CHARACTERISTICS AND HEART RATE VARIABILITY
(HRV)
Shih-Hsiang Lin
1, Yu-Chieh Huang
1, Ching-Yen Chien
1, Yi-Cheng Chen
1, Lei-Chun Chou
1,
Sheng-Chieh Huang
1, Ming-Yie Jan
21
Sense/TCM SOC Lab, Department of Electrical and Control Engineering, National Chiao Tung
University
2
Biophysics Lab., Institute of Physics, Academia Sinica
[email protected], [email protected], [email protected]
Abstract
Heart rate variability (HRV) is a measure of variations in the heart rate. Over the last 25 years, HRV analysis has became more and more popular as a non-invasive research and clinical tool for indirectly investigating both cardiac and autonomic nervous system (ANS) function in both health and disease area. How the musical rhythmic characteristics, tempo and complexity, affect the performance of HRV is studied in this work. By understanding the relationship between music and the function of ANS, we can improve our life and health by music – non-invasively and simply.
I. Introduction
It is a generally accepted concept that our emotion and physical state change when listening to different music. A variety of studies relating psychological and physiological effects of music have published [1]. Through the nervous control mechanisms, a neural coupling into the cardiac canters of the brain, it is possible to vary the heart rate of human subjects non-invasively by causing an entrainment of the sinus rhythm with external auditory stimuli [2].
The autonomic nervous system (ANS) acts as a control system and maintaining homeostasis in our body. Its sympathetic and parasympathetic divisions typically function in opposition to each other. For example, the sympathetic division accelerates the heart rate in an emergency; while the parasympathetic division decelerates the heart rate in the resting state. Therefore, it can be further inferred that there must be a connection between the musical stimuli and the synergistic action of the autonomic nervous system.
Some studies point out that different music can be used to improve our lives, for example, promoting sleep; reducing anxiety; assisting exercise; and even increasing brain activities [3-6]. And these daily activities are all closely related to the autonomic nervous system. HRV is an indicator of the autonomic nervous system. In other words, the effect of music on the mentioned activities can be assessed by HRV.
The rest of this paper is organized as follows. In section II, Method, the HRV signal processing, the algorithm of music analysis and the experiment design are introduced in detail. In section III, Experimental Results, the results of experiment and the statistic analysis are presented. In the final section, Conclusion, the contributions made in this study and suggest directions for further research are summarized.
II. Method
A. HRV Signal Processing
The overall signal processing flow of HRV analysis is shown as Fig. 1. The ECG signals were captured by a 3-channel portable device (MSI E3-80, FDA 510(k) K071085) at 500 Hz sampling rate. The QRS complex is the most notable waveform within the electrocardiograph (ECG). Due to its characteristic shape, it provides the fundamentals of the ECG analysis algorithms. In this study, the detection algorithm described by Hamilton and Tompkins was taken as the QRS detector in the ECG analysis flow because of its high reliability and low computational load [7].
2008 International Conference on BioMedical Engineering and Informatics
978-0-7695-3118-2/08 $25.00 © 2008 IEEE DOI 10.1109/BMEI.2008.305
1268
2008 International Conference on BioMedical Engineering and Informatics
978-0-7695-3118-2/08 $25.00 © 2008 IEEE DOI 10.1109/BMEI.2008.305
Fig. 1 The block diagram of the overall signal processing flow of HRV analysis
Although the adopted automatic QRS detection algorithm is highly reliable, some abnormal beats are still generated in the detecting process. The abnormal beats make the time domain signal associated with HRV exhibit a sharp peak and make the power spectral density estimation in the frequency domain analysis strongly unstable. This study utilized a simple algorithm for filtering and compensating these abnormal beats [8].
The RR interval is an irregular time-sampled signal and it has to be taken into consideration in the frequency domain analysis. If the spectrum estimation is calculated from this irregular signal in time domain, it assumes the additional harmonic components generated in the spectrum. Therefore, the RR interval signals need to be interpolated to obtain uniformly spaced intervals before analyzing and the detrending algorithm need to be used to remove the slow non-stationary trends [9].
The HRV measures of time and frequency domain analysis we want to observe are listed in Table 1. They are recommended for the short-term HRV analysis by The European Society of Cardiology and The North American Society of Pacing and Electrophysiology [10].
B. Music Analysis
Entrainment describes a process whereby two rhythmic processes interact with each other in such a way that they adjust towards and eventually ‘lock in’ to a common phase and/or periodicity [11]. For example, we tap foot and shake body to the beat of a song. Similarly, there are many naturally occurring rhythms within the human body such as the heartbeat, blood circulation, respiration and many others. Inspired
Table 1. The HRV measures of time and frequency domain analysis
Variable Units Description
Time domain analysis
MRR Ms Mean RR interval SDNN Ms Standard deviation of all RR
intervals. RMSSD Ms
The square root of the mean of the sum of the squares of differences between adjacent
NN intervals.
Frequency domain analysis
LF
ms
2 Power in low frequency range0·04–0·15 Hz
HF
ms
2 Power in high frequency range0·15–0·4 Hz Lf/HF / Ratio LF /HF
by the above, this study mainly explores the relationship between the musical rhythmic characteristics and the heart rhythm.
The two musical rhythmic characteristics that we think most important, tempo and complexity are defined as follows. The beat means the exact time we nod our head or tap our feet to the rhythm. So it is one temporal aspects of a musical work existing in the perception of the listener and a fundamental unit of the temporal structure of music. Once the beats in one piece of music were detected, the tempo could be decided as the unit, beats per minute (bpm) [12]. The other characteristic, complexity, is assessed by the subjects through 1 to 4 ratings (with 4 being more complex). And a measure of complexity that corresponds to a high degree with a human's subjective notion of complexity will be developed in the future.
It is a very complex problem because the perception of music is not straightforward. Multiple factors must be taken into consideration when discussing the impact of music on human beings: speed, rhythm, instrument, volume, complexity, harmony or melody, pitch and tone and in some case, lyrics. Drum loop music was chosen as the stimuli in this study because of its obvious and pure rhythm characteristic. Drum loops are prerecorded percussive segments that are designed to create a continuous beat or pattern when played repeatedly. The tempo and complexity of the four drum loop patterns chosen for experiment (L1 to L4) are listed in Table 2 as follow.
Table 2. Two rhythmic characteristics of the four testing drum loop samples.
L1 L2 L3 L4 Tempo (bpm) 89.6 105.3 139.5 176.5 Complexity (avg rating) 2.18 1.82 0.95 3.23 C. Experimental Design
There were all 22 healthy subjects, 15 males and 7 females, engaged in the experiment. The average age is 23. None of them are professionally trained in music before.
There are four testing rhythm patterns in this experiment (L1-L4), resulting in four trials for each subject. The subjects took each trial at the same time but in different days. All tests were carried out in moderate temperature, humidity, and light, with the subjects sitting and wearing headphones (eyes closed) in a quiet space. The overall experimental flow of one trial is shown in Fig. 2.
After an initial five minute period of quiet rest, the ECG signals were continuously recorded for the subsequent ten minutes. For between 5-10 minutes, there was no sound emitted from the headphones and the recorded data were used as the control. In the next 10-13 minute interval, the drum loop pattern was played. The headphones returned to silence in the final two minutes. There are two comparisons, C1 and C2, that we observed. The comparison C1 calculates the differences of the HRV measures between 10-13 and 5-8 minutes. The comparison C2 calculates the differences of the HRV measures between 13-15 and 8-10 minutes. Data are presented as the mean and the standard deviation are marked.
III. Experimental Results
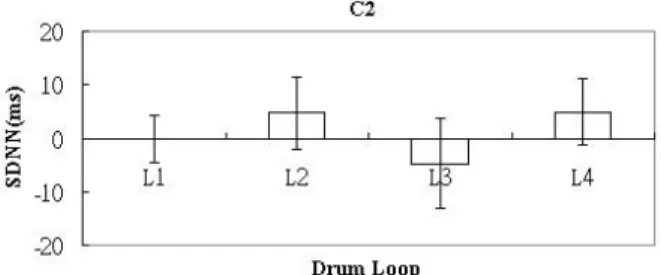
The comparison C1 and C2 of all HRV measures listed in Table 1. was studied. There are two notable findings in this study. One is the reduction of the LF/HF after listening to the drum loop as shown in Fig. 3. The other is the reduction of the SDNN (HRV) after listening to the drum loop with lowest complexity (L3 loop) as shown in Fig. 4. The decreased LF/HF was also observed in a randomly inserted short pause between the different songs in the previous study [1]. From Fig. 3, it can be seen that the L3 loop (faster and
Fig. 2 The overall experimental flow of one trial
Fig. 3 The obvious reduction of LF/HF after listening to the L3 loop
Fig. 4 The reduction of SDNN (HRV) after listening to the L3 loop
lowest complexity) resulted in the greatest reduction of the LF/HF measure. According to the previous studies, the LF measure stands for sympathetic activity and the HF measure for parasympathetic activity, so we use LF/HF ratio to observe the balance between the sympathetic and parasympathetic systems. The result of the proposed experiment shows that the L3 loop decreases the LF/HF ratio, so it is inferred that the rhythmic patterns with faster tempo and lower complexity make the subjects feel more relax and calm. It could speculate that this is why people relax by listening to the electronic dancing music, which typically has a faster tempo and a lowered complexity.
From Fig. 4, the entrainment phenomena can be observed. The comparison C2 of L3 shows the obvious SDNN decreasing. The SDNN measure can be imaged as the complexity of heart rate rhythm. The drum loop
with the lowest complexity (L3) synchronizes the heart rhythm and results in the reducing SDNN (HRV) in the resting period rather than the listening condition.
IV. Conclusion
In this study, the concept of two musical rhythmic features, tempo and complexity, modulating the ANS of human is proposed, the complete architecture of HRV and musical rhythmic characteristics analysis are constructed, and the simpler drum loop pattern which is more suitable to exclude the effect of other music features is used as the testing stimuli. The drum loop with faster tempo and lowest complexity was observed to decrease the LF/HF and SDNN measure significantly in the resting period after the loop listening. Although the physiological responses among the subjects sometimes differ largely, the observed results are worthy to study further. This work represents the first step to study the problem systematically, and the reliability of the results will be assessed in the future. Besides, the drum loop files (.wav) can be downloaded from the website: http://sense.cn.nctu.edu.tw/~shlin/
References
[1] L Bernardi; C Porta1; P Sleight, “Cardiovascular, cerebrovascular, and respiratory changes induced by different types of music in musicians and non-musicians: the importance of silence,” Heart, vol. 92, pp. 445-452, 2006. [2] P. T. Bason; B. G. Celler, “Control of the Heart Rate by External Stimuli,” Nature, vol. 238, pp. 279-280, Aug. 1972. [3] Julie E. Johnson, “The Use of Music to Promote Sleep in Older Women,” Journal of Community Health Nursing, vol. 20, no. 1, pp. 27-35, 2003.
[4] Cooke, Marie; Chaboyer, Wendy; Schluter, Philip; Hiratos, Maryanne, “The Effect of Music on Preoperative Anxiety in Day Surgery,” Journal of Advanced Nursing, vol. 52, no. 1, pp. 47-55(9), October 2005.
[5] Gertjan Wijnalda; Steffen Pauws; Fabio Vignoli; Heiner Stuckenschmidt, “A Personalized Music System for Motivation in Sport Performance,” IEEE Pervasive Computing, vol. 04, no. 3, pp. 26-32, July-September 2005.
[6] Christopher F. Chabris, “Prelude or Requiem for the 'Mozart Effect'?,” Nature, vol. 400, pp. 826-827, August 1999.
[7] Jiapu Pan; Willis J. Tompkins, “A Real-Time QRS Detection Algorithm,” IEEE Trans Biomed Eng, vol. BME-32, no. 3, pp. 230-236, 1985.
[8] Mateo, J.; Laguna, P., “Analysis of Heart Rate Variability in the Presence of Ectopic Beats using the Heart Timing Signal,” Biomedical Engineering, IEEE Transactions on, vol.50, no.3, pp. 334-343, Mar 2003.
[9] Tarvainen, M.P.; Ranta-aho, P.O.; Karjalainen, P.A., “An Advanced Detrending Method with Application to HRV Analysis,” Biomedical Engineering, IEEE Transactions on, vol. 49, iss. 2, pp. 172-175, Feb 2002.
[10] Task Force of the European Society of Cardiology and the North American Society of Pacing and Electrophysiology, “Heart Rate Variability: Standards of Measurement, Physiological Interpretation, and Clinical use,” Circulation, vol. 93, no. 5, pp. 1043-1065, 1996. [11] M Clayton; R Sager; U Will, “In Time with the Music: The Concept of Entrainment and its Significance for Ethnomusicology,” ESEM CounterPoint, vol. 1, 2004. [12] Simon Dixon, “Automatic Extraction of Tempo and Beat from Expressive Performances,” Journal of New Music Research, vol. 30, no. 1, pp. 39-58, 2001.