A 3D Scenes Reconstruction Method Based on
Less Featured Block Matching with a Binocular Vision System
Chin-Shyurng FahnDepartment of Computer Science and Information Engineering
National Taiwan University of Science and Technology Taipei, Taiwan 10607, Republic of China
csfahn@mail.ntust.edu.tw
Chia-Hua Chang
Department of Computer Science and Information Engineering
National Taiwan University of Science and Technology Taipei, Taiwan 10607, Republic of China
M9315022@mail.ntust.edu.tw
Abstract―This paper presents a 3D scenes reconstruction method based on less featured block matching with a binocular vision system. The basic idea of this paper is to utilize the imaging parallax of two cameras caused by different setup locations to immediately and precisely obtain the 3D information of the objects within the field of view of the cameras. To accomplish this, we first adjust the setup locations of the cameras and then conduct the pre-processing operations on both left and right images, such as im age rectification, grey -level transformation, and histogram equalization. After that, we divide the right image into blocks and adopt the Pearson product moment correlation coefficient to measure the similarity of the corresponding blocks in the left image. If the image variance of the current block is too large, we further partition this block into some sub -blocks to recursively perform the matching. We also propose an efficient searching algorithm to reduce the execution time of block matching. Once we fi nd the disparity of the corresponding blocks, we reconstruct the real 3D location by use of a stereo imaging model. The comparison of the 3D scenes reconstruction results with paralleled and non-paralleled cameras approaches is made through doing many experiments. We conclude that the paralleled cameras approach attain s higher reconstruction accuracy than the non-paralleled cameras approach does although the former is a special case of the latter.
Index Terms―Less featured block matching, binocular vision system, 3D scenes reconstruction, image rectification, Pearson product moment correlation coefficient.
I. INTRODUCTION
One of the important subjects in developing autonomous robots is machine vision, including stereo image processing, moving object detecti on, tracking, and recognition, and so on. In this paper,
we aim at presenting a 3D scenes reconstruction method to give robots of a robust stereo visual ability. The trade-off between accuracy and efficiency is made to realize our binocular vision system in real time. Stereo vision can be roughly classified into monocular stereo vision and binocular stereo vision. In 1987, Pentland produced a monocular stereo vision method called Depth from Defocus (DFD) and started a new idea of obtaining image depth infor mation [7]. In 1991, Leung et al. designed a system using monocular and binocular images as an accordance to determine the moving direction of a car -like robot [6].
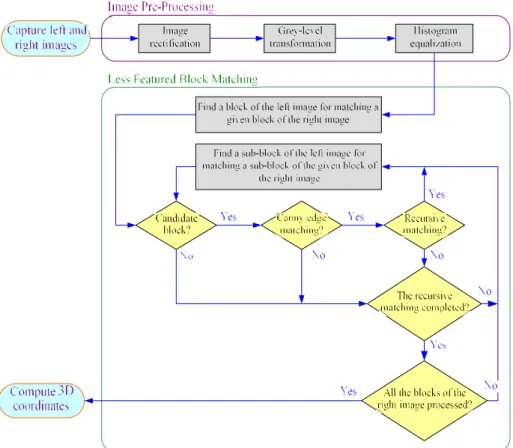
The key step of stereo vision is to find corresponding objects in binocular images. Some methods have been proposed to do this, such as epipolar geometry [1] and symmetry guided fusion [9]. Our developed method is based on a block matching scheme and emphasized to employ less features than the other approaches, so we can save lots of time in finding features and have not to recognize them for stereo matching. Additionally, some useful digital image processing techniques are adopted to achieve 3D scenes reconstruction. Therefore, any unstable or foul environment won ’t much affect our reconstructi on accuracy. The aforementioned advantages make our method be perfectly suitable for providing the 3D information of a working space during the navigation of an autonomous robot. Figure 1 shows the system flowchart of our 3D scenes reconstruction procedure.
Figure 1. System flowchart of our 3D scenes reconstruction procedure.
II. IMAGE PRE-PROCESSING
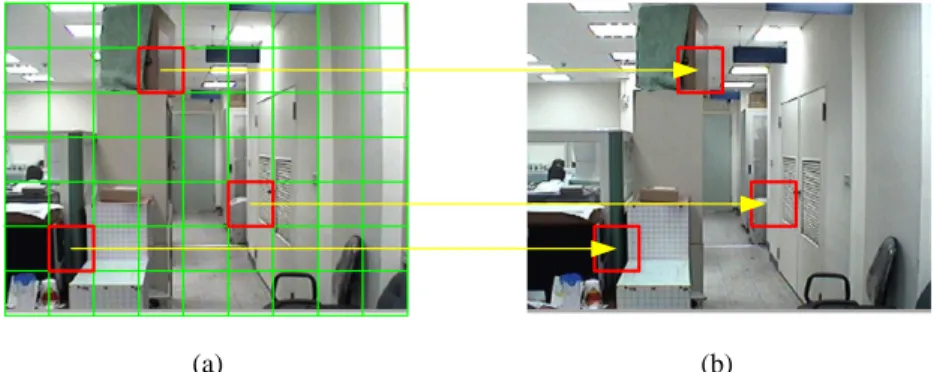
The image pre-processing of our 3D scenes reconstruction method is briefly described as follows. Because every camera has the image distortion problem and its quality is uneven, the first step is to rectify each input image we take. To improve the matching accuracy, the grey -level transformation and histogram equalization [ 5] are then performed on the images. Before such pre-processing, we adjust both camera s to be located at equal height as to match corresponding blocks in the two captured images. According to this arrangement, a matching block in the left image will be found at the similar elevati on of a template block in the right image by a shift distance as Fig. 2 shows. Nevertheless, we know that to realize this idea requires very accurate regulation to keep the cameras be always situated in the same
height. It is a time-consuming task and will not allow such a system to be implemented in real time.
To deal with the bargain between the time consumption of the accurate regulation and the large amount of probable matching blocks to be searched, a compromise solution is proposed below. We design a board in which a broad black line is printed as shown in Fig. 3(a), and put it in front of the two cameras to carry out the regulation in this research. The setup locations of the cameras will be adjusted to make the black lines in both the left and right images look approximately in the same height. As Figs. 3(b) and 3(c) illustrate, we can find out that even after elevation adjustment, the black lines of the two images are not exactly situated in the same height, but that is already enough for our system.
Furthermore, when this system is implemented on a robot, we can also utilize this simple
regulation method by setting up eyelashes for its both eyes. While the regulation is required, we can half close the eyes to obtain two strip images bounded by the upper and lower eyelashes as Fig. 4 shows. By this way, we can adjust the two cameras to be situated at the same elevation by comparing the coordinates of the black lines.
Besides, as this system may be equipped on a robot, the slight vibration caused by the motion of the robot and the rugged ground will lower the
accuracy of the regulation. Being restricted by the uneven quality of a camera, the imaging process may be possessed of the location deviation problem existing in pixels, even those cameras of the s ame type also cause different kinds of image distortion situations. These problems may affect the reconstruction accuracy of our system, so we have to conduct image rectification, including four main steps that are depicted in [3] minutely.
(a) (b)
Figure 2. Pairs of corresponding blocks located in: (a) the right image; (b) the left image.
(a) (b) (c)
Figure 3. Camera elevation adjustment: (a) an experimental regulation board; (b) the right image of (a); (c) the left image of (a).
(a) (b)
III. LESSFEATURED BLOCK MATCHING The following elaborates our proposed less featured block matching method which separates the left image into a set of blocks and looks for their corresponding blocks in the right image recursively. The Pearson product moment correlation coefficient is employed to measure the similarity of two blocks. Some searching area simplification schemes are also described for fast finding corresponding block candidates, one of which is determined to be the matching block with the aid of the Canny edge detector [ 2].
A. Pearson product moment correlation coefficient
In order to improve the robustness of the overall system and raise its efficiency, we propose a less featured block matching method to solve the 3D scenes reconstruction problem in real time. First, we classify the frame captured by the right camera as a template image (T-image) and each block of the T-image is called a template block ( T-block), and the frame captured by the left camera as a reference image (R-image) and each block of the
R-image is called a reference block ( R-block). Then
we divide the T-image into a set of T-blocks, each of which, say, consists of 2020 pixels, and look up every possible block in the R-image to find several corresponding block candidates. Moreover, one of them is identified as the corresponding block for a T-block. The matching method based on blocks is also called correlation -like method or template matching [5]. We calculate a cross-correlation coefficient to determine the similarity of two blocks, which is called Pearson product moment correlation coefficient [ 8] expressed below:
2
2 , , , , , ,
T R x y T R x y x y C m n T x y R x m y n T x y R x m y n (1)where T(x, y) represents the grey-level of the pixel located at coordinates (x, y) of a T-image and R(x-m,
y-n) represents the grey-level of the pixel located at
coordinates (xm y, n) of an R-image by
respectively translating m and n pixels in x- and
y-directions from the coordin ates ( , )x y ; andT
R
indicate the mean grey-levels of the currently
processed blocks in the T- and R-images,
individually. The cross -correlation coefficient ( , )
C m n is ranged from 1 to 1. If ( , )C m n 0, we regard the two blocks to be not matched. The more positive C m n is, the two blocks are more( , ) similar to each other; if C m n( , )1, it means the two blocks are exactly the same. In addition,
( , )
C m n is not changed due to different
measurement units, so this method is more robust under various lighting conditions. Even though, we cannot declare the R-block with the highest
( , )
C m n to be a corresponding block candidate yet,
because the Pearson product moment correlation coefficient is derived from grey -level information that is not equivalent to color information. Therefore, maybe the R-block with the highest
( , )
C m n just resembles to a T-block in the
grey-level situation.
B. Searching area simplification for corresponding block candidates
The computation of the Pearson product moment correlation coefficient is a compl icated process, because it compares every pixel of an R-block for a
T-block. Additionally, the amount of corresponding
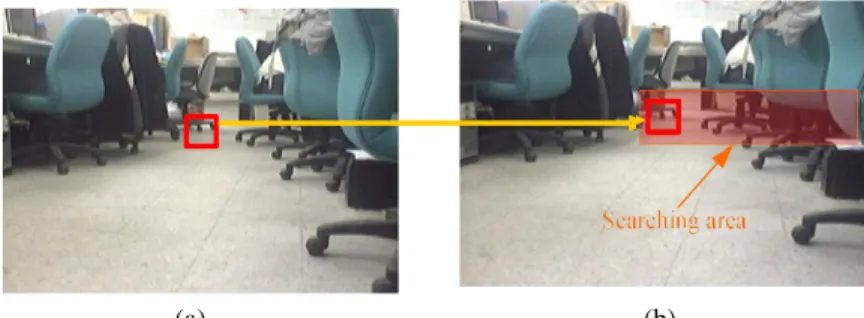
block candidates in the R-image is too large for us to implement this method in real time. To overcome the time-consuming problem, we fir st decide to set up both of our cameras in the same height; thus, the corresponding R-block will be located in the same elevation as the T-block; that is, we only have to look for the corresponding R-block candidates through referring the elevation of the T-block to the
R-image while finding a matching block. Fig. 5
illustrates such imaging relationship of the two cameras.
According to this, we just have to search the matching R-block from the location of the current
consequence, we can averagely moderate half of corresponding R-block candidates to be found. It means that the total matching times will be finally
decreased to 4.5% of the exhaustive searching approach.
Figure 5. Imaging relationship of left and right cameras.
(a) (b)
Figure 6. Searching area of matching R-blocks: (a) a T-block in the T-image; (b) the resized area of searching corresponding R-block candidates in the R-image.
After we get several corresponding R-block candidates, we further compare their edge information to judge one of them to be th e correct
R-block. Herein, we adopt the Canny edge detector
[2] which can provide clear and thin edges. Once the Canny edge detection has been applied to a
T-block and its correspondin g R-block candidates,
we compare the resulting images by use of their peak signal to noise ratios ( PSNR). If the PSNR is large, it means the difference between the two blocks is small.
C. Recursive block matching
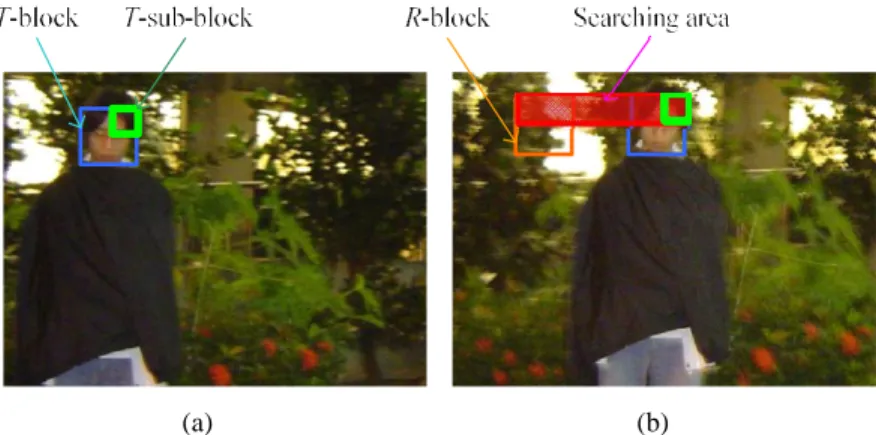
Actually, dividing a T-image into equal-sized blocks is not very rigorous, since many blocks are not so simple enough to describe their 3D locations by uniform coordinates. As to improve the
reconstruction outcome, if we fi nd a block whose color distribution or texture is complicated, we partition the block into several sub -blocks for more detailed matching. Fig. 7 shows that a cluttered
T-block contains three distinct objects with
different depths; using a single depth is n ot appropriate, so we divide the block into four sub-blocks for further matching. This concept is stated as follows. First, we calculate the sample variance of every T-block; if that of the current
T-block is larger than a threshold Tv,then we regard
this block as a cluttered one and divide it into four sub-blocks. The sample variance is expressed as
2 1 2 ( ) ,
B N j j B n N (2)mean grey-level of the block, and NBis the size of the block.
When we take a sub-block in the current
T-block for detailed matching, the rule of setting
the extent of the searching area is the same as the
previous subsection states. The only difference is that the width will be ranged from the left side of the T-block to the right side of its corresponding
R-block, and the height is identical with that of the
sub-block as Fig. 8 shows.
Figure 7. Sub-blocks of a cluttered T-block.
(a) (b)
Figure 8. Searching area of matching sub-R-blocks: (a) a sub-T-block in the T-image; (b) the resized area of searching corresponding sub-R-block candidates in the R-image.
IV. 3D SCENESRECONSTRUCTION In this section, we mainly utilize the perspective transformation theory [ 5] and the disparities between pairs of correspo nding points to reconstruct the real location of an object by means of algebraic manipulations.
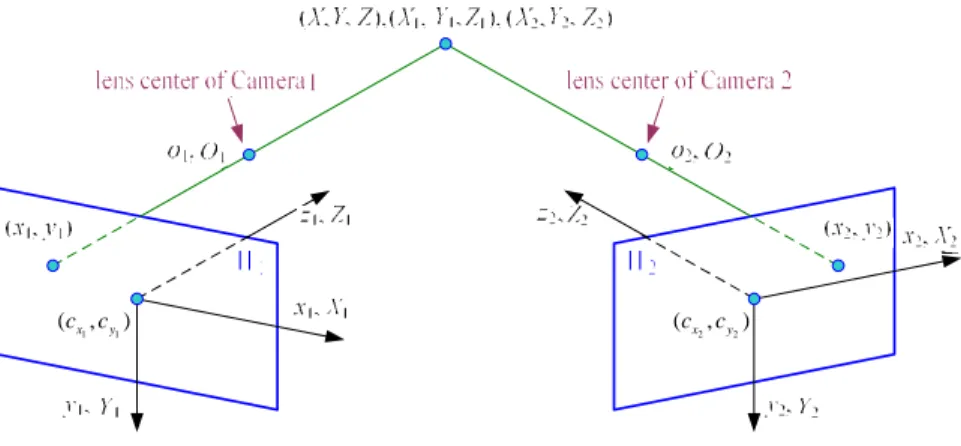
As to view the image formed by a 3D scene, we project 3D points onto an image plane . Fig. 9 shows the basic model of the imaging process with a single camera. The camera coordinate system
oxyz
has the image plane coincident with thexy-plane and its optical axis is along the z-axis. Let
the center of the lens is at the origin
o
of the camera coordinate system. Therefore, the center ofthe image plane is at coordinates (0, 0, ), and
is the focal length of the lens. Assume that the
camera coordinate system is aligned with the world coordinate system OXYZ.
We suppose all objects are in front of the lens; that is, Z . If we can find the relationship between a 3D point ( , , )X Y Z and its image point ( , )x y , it will be applied to estimating the real
location of the 3D point. The relationship is formed by the aid of similar triangles given below:
x X
Z
and y Y
Z
, (4)
where the negative signs mean that the 3D point and its image point are located in the inverted half space separated by the plane through the origin.
The following is to depict the 3D s cenes reconstruction method which is based on the two cameras not located in parallel. Fig. 10 graphically illustrates the model of the stereo imaging process with two non-paralleled cameras. Remark that the cameras located in parallel are just a special c ase.
y, Y x, X z, Z lens center image plane o, O (x, y) w(X, Y, Z)
Figure 9. Basic model of the imaging process with a single camera.
1 1
(cx,cy)
2 2
(cx,cy)
Figure 10. Model of the stereo imaging process with two non -paralleled cameras.
In this model, we set the left camera as Camera 1 and its coordinate system is o1x1y1z1, and the right
camera as Camera 2 whose coordinate system is
o2x2y2z2. Note that the centers of lenses of Camera l
and Camera 2 serve as the origins of the associated coordinate systems, respectively. The geo metric transformation from the coordinate system of Camera 1 to that of Camera 2 can be stated as follows:
2 2 2
1 1 1
,T T
R T
x y z x y z (5)
where R[R R Rx y z]T is the rotation matrix with 1 2 3 [ ] ,T x R r r r [ ] ,4 5 6 T y R r r r and [ ] ,7 8 9 T z R r r r respectively, and [ ]T x y z T t t t is the translation vector. It is assumed that each camera coordinate system is aligned with the associated world one. Therefore, we can acquire
2 2 2
1 1 1
.T T
R T
X Y Z X Y Z (6) Given a target point (X, Y, Z) in a 3D scene, its corresponding pixel in the rectified image plane of Camera 1 by only taking the first deviation term yields 1 1 1 1 1 1 1 1 1 2 1 (1 ) u d x d n X Z x Z x d Z x k d (7) and 1 1 1 1 1 1 1 1 1 2 1 (1 ) , u d x d n Y Z y Z y d Z y k d (8)
where k1 is the first deviation coefficient; xu1 and
1
u
y are the coordinates of the pixel without distortion, while xd1 and yd1 are those with
distortion; dn1stands for the distance normalized by
the focal length λ from an imaging point(xd1,yd1) to the image center
1 1
(cx,cy).
Similarly, the imaging relationship for Camera 2 is 2 2 2 2 2 2 2 2 2 2 1 (1 ) . u d x d n X Z x Z x d Z x k d (9) Hence, from (5) ~ (8), we can obtain the depth information of the target po int in the coordinate system of Camera 1 as follows:
1 ( z x) ( ) , Z Ct t A BC (10) where 1 1 1 1 1 2 3 2 2 1 1 (1 ) (1 ) , d n d n A r x k d r y k d r (11) 1 1 1 1 7 8 9 2 2 1 1 (1 ) (1 ) , d n d n B r x k d r y k d r (12) and 2 2 2 1 1 . n d C x k d (13)
By substituting Z1 into (7) and (8), we can get X1and Y1. Then the coordinates of the target point
in the world coordinate system have been estimated. To obtain its real coordinates, we consider image distortion situations and further derive the following equations: ( ) ( ) r r z x r r r Z C t t A B C (14) with 1 1
1 1 1
2 1 (1 ) x d n x r A r s x k d c (15) 1 1 1 1 2 3 2 1 ( (1 ) ) , y d n y r s y k d c r
1 1 1 1 7 2 1 (1 ) x d n x r B r s x k d c (16)
1 1 1 1 8 9 2 1 (1 ) , y d n y r r s y k d c and 2
2 2 2
2 1 (1 ) . x d n x r C s x k d c (17) Hence, 1
1 1 1
2 1 (1 ) x d n x r r X s x k d c Z (18) and 1
1 1 1
2 1 (1 ) . y d n y r r Y s y k d c Z (19) V. EXPERIMENTALRESULTSWe take several varied kinds of scenes as examples to verify the performance and robustness of our 3D scenes reconstruction system. Some of these exemplary images are captured by two parall eled cameras, and the others are under the situation of two non-paralleled cameras. The following orderly demonstrates and compares the reconstruction results from different situated conditions of the two cameras in either parallel or not.
A. Reconstruction results from two paralleled cameras
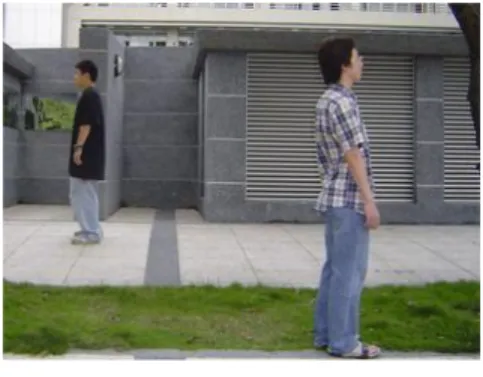
One example conducted in a sidewalk is illustrated in this subsection. The scene of this example contains multi people and some special obstacles such as a mirror and a fillister on the wall. Figs. 11(a) and 11(b) show the original scenes captured
by two cameras located in parallel. Fig. 1 1(c) is the 2D (X-Z) graph which is also called a top view graph where each red line indicates the location of an object in the scene. Fig. 11(d) is the 2D (X-Y)
graph which represents the block’s depth by different colors where a deeper color means the object is closer to the cameras.
(a) (b)
(c) (d)
Figure 11. 3D scenes reconstruction of the sidewalk: (a) the T-image of the original scene; (b) the R-image of the original scene; (c) the 2D (X-Z) graph of location information; (d) the 2D ( X-Y) graph of depth information.
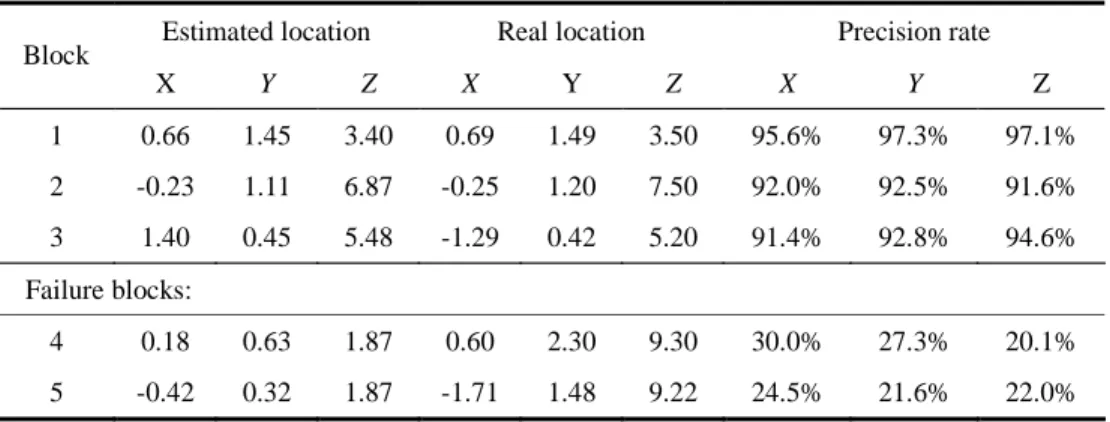
Now we take several blocks to inspect the accuracy of our reconstruction system as Fig. 1 2 shows. Table 1 lists the reconstruction results of these blocks. The coordinate system we use to record the 3D real location in the table is depicted as follows: the center of the baseline of both cameras acts as the origin of the X-axis, and its right side is positive coordinates and left side is negative coordinates; the ground level is referred to as the origin of the Y-axis and the camera’s location is considered as the origin of the Z-axis. The way
we evaluate the precisio n of the reconstruction results is estimated by the following equation for each dimension:
-loc -loc -loc
100% -loc R R E Precision rate R (20) where R-loc and E-loc stand for the real and estimated locations, respectively.
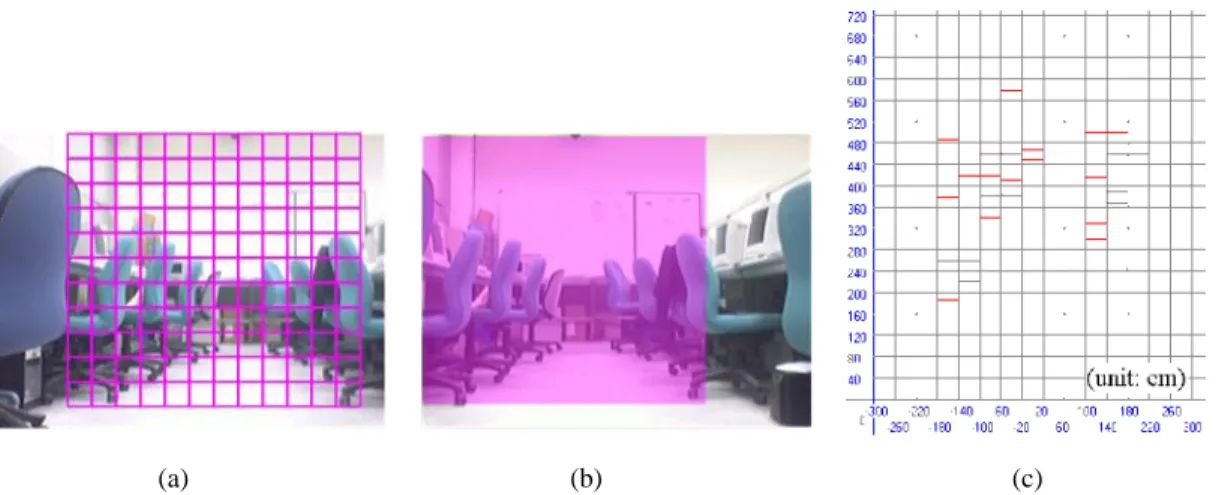
Figure 12. Several sampling T-blocks of Fig. 11(a). Blocks 1, 2, and 3 are all reconstructed correctly with the precision rate of over 90%. Block 4 covers the border between the wall and the building behind, and because part of the building in the
T-block is obstructed by the wall in front of it in the R-image, we can’t find the right corresponding
block. Block 5 contains a mirror, so that the cameras in different setup locations will receive dissimilar reflections, and we can ’t find a correct corresponding block.
In the 2D graphs, we set the block whose elevation is less than 15 cm from the ground won ’t be drawn. We also don’t draw the block whose depth is beyond 7 meters , because we have not to consider this long-distance scene, even our cameras can’t identify such a far dist ance correctly. The block filled with the ground called ground block usually has simple textures, which is easily to find a corresponding ground block with a high matching score. It reveals that the corresponding reference ground block is very near to the original location of a template ground block, and will make their disparity very small. That is to say, the ground block is usually considered as a block which is far away from the cameras, so that we have not to draw it. This is why our 2D graphs only sho w the objects excluding ground blocks. We can also see that about the last three columns of the captured image are hardly find corresponding blocks. This is because we place the two cameras paralleled with each other, so that these cameras will see differe nt scenes in the rim of their sight.
Table 1. The Evaluation of 3D Scenes Reconstruction Results of Figs. 11(a) and 11(b) Estimated location Real location Precision rate Block X Y Z X Y Z X Y Z 1 0.66 1.45 3.40 0.69 1.49 3.50 95.6% 97.3% 97.1% 2 -0.23 1.11 6.87 -0.25 1.20 7.50 92.0% 92.5% 91.6% 3 1.40 0.45 5.48 -1.29 0.42 5.20 91.4% 92.8% 94.6% Failure blocks: 4 0.18 0.63 1.87 0.60 2.30 9.30 30.0% 27.3% 20.1% 5 -0.42 0.32 1.87 -1.71 1.48 9.22 24.5% 21.6% 22.0%
If you watch the both captured images carefully, you may find out that the shades are little varied. The reason is that although the two cameras are of the same type, they may still have a slight difference in sensitivity in some situations. Even though, this problem will not affect th e robustness of our reconstruction system owing to adopting the less featured matching method.
B. Comparison of the reconstruction results from paralleled and non-paralleled cameras
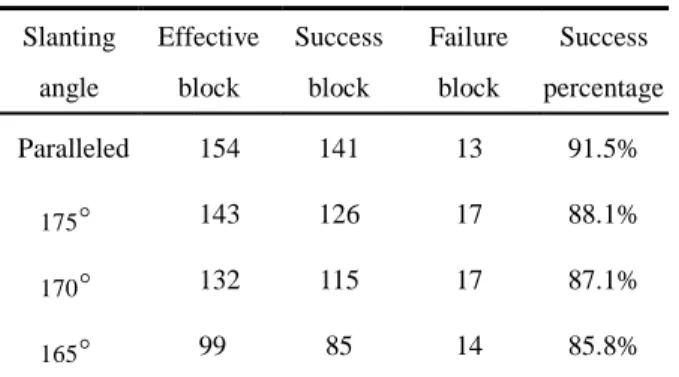
What follows demonstrates some various scenes of a laboratory as an experi mental example using a pair of non-paralleled cameras. We will evaluate the reconstruction results of these scenes with different slanting angles of two cameras such as 180 , 175 , 170 , and 165 . Each case of the
cameras situated with the slanting angles will be examined individually by picking several representative blocks for detailed comparison. And we will only show the reconstruction results of the matching blocks which are within the overlapping area of the two captured images. If the overlapping area gets confused, even the corresponding blocks can’t be found in the R-image, they are sure to be reconstructed wrong. Besides, because the overlapping areas are all unlike, we will highlight them in purple color as to be easily identified.
Figs. 13 and 14 reveal the 3D scenes reconstruction results that are derived from the two cameras equipped with the slanting angles
of 180∘(on the paralleled condition) and 170∘ (on the non-paralleled condition), respectively. The block with the precision rate of above 90% is considered as success estimation, and that below 90% is failure estimation. From this experiment, we find out that the different slanting angles of the two equipped cameras will cause the size of the overlapping area of the two captured images to change. Therefore, we define “Effective blocks” to be the total amount of the blocks that simultaneously appear in both the ima ges. The evaluation of the 3D scenes reconstruction results is manifested in Table 2.
(a) (b) (c)
Figure 13. 3D scenes reconstruction of using two cameras situated wit h the slanting angle of 1 80∘: (a) the T-image of the original scene; (b) the R-image of the original scene; (c) the 2D ( X-Z) graph of location information.
(a) (b) (c)
Figure 14. 3D scenes reconstruction of using two cameras situated with the slanting angle of 170∘: (a) the T-image of the original scene; (b) the R-image of the original scene; (c) the 2D ( X-Z) graph of location information.
Table 2. The Evaluation of the 3D Scenes Reconstruction Results from the Two Cameras Situated with Different Slanting Angles
VI. CONCLUSIONS
In this paper, we have presented a robust 3D scenes reconstruction system using binocular vision techniques. With the less featured matching idea, we can find good pairs of an objec t within the right and left images even in a low luminance or blurred features environment which is tedious for feature-based methods to accomplish. And by means of the two-stage confirmation approach, combining the Pearson product moment correlation coefficient and the Canny edge detector, the corresponding blocks can be found correctly. We also adopt the recursive scheme to make our reconstruction results more delicate. The saving of the execution time is emphasized in this work, too. We not only renovate the image distortion caused by the lens of a camera, but can also handle the situations of the variations arisen from different slanting angles between two setup cameras. As revealed in the experimental result s, our proposed system gives a satisfactory reconstruction performance for various scenes. It is suitable to serve as a stereo vision system equipped on an autonomous robot.
ACKNOWLEDGEMENT
The authors are thankful for this work supported in part by the National Science Council of Taiwan (R. O. C.) under Grant NSC94 -2218-E011-012.
REFERENCES
[1] R. Bunschoten and B. Krose, “Robust scene reconstruction from an omnidirectional vision
system,” IEEE Transactions on Robotics and
Automation, vol. 19, no. 2, pp. 351-357, 2003.
[2] J. Canny, “A computational approach to edge detection,” IEEE Transactions on Pattern Analysis and Machine Intelligence , vol. 8, no. 6,
pp. 679-698, 1986.
[3] D. A. Forsyth and J. Ponce, Computer Vision: A
Modern Approach, Prentice Hall, Upper Saddle
River, New Jersey, 2003.
[4] L. M. G. Fonseca and B. S. Manjunath,
“Registration techniques for multisensor remotely sensed imagery,” Photogrammetric
Engineering and Remote Sensing , vol. 62, no. 9.
pp. 1049-1056, 1996.
[5] R. Klette and P. Zamperoni, Handbook of Image
Processing Operators, John Wiley & Sons,
New York, pp. 148-156, 1996.
[6] M. K. Leung, Y. Liu, and T. S. Huang,
“Estimating 3D vehicle motion in an outdoor
scene from monocular and stereo image sequences,” in Proceedings of the IEEE Workshop on Visual Motion , Princeton, New
Jersey, pp. 62-68, 1991.
[7] A. P. Pentland, “A new sense for depth of field,”
IEEE Transactions on Pattern Analysis and Machine Intelligence, vol. 9, no. 4, pp. 523-531,
1987.
[8] W. K. Pratt, Digital Image Processing, 2nd Edition, John Wiley & Sons, New York, 1991. [9] H. Zhang and S. Negahdaripour, “Fast and
robust progressive stereo reconstruction by symmetry guided fusion,” in Proceedings of the
IEEE Oceans 2005- Europe Conference, Brest,
France, vol. 1, pp. 551-556, 2005. Slanting angle Effective block Success block Failure block Success percentage Paralleled 154 141 13 91.5% 175 143 126 17 88.1% 170 132 115 17 87.1% 165 99 85 14 85.8%