商品通道指標及威廉指標應用於外匯市場之獲利性研究 - 政大學術集成
38
0
0
全文
(2) Abstract It has long been a controversial question to scholars whether or not technical analysis is efficient. Although some scholars believe technical analysis is useless, it has been broadly used in the financial markets for a long time. As foreign exchange markets are one of the most important financial markets with huge trading volume in the world, this paper reviews many past literature and extracts trading strategies from some real investors in Taiwan’s foreign exchange markets. Additionally, this paper focuses on testing the trading performance of applying the technical indexes which have not been researched in the academic field but have often been utilized in the real exchange markets.. 政 治 大. This thesis mainly concentrates on the exchange market of New Taiwan Dollar against US dollar and examines the trading performance of utilizing two technical. 立. indexes which have been used but not been researched in foreign exchange markets :. ‧ 國. 學. Commodity Channel Index (CCI) and Williams Overbought/Oversold Index (WMS). The dataset of this paper is from January 1st, 1993 to December 28th, 2012, an overall. ‧. of 20 years and 5279 times of daily NTD/USD exchange rates between banks. To complete the back-testing, this research utilizes the highest, lowest and close price. Nat. sit. y. from those materials and analyzes the technical strategies which obtain excess profits.. al. er. io. By generalizing the results of those trading strategies, investors can find the best. n. trading rules and increase the returns from applying these two technical indexes to foreign exchange market.. Ch. engchi. i Un. v. The results of this research are as follows: 1. WMS’s performances are chiefly superior to the CCI’s performances. Not only the total profit rates of technical strategies from WMS are higher than the total profit rates of trading rules from CCI, but also the rates of profits on WMS always demonstrate a better result than the rates of profits on CCI. 2. Both of these two technical indicators can produce excess profits. Compared to the average annual return of buy-and-hold strategy in this market, both of the two technical indexes conduct a better performance. As a result, these two technical indexes are effective in NTD/USD market.. Key words:Technical Index, Foreign Exchange Transaction, Foreign Exchange Market, Exchange Rate, Technical analysis I.
(3) 摘. 要. 由於技術分析之有效性一直為學者們所探討且備具爭議的議題,有部分學者 認為技術分析無效,但實務上,技術分析在金融市場上的應用卻相當廣泛;此外, 由於外匯市場為交易量龐大且眾多學者研究之重要金融市場,故本文回顧過去多 項國內、外研究,並經由實地探訪台灣外匯市場上之投資人,針對仍未被研究, 但實務上所採用之技術指標進行多項交易策略之模擬並探討其獲利性。 本文主要針對新臺幣兌換美元之匯市,探究將商品通道指標(Commodity Channel Indexes)及威廉指標(Williams Overbought/ Oversold Index)兩種技術分析 指標應用於此外匯市場上之獲利情形,採用1993年1月1日至2012年12月28日,共. 政 治 大. 計二十年,5279筆銀行間交易之新台幣兌美元之匯率日間資料,擷取其最高價、. 立. 最低價及收盤價並透過程式交易進行回溯測試,並針對此兩種技術指標建構多種. ‧ 國. 報酬以及提高交易的成功機率與獲利能力之法則。. 學. 交易策略,歸納並分析其中可獲得超額報酬之技術策略,期能找出獲得最佳投資. ‧. 藉由Matlab運算處理後,將此兩種技術指標應用於過去20年之歷史價格進行. Nat. sit. y. 回溯測試,本實證研究發現:1. 採用威廉指標之策略普遍績效都較採用商品通. er. io. 道指標來的好,不僅在總報酬率的表現上比較好,採用威廉指標所執行的交易獲. al. n. iv n C hengchi U 得的績效高於買賣策略應用於此市場之平均年化報酬率,故證實此兩種技術指標 利的機率也必較高。2. 由於此兩技術指標應用在新台幣兌美元之外匯市場上可. 應用在新台幣兌美元的外匯市場上,均可獲得超額報酬,此兩技術指標在新台幣 兌美元市場是有效的、可獲利的。. II.
(4) Table of Contents 1.. Introduction ............................................................................................................ 1. 2.. Literature Review ................................................................................................... 5. 3.. Data Description ................................................................................................... 11. 4.. Methodology ......................................................................................................... 12 4.1 Technical Trading Rules .................................................................................... 12 4.1.1 Commodity Channel Index (CCI) ............................................................... 12. 政 治 大. 4.1.2 Williams Overbought/ Oversold Index (WMS) .......................................... 15. 立. Empirical Results .................................................................................................. 17. 學. ‧ 國. 5.. 5.1 Returns on Commodity Channel Index (CCI).................................................... 17. Conclusion and Future Research .......................................................................... 27. sit. y. Nat. 6.. ‧. 5.2 Returns on William Index (WMS) ..................................................................... 22. n. al. er. io. 6.1 Conclusion .......................................................................................................... 27. Ch. i Un. v. 6.2 Future Research .................................................................................................. 29. engchi. Reference ..................................................................................................................... 32. III.
(5) List of Figures and Tables Table 1 Summary of total parameters of CCI .............................................................. 14 Table 2 Summary of total parameters on WMS .......................................................... 16 Table 3 List of all the values of three parameters of CCI with best performance ....... 19 Table 4 Summary of the performance of all the trading rules of CCI ......................... 20 Table 5 Statistical summary of the performance of all trading rules of CCI ............... 21 Table 6 List of all the values of three parameters on WMS with best performance .... 24 Table 7 Summary of the performance of all the trading rules on WMS index ............ 25. 政 治 大. Table 8 Statistical summary of the performance of all trading rules of WMS ............ 26. 立. ‧ 國. 學. Figure 1 Historical NTD/USD exchange rates for 20 years ........................................ 11 Figure 2 Scatter diagram of average annual returns on CCI when a and b are fixed .. 17. ‧. Figure 3 Scatter diagram of average annual returns on CCI when n and b are fixed .. 18. Nat. sit. y. Figure 4 Scatter diagram of average annual returns on CCI when n and a are fixed .. 18. n. al. er. io. Figure 5 Comparison of Returns on CCI and BH strategy .......................................... 19. i Un. v. Figure 6 Scatter diagram of average annual returns on WMS when a and b are fixed 22. Ch. engchi. Figure 7 Scatter diagram of average annual returns on WMS when n and b are fixed 23 Figure 8 Scatter diagram of average annual returns on WMS when n and a are fixed 23 Figure 9 Comparison of Returns on WMS and BH strategy ....................................... 24 Figure 10 Comparison of average annual returns between CCI and WMS index ....... 27 Figure 11 Comparison of rates of profits between CCI and WMS index .................... 28 Figure 12 Comparison of average annual returns with BH strategy ............................ 28. IV.
(6) 1. Introduction The foreign exchange market is the biggest financial market in the world. The average trading volume of the global foreign exchange market is over 5 trillion US dollars every day. Hence, the economics of exchange rates is one of the primary focuses of international economists. However, much literature and many empirical studies indicate that the prediction ability of traditional economic models is not significant. Technical analysis has been one of the popular tools for investors to conduct profitable trading strategies. Technical. 治 政 analysts attempt to forecast prices by the study of大 historical data, such as past 立. prices, volume and other observables because they believe that history will. ‧ 國. 學. repeat all the time. However, it has been a controversial topic whether or not. Nat. y. ‧. technical analysis is effective in the long-term.. er. io. sit. Fama (1970) demonstrates that technical analysis is useless and investors cannot obtain excess profits by using technical trading rules because the real. al. n. iv n C market is weak form efficiency, h which the information reflects on the i U e n means g c hall. price immediately. Many researchers agree with Fama (1970) and criticize that the profits obtained from using technical analysis cannot exist for a long time and do not have scientific basis. All the excess profits of technical analysis are just coincidental, because the same results will not happen repeatedly. However, technical analysis did not vanish but came out with more and more trading rules since Hamilton (1922) proposed the Dow Theory. If technical analysis is useless indeed, then it would not be popular to this day.. 1.
(7) Alexander (1961), Levy (1967), Sweeney (1986), Brock, Lakonishok and LeBaron (1992, BLL) , Hsu and Kuan (2005) all show technical analysis can produce excess profits, although many scholars still propose the opposite opinions and do not believe that technical analysis is useful. However, much empirical research denotes that using technical analysis in foreign exchange markets is profitable and there are many traders who rely on these tools to make their strategies. For example, Taylor and Allen (1992). 政 治 大 trading decision tools. Also, Levich and Thomas (1993) demonstrate that MA 立 indicate that 90% of foreign exchange traders use technical analysis as their. ‧ 國. 學. and filter rules conduct significant profitability on the currency market on BP,CD,DM,JY,SF. LeBaron (1996) shows that it was significantly profitable. ‧. by using MA trading rules in the currency of DM and JY, except for the period. y. Nat. io. sit. of government intervention. Szakmary and Mathur (1997) denote that MA. n. al. er. technical rules conduct significant excess profits in the currency market of BP,. iv. n Numerous empirical SF, JY, DM, and the profit C rate is around 2.2 U ~ 3.8%. hengchi. studies of technical analysis have also been carried out, particularly since the 1960s. Although much literature denotes that technical analysis has significant profitability, it is not applicable to all the markets in the world. Lin (2007) demonstrates that the Foreign Exchange market is in weak form efficiency by using 11 currencies and 8 technical indicators, meaning that investors cannot obtain excess profits from the market by using these eight technical rules,. 2.
(8) including MA, MACD, KD, SAR, MTM, DMI and channel. Also, Chuang, Lin and Kuo (2011) indicate that it is profitable using four popular technical rules in inter-day trading but not in intra-day trading with the exchange rate of NTD/USD. As a result, I try to find some real traders in Taiwan’s exchange market in order to search if there are any other useful and popular technical strategies that have not been researched in the literature. The main purpose of this paper is to prove that some technical indexes that show positive performance still exist.. 立. 政 治 大. From my interviews with some of the real traders in Taiwan, I chose these. ‧ 國. 學. two technical indexes as the topic of this paper for the following reasons. Lai. ‧. Ruei-tong from SinoPac Bank utilizes Commodity Channel Index as an essential indicator to trade in stock markets and earns well profits by using this. sit. y. Nat. technical indicator. Also, Lin Benson, who works in Fu-wua Securities. er. io. Investment Trust in Taiwan, applies William Index to Taiwan’s futures a. n. iv l C n U obtains hexcess e n gprofits c h i sometimes.. exchange markets and. Furthermore, You. Ying-hong, a manager at Yuan-ta Financial Holdings Company, adopts both Commodity Channel Index and William Index as trading signals in his investment portfolio. To conclude from the above three points of views, these two technical indicators might be efficient technical tools and worth further research. Hence, the main purpose of this paper is to extend and to enrich the earlier research on technical trading rules by applying Commodity Channel Index and Williams Index to the foreign exchange market in Taiwan.. 3.
(9) The remainder of the paper is organized as follows: Section 2 reviews the past literature related to using technical analysis in foreign exchange markets; Section 3 shows the resource of the dataset and some statistics summary of this data; Section 4 demonstrates the technical trading strategies by using these two technical indicators; Section 5 presents the empirical results about the performance of these two sets of technical strategies; lastly, Section 6 concludes the results of this paper and outlines some other essential issues of the thesis for future research.. 立. 政 治 大. ‧. ‧ 國. 學. n. er. io. sit. y. Nat. al. Ch. engchi. 4. i Un. v.
(10) 2. Literature Review There is no guarantee that investors are always mentally rational. Therefore, they try to avoid unfounded behaviors and adopt program trading to make their investments more reason-based. Over time, investors have built up many trading models to avoid the intervention of irrational trading decisions and have created new trading models with better performance. Therefore, technical analysis has become a commonly used investment tool in financial markets.. 政 治 大. Is technical analysis effective? Fama (1970) addresses Efficient Market. 立. Hypothesis (EMH) which considers that all the market information is already. ‧ 國. 學. reflected on the price and investors cannot obtain excess profits from predicting. ‧. future prices. Shleifer (2000) also signifies some other points: 1. Investors are. sit. y. Nat. rational, so they can conduct rational price evaluation. 2. Even if some. er. io. irrational investors exist, the trading are stochastic, price will go back to. n. a lof arbitrage and the offset iofv trading. efficient at the end because Ch. n engchi U. However, from the past to the present, there has been a growing number of empirical studies that find that some abnormal phenomenon cannot be explained, such as the January effect, week effect and the scale effect. Some scholars began to doubt the authenticity of efficient markets, and a lot of research verifies that technical analysis can indeed obtain excess profits in stock markets. Alexander (1961) uses the ratio of filter rules (FR) between 0.5% and 50%. 5.
(11) to test Dow Jones Industrial Average (DJIA) from 1897 to 1959 and Standard & Poor’s 500 Index (S&P 500) from 1929 to 1959. Without considering transaction cost, the returns from FR are much better than buy-and-hold strategy. This study brought on the attention of several scholars. Mandelbrot (1963) points out the mistake in Alexander’s (1961) study: investors cannot trade on time when the signal shows up, so the bid price is always higher and the ask price always lower. Alexander (1964) revised the model based on Mandelbrot and found out FR could not beat buy-and-hold strategy.. 治 政 Following Alexander’s (1964) study, Sweeney大 (1986) applies FR to foreign 立 ‧ 國. 學. exchange markets and tests if the investors can obtain excess profits in Deutsche Mark. Although much literature points out FR can beat buy-and-hold. ‧. strategy in many countries, those articles all neglect the risk and the statistical. y. Nat. io. sit. significance of the returns. Hence, Sweeney (1986) applies the terms of Capital. er. Asset Price Model (CAPM) and compares buy-and-hold strategy and trading. n. a. v. rules with considering riskl premium. Sweeney (1986) n i found the smaller the C. hengchi U. ratio of FR, the more excess profits the trading rules can get related to buy-and-hold strategy, especially when the ratio of FR is 1%. Besides FR, scholars also test other trading rules to see whether technical analysis is effective. Levy (1967) utilizes relative strength index (RSI) to test the stock price in New York Stock Exchange (NYSE) from 1960 to 1965. This method considers that past price is relative to future price, so if the stock performed strong in the past, it will perform relatively stronger in the future. The result shows that RSI can beat buy-and-hold strategy and obtain excess 6.
(12) profits. Jenson (1967) criticizes the view-point of Levy (1967). He argues the results of Levy (1967) are not strong and has selection biases. With consideration of more countries and transaction costs, these trading rules could not obtain excess profits, which shows technical analysis cannot beat the market. In addition to simple trading rules, some other scholars utilize different. 政 治 大. trading rules combinations. Pruit and White (1988) created Cumulative Volume,. 立. Relative Strength, Moving Average (CRISMA) and conducted studies which. ‧ 國. 學. resulted in that these strategies can obtain a better performance than. ‧. buy-and-hold strategies regardless of the consideration of transaction cost.. sit. y. Nat. Lo and MacKinlay (1990) quantify the biases of data snooping and focus on. a. er. io. the evaluation of the relation between financial asset and data snooping. Data. n. v snooping biases exists because data. It is easy to l there is only one real ihistory n U i e h n g c However, the profits do not come find trading rules to obtain excess profits.. Ch. from the effectiveness of the trading rules; instead they come from probabilities, which means people can find a trading rule obtaining excess profits when given a long enough period of time. But the trading rule can just prove that it was effective in the past and does not mean it will conduct the same results in the future. Therefore, many researchers began to have differing views concerning the effectiveness of these technical trading rules and utilized statistical test to prove if the trading rules can continuously work in the market. 7.
(13) Brock, Lakonishok and LeBaron (1992, BLL) used bootstrap to test two of the simplest and most popular trading rules - moving average and trading range break by utilizing the Dow Jones Index from 1897 to 1986. The overall purpose of this paper is to provide strong support for the technical strategies. The returns obtained from these strategies are not consistent with four popular null models: the random walk, the AR (1), the GARCH-M, and the Exponential GARCH. Although BLL tried to solve data snooping biases, they still could not find a strong statistical explanation.. 立. 治 政 大 White (2000) public. Reality Check (RC),. ‧ 國. 學. provides a more strictly statistical method to test the effectiveness of trading rules. Sullivan, Timmermann and White (1999, STW) utilized White’s Reality. ‧. Check to evaluate five simple technical trading rules while quantifying the. y. Nat. io. sit. data-snooping biases and fully adjusting for its effect in the context of the full. er. universe from which the trading rules were drawn. Hence, for the first time,. n. a. v. i l C STW(1999) expanded BLL(1992)’s research to nuniverse of 26 kinds of. hengchi U. technical trading rules, applied the rules to 100 years of daily data on the DJIA, and determined the effects of data-snooping. STW(1999) indicated that the performance of technical analysis are much better than buy-and-hold strategy, but they also found that adding more trading rules could not make the effectiveness more significant. Consequently, STW (1999) offered the possibility that all the excess profits from technical trading rules were just a coincidence. They had chosen exactly the best trading rules suitable for that period of time. 8.
(14) Although White’s Reality Check test can solve the problems of data snooping, Hansen (2005) points out two drawbacks of White’s Reality Check test. First, the average return does not standardize. Secondly, White’s RC is based on least favorable configuration, so the expected returns from the trading rules are all equal to the returns of the benchmark model. Therefore, White’s RC conducts a worse result because the test contains some worse trading rules. In other words, although all the testing trading rules can beat the benchmark model, the p-value still goes up because the test also covers some of the trading. 政 治 大. rules with less explanation power, which makes the probability of rejecting null. 立. hypothesis decline.. ‧ 國. 學. As to foreign exchange markets, economic theories believe that exchange. ‧. rates depend on the fundamental factors of countries, such as price, interest rate,. y. Nat. io. sit. currency supplies and national real income. However, Meese and Rogoff (1983). er. indicate that these traditional exchange rate models (Frenkel-Bilson Model,. n. a. v. i Dornbusch-Frankel Modell C and Hooper-Morton nModel) have significant. hengchi U. predictability only in the sample data but not outside the sample data, which even Random Walk Model can conduct a better prediction. Hooper (1997) demonstrates that the traditional economic model and fundamental factors cannot explain the changes of historical exchange rates. Engel and West (2005) even denote that exchange rates can affect microeconomics by Granger Causality Test instead. As a result, the predictability of the foreign exchange rate is still a puzzle. Many scholars try to figure out this question by testing the trading rules. If 9.
(15) the empirical results show trading rules make excess profits, then the weak form efficient market does not exist. Lin (2007) conducts back testing through program trading systems from 1986 to 2005. For the daily exchange rate data of 11 currencies, 8 frequently used technical analysis indicators are selected: MA, MACD, KD, SAR, MTM, SAR, DMI and Channel. The empirical analysis indicates: 1. The trend-following trading systems is superior to the range trading systems. 2. Technical analysis cannot obtain excess returns. Therefore, the weak form foreign exchange market efficiency stands, which. 政 治 大. means it is unprofitable applying those technical analysis indicators to foreign. 立. exchange markets.. ‧ 國. 學. Also, Chuang, Lin and Kuo (2011) utilize Hansen’s Superior Predictive. ‧. Ability test (2005) to exam the performance of technical trading applied to. y. Nat. io. sit. NTD/USD foreign exchange market. This paper indicates that it is profitable. er. using four popular technical rules in inter-day trading but not in intra-day. n. a. v. trading with the exchange lrate n i words, the profitability C of NTD/USD. In other. hengchi U. does not perform better when people use less time to make trading decisions, but technical analysis is still effective in some markets. As a result, the main purpose of this paper is to extend and to enrich the earlier research on technical trading rules by applying CCI and WMS Index to Taiwan’s foreign exchange market. Consequently, this thesis demonstrates the empirical tests on using two commonly used indicators in Taiwan’s foreign exchange market and investors can obtain new technical trading rules from this research and increase the profitability of these two trading indicators. 10.
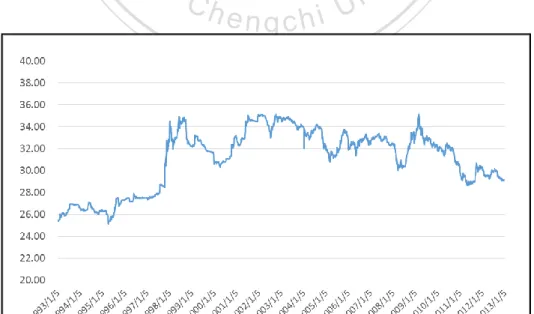
(16) 3. Data Description This paper uses the highest, lowest and closing exchange price of New Taiwan Dollar against U.S dollar (NTD/USD). The whole dataset starts from January 5th, 1993 to December 28th, 2012, twenty years in total, provided by Taipei Foreign Exchange, Inc. There are 5,279 trading days over the entire period. Trading rules can be applied to various data frequencies; the data frequency. 政 治 大 number of observations to立 allow for the formation, recurrence and investigation. utilized in this paper is daily. For a 20-year period, this provides a sufficient. 學. ‧ 國. of the most popular technical trading rules. Figure 1 shows the whole date in this paper, NTD/USD exchange rates change around 20-year.. ‧. Figure 1 Historical NTD/USD exchange rates for 20 years. Nat. sit. y. This figure displays the historical NTD/USD exchange rates from January 5th, 1993 to. io. er. December 28th, 2012. It illustrates that the exchange rate did not move violently for the past 20 years in this exchange market. Hence, the probability of making profits might not be as. n. al. Ch. i Un. v. high as the other exchange markets, which might change more frequently.. engchi. 11.
(17) 4. Methodology 4.1 Technical Trading Rules This section introduces the two types of technical trading indicators investigated in this paper: Commodity Channel Indexes (CCI) and Williams Overbought/ Oversold Index (WMS). These two types are examined using a variety of different parameter values. The amount of rules utilized to CCI is 1050, while the amount of rules applied to WMS is 450. In the following subsections, I describe each of these two technical indicators and demonstrate how to calculate their returns.. 立. 政 治 大. 4.1.1 Commodity Channel Index (CCI). ‧ 國. 學. The Commodity Channel Index (CCI) was created by Donald Lambert in. ‧. 1980 and its trading application is to recognize new trends and to warn about. Nat. sit. y. extreme conditions when trend reversal could be expected. CCI defines the. a. er. io. position of the current price in relation to the price moving average. Positive. n. i v and negative CCI l moving above price naverage CCI readings indicate price. Ch. engchi U. readings denote price movement below price average. The assumption behind the indicator is that the prices of commodities move in cycles of highs and lows at periodic intervals. The CCI calculation can be performed in the following four steps: Step 1. Calculate the last period's Typical Price (TP) TPt =. (H t Lt Ct ) 3. Ht is the highest price, Lt is the lowest price, and Ct means the close price within n days. Typical price (TP) means the average price of those three price. 12.
(18) Step 2. Calculate the Simple Moving Average of Typical Price (SMATP).. (TPt TPt 1 ... TPt n1 ) n. SMATP =. Calculate the sum of TP and divide the summation by the number of periods. Step 3. Calculate the Mean Deviation (MD). MD t =. TPt SMATPt TPt 1 SMATPt 1 ... TPt n1 SMATPt n1 n. First, calculate the absolute value of the difference between the last period's SMATP and the typical price for each of the past n periods. Then, add these. 政 治 大. absolute values together and divide by n to calculate the mean deviation.. 立. CCI t =. ‧. ( TPt SMATPt ) ( 0.015 MDt ). 學. ‧ 國. Step 4. The last step is to calculate the CCI by the following formula:. Nat. sit. y. First, calculate the difference between TP and SMATP. Then, divide by mean. er. io. deviation and multiply by 0.015.. al. n. iv n C h eonnthe The volatility of CCI depends h i Uselected. A shorter CCI (CCI g cperiod with a shorter bar period setting) will be more volatile and will generate more trading signals. Conversely, the more periods that are used to calculate the CCI - the fewer signals would be generated. Thus, the primary parameter of CCI is the period of time n. According to Lambert's technical analysis theory, CCI values below -100 indicate an oversold index and can be used as a "Buy" signal. Conversely, CCI values above +100 denote an overbought index and can be used as a "Sell" 13.
(19) signal. CCI is defined as follows: a buy (sell) signal is extracted when the index exceeds (penetrates downward) a from the lower (higher) index. Once a buy (sell) signal has been observed, traders buy (sell) and hold (go short) until the next sell (buy) signal has been extracted. Hence, there are two other different parameters: a is the trading signals, while b is the lag days of trading after trading signals appear. Therefore, the number of trading rules created by CCI is 1050. Table 1 is the summary of total parameters of CCI adopted in this paper. Table 1 Summary of total parameters of CCI. 政 治 大. Three parameters of CCI: “n” is the period of time that the technical trading rules utilizes to calculate CCI, while “a” represents the upper bar and bottom bar for deciding the appearance. 立. Trading Rules. Parameters. CCI. Period of Time (n). Value. Number of Kinds 10. ±50, ±55, ±60, ±65, ±70, ±75, ±80, …, ±120, ±125, ±130, ±135, ±140, ±145,±150. 21. sit. y. 7, 14, 21, 28, 35, 42, 49, 56, 63, 70. n. 0, 1 , 2, 3, 4. Ch. er. io. al. ‧. Nat. Trading signals (a) Days of lag (b). 學. ‧ 國. of trading signals, “b” is the lag days of trading after the trading signals appear.. n engchi U. 14. iv. 5 1,050.
(20) 4.1.2 Williams Overbought/ Oversold Index (WMS) The Williams Overbought/Oversold (WMS) Index is very similar to the Stochastic and the William’s %R studies, except that the Stochastic has internal smoothing; whereas, the WMS is plotted on an upside-down scale, with 0 at the top and -100 at the bottom. The WMS relates the difference between today’s closing price and the period’s lowest price with the trade margin of the given period, demonstrating the relative position of the closing price within the given period.. 政 治 大. The WMS index calculation can be performed as follows:. 立. ‧ 國. H n Ct - 100 H n Ln . 學. WMS =. In this formula, Hn is the highest price within n days, and Ct represents the. ‧. close price within n days, while Ln is the lowest price within n days.. sit. y. Nat. er. io. The WMS index locates between 0 and -100; a value of 0 shows that the. n. closing price is the same a asl the period high. Conversely, i v a value of -100 shows. n U i e h n gperiod c low. This trading system script that the closing price is identical to the. Ch. uses WMS indicator to generate trading signals whenever the underlying symbol is overbought or oversold. The higher the index is, the more the volume of overbought the market has; while the lower the WMS index is, the more the volume of oversold the market has. The WMS is designed to show the difference between the period high and the present day’s closing price with the trading range of the specified period. Therefore, the index expresses the relative situation of the trend within the 15.
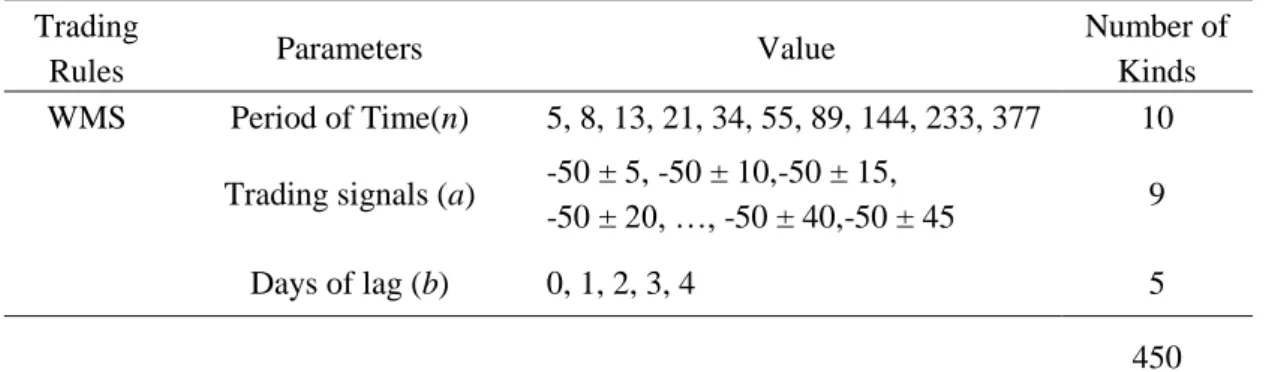
(21) observation period and helps define the trading strategies as follows. The trading rules of WMS index are as follows: 1. “Sell” when WMS index shows the symbol is overbought, which means the index declines under the upper bar. 2. “Buy” when WMS index shows the symbol is oversold, which means the index increases over the bottom bar. The volatility of WMS depends on the period selected. A shorter WMS will be more volatile and will generate more trading signals. Conversely, the more periods that are used to calculate the WMS index, the fewer signals will be. 政 治 大. generated. Thus, the primary parameter of WMS is the period of time n. The. 立. longer the period of time is, the less WMS index produces at a limited period of. ‧ 國. 學. time. Furthermore, the trading signals produced by the value of upper and. ‧. bottom bar, a, which effects the accuracy of trading decision making, while b. sit. y. Nat. means the lag days of trading after the trading signals appear. Thus, the amount. al. n. on WMS index.. er. io. of all trading rules on WMS is 450. Table 2 is the summary of total parameters. Ch. engchi. Table 2 Summary of total parameters on WMS. i Un. v. Three parameters of WMS: “n” is the period of time that the technical trading strategy utilizes to calculate WMS, while “a” represents the upper bar and bottom bar for deciding the appearance of trading signals and “b” is the lag days after the trading signals appear. Trading Rules WMS. Number of Kinds 10. Parameters. Value. Period of Time(n). 5, 8, 13, 21, 34, 55, 89, 144, 233, 377. Trading signals (a). -50 ± 5, -50 ± 10,-50 ± 15, -50 ± 20, …, -50 ± 40,-50 ± 45. 9. 0, 1, 2, 3, 4. 5. Days of lag (b). 450. 16.
(22) 5. Empirical Results This section displays the results of applying two technical trading indicators by back-testing for 20 years. To avoid the inclusion of too many irrelevant trading rule leads to a decrease the performance of the results, this paper selects only 15 kinds of trading rules from each indictors with better returns to be analyzed.. 5.1 Returns on Commodity Channel Index (CCI) This section demonstrates the results of applying CCI technical trading. 政 治 大. indicators. In order to choose the best trading rules, it is essential to select. 立. better parameters by the returns they conduct. To acquire the best trading rules,. ‧ 國. 學. it is necessary to decompose all trading rules into 3 different conditions. Figure. ‧. 2 displays all the average annual returns of different trading rules of CCI when. sit. y. Nat. the parameters of a and b are fixed. The average annual returns on CCI are. io. n. are lower when the periodaof time n increases. Figure 2. er. higher when n is 7, 14, 21, 28 and 35. This figure also denotes that the returns. iv l C n hengchi U. Scatter diagram of average annual returns on CCI when a and b are fixed. 17.
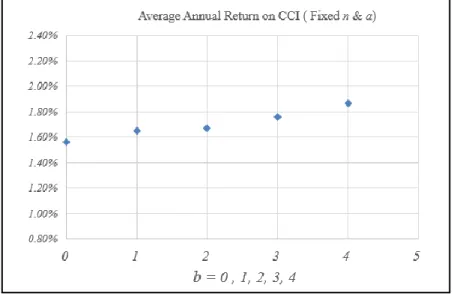
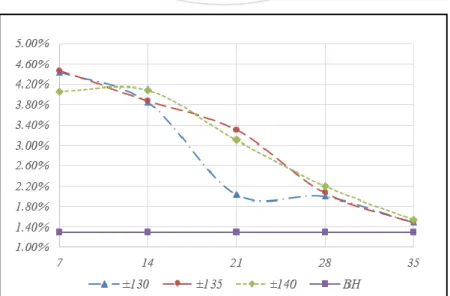
(23) Figure 3 illustrates all the average annual returns of different trading rules of CCI when the parameters of n and b are fixed. The average annual returns on CCI are higher when a is ±130, ±135 and ±140. Figure 3 Scatter diagram of average annual returns on CCI when n and b are fixed. 立. 政 治 大. ‧ 國. 學 ‧. Figure 4 shows all the average annual returns of different trading rules of. sit. y. Nat. CCI when the parameters of n and a are fixed. The average annual returns on. n. signals appear can obtain athe l best performance. Figure 4. Ch. engchi. er. io. CCI are higher when b is 4, which means trading 4 days after the trading. i Un. v. Scatter diagram of average annual returns on CCI when n and a are fixed. 18.
(24) From the above three figures, this paper chooses 15 technical trading rules as the main trading rules to analyze for the purpose of increasing the performance of CCI. Table 3 summarizes the value of three parameters of CCI with best performance within all the trading rules. Table 3 List of all the values of three parameters of CCI with best performance n 7 14 21 28 35. a ±135 ±140 ±145. b 4. 治 政 To calculate the excess profits, I simulate buy-and-hold strategy within 20 大 立. years and acquire the average annual return of buy-and-hold strategy (BH) by. ‧ 國. 學. ln ( Pt 1 P ) is 1.2936%. Figure 5 shows the returns of all the 15 kinds of. ‧. t. technical trading rules of CCI and the returns of buy-and-hold strategy. This. sit. y. Nat. figure denotes that all the returns from 15 kinds of trading rules are higher than. er. io. the returns from buy-and-hold a strategy. It also illustrates that the smaller the n. n. iv l C n h e nitgcanc h trading rule selects, the higher returns obtain. i U. Figure 5 Comparison of Returns on CCI and BH strategy. 19.
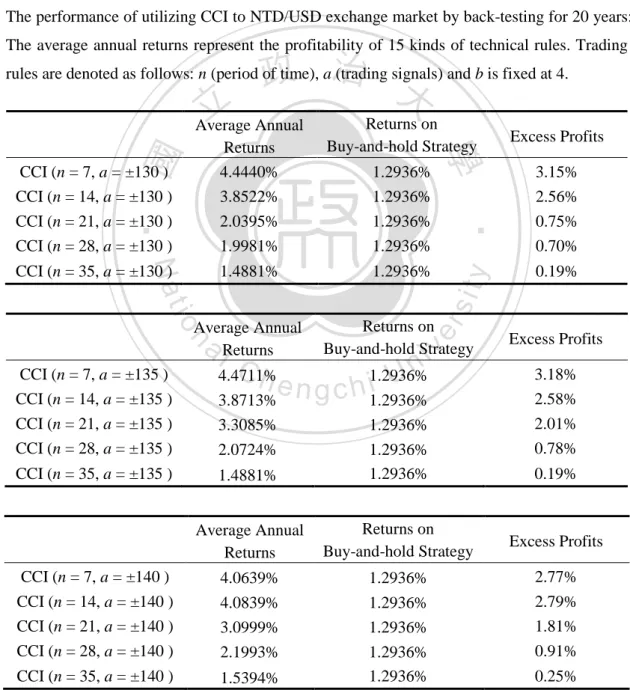
(25) Table 4 displays that all the trading rules obtain excess profits and the performance of all trading rules of CCI are much better than the performance of buy-and-hold strategy. This table demonstrates that the lower the time of period CCI is utilized, the higher the excess profits the trading rule obtains. The overall average annual excess profits of CCI is 2.94%, and all the average annual excess profits are around 0.19% to 3.18%. Table 4 Summary of the performance of all the trading rules of CCI The performance of utilizing CCI to NTD/USD exchange market by back-testing for 20 years: The average annual returns represent the profitability of 15 kinds of technical rules. Trading. 政 治 大. rules are denoted as follows: n (period of time), a (trading signals) and b is fixed at 4.. 3.15% 2.56% 0.75% 0.70%. 1.4881%. 1.2936%. y. 0.19%. Average Annual Returns. Returns on Buy-and-hold Strategy. io. sit. CCI (n = 35, a = ±130 ). n. al. CCI (n = 7, a = ±135 ) CCI (n = 14, a = ±135 ) CCI (n = 21, a = ±135 ) CCI (n = 28, a = ±135 ). Ch. er. ‧ 國. 1.2936% 1.2936% 1.2936% 1.2936%. Nat. Excess Profits. 學. CCI (n = 7, a = ±130 ) CCI (n = 14, a = ±130 ) CCI (n = 21, a = ±130 ) CCI (n = 28, a = ±130 ). Returns on Buy-and-hold Strategy. ‧. 立. Average Annual Returns 4.4440% 3.8522% 2.0395% 1.9981%. v ni. 1.2936% U i e h n c g 3.8713% 1.2936% 4.4711%. Excess Profits 3.18% 2.58% 2.01% 0.78%. 3.3085%. 1.2936%. 2.0724% 1.4881%. 1.2936% 1.2936%. Average Annual Returns. Returns on Buy-and-hold Strategy. Excess Profits. CCI (n = 7, a = ±140 ). 4.0639%. 1.2936%. 2.77%. CCI (n = 14, a = ±140 ) CCI (n = 21, a = ±140 ) CCI (n = 28, a = ±140 ). 4.0839% 3.0999%. 1.2936% 1.2936%. 2.1993%. CCI (n = 35, a = ±140 ). 1.5394%. 1.2936% 1.2936%. 2.79% 1.81% 0.91%. CCI (n = 35, a = ±135 ). 20. 0.19%. 0.25%.
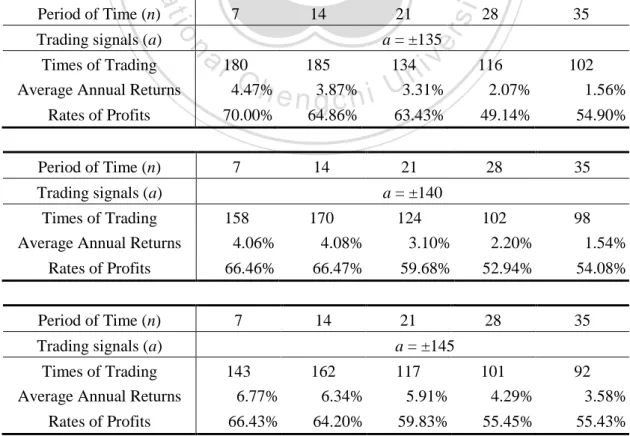
(26) Table 5 displays the statistical summary of applying CCI to NTD/USD exchange market. The results illustrate two principal viewpoints: 1. The average annual returns are higher when the period of time n on CCI is shorter and the range of trading signal a is narrower. It also shows that the more times the trading signals are produced, the higher average annual returns are. Hence, the average annual returns are higher than others when the n is 7 and a is ±135. 2. The rates of profits in all trading rules decline with the increase of the periods of time n and the decrease of times of trading, which means the longer. 政 治 大. the period of time CCI is utilized, the lower rates of profits can be obtained.. 立. This figures also display that the influence of a to the rates of profits is rather. ‧ 國. 學. small. Therefore, the rates of profits are the highest when n = 7 and a is fixed.. ‧. Table 5 Statistical summary of the performance of all trading rules of CCI Rates of profits represent the corrected rates of predictions within all the trading rules of CCI.. Nat. Times of Trading Average Annual Returns Rates of Profits Period of Time (n). a l180 Ch 4.47% 70.00%. sit. 14. 21. 28. 35. er. 7. a = ±135. n. Trading signals (a). io. Period of Time (n). y. Trading rules are denoted as follows: n (period of time), a (trading signals) and b is fixed at 4.. 134 3.31%. i Un. 116 2.07%. 102 1.56%. 64.86%. 63.43%. 49.14%. 54.90%. engchi. 7. v. 185 3.87%. 14. Trading signals (a). 21. 28. 35. a = ±140. Times of Trading Average Annual Returns. 158 4.06%. 170 4.08%. 124 3.10%. 102 2.20%. 98 1.54%. Rates of Profits. 66.46%. 66.47%. 59.68%. 52.94%. 54.08%. 14. 21. 28. 35. Period of Time (n). 7. Trading signals (a). a = ±145. Times of Trading Average Annual Returns. 143 6.77%. 162 6.34%. 117 5.91%. 101 4.29%. 92 3.58%. Rates of Profits. 66.43%. 64.20%. 59.83%. 55.45%. 55.43%. 21.
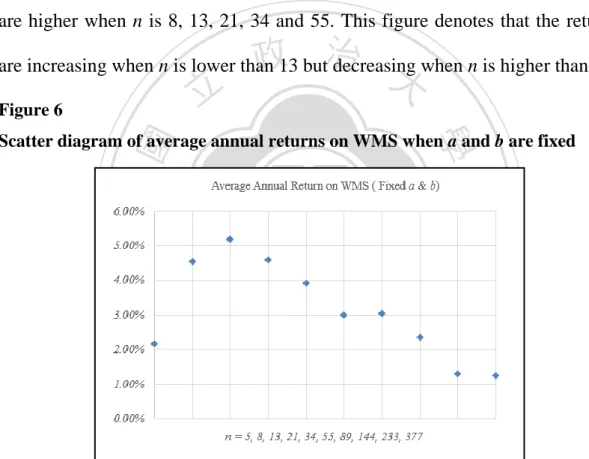
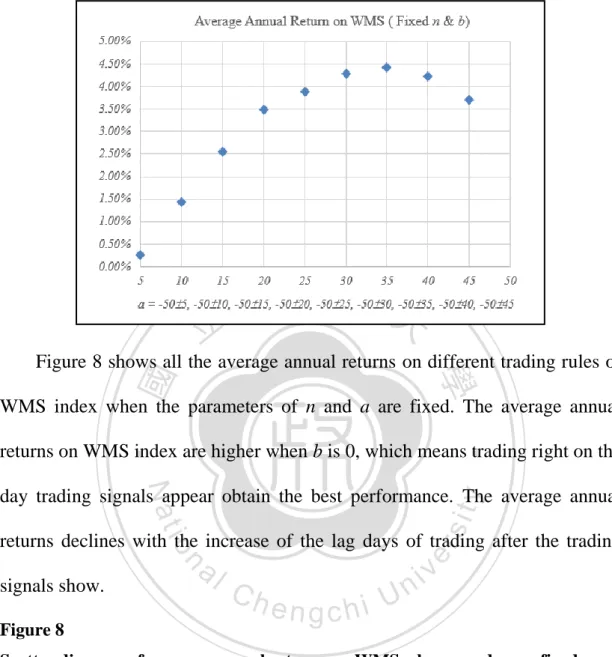
(27) 5.2 Returns on William Index (WMS) This section demonstrates the results of applying WMS technical trading indicators. In order to choose the best trading rules, it is essential to select better parameters by the returns they conduct. To acquire the best trading rules, it is necessary to decompose all trading rules into 3 different conditions. Figure 6 displays all the average annual returns of different trading rules of WMS when the parameters of a and b are fixed. The average annual returns on WMS are higher when n is 8, 13, 21, 34 and 55. This figure denotes that the returns. 政 治 大. are increasing when n is lower than 13 but decreasing when n is higher than 13.. 立. Figure 6. ‧ 國. 學. Scatter diagram of average annual returns on WMS when a and b are fixed. ‧. n. er. io. sit. y. Nat. al. Ch. engchi. i Un. v. Figure 7 illustrates all the average annual returns on different trading rules of WMS when the parameters of n and b are fixed. The average annual returns on WMS are higher when a is -50±30, -50±35 and -50±40. This figures also demonstrates that the performance of all trading rules of WMS index become well with the increase of the range of trading signal a when a is narrower than -50±35 but become worse when a is more than -50±35. 22.
(28) Figure 7 Scatter diagram of average annual returns on WMS when n and b are fixed. 立. 政 治 大. ‧ 國. 學. Figure 8 shows all the average annual returns on different trading rules of WMS index when the parameters of n and a are fixed. The average annual. ‧. returns on WMS index are higher when b is 0, which means trading right on the. Nat. sit. y. day trading signals appear obtain the best performance. The average annual. n. al. er. io. returns declines with the increase of the lag days of trading after the trading signals show. Figure 8. Ch. engchi. i Un. v. Scatter diagram of average annual returns on WMS when n and a are fixed. 23.
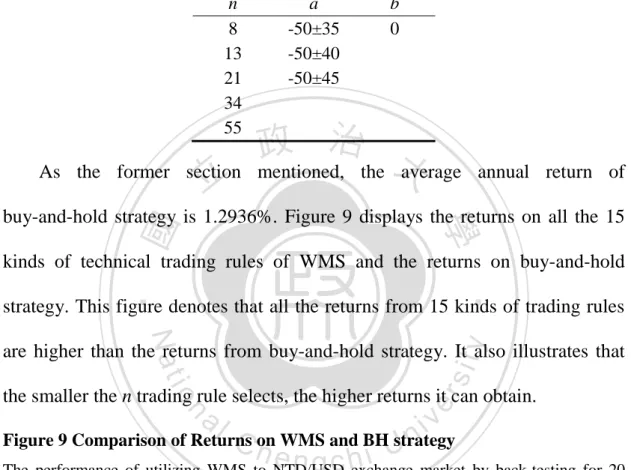
(29) As the former section mentioned, this paper chooses 15 technical trading rules as the main trading rules to analyze for the purpose of increasing the performance of WMS index. Table 6 summarizes the value of three parameters of WMS with best performance within all the trading rules. Table 6 List of all the values of three parameters on WMS with best performance n 8 13 21 34 55. 立. As the former section. a -50±35 -50±40 -50±45. b 0. 政 治 大 mentioned, the average. annual return of. ‧ 國. 學. buy-and-hold strategy is 1.2936%. Figure 9 displays the returns on all the 15 kinds of technical trading rules of WMS and the returns on buy-and-hold. ‧. strategy. This figure denotes that all the returns from 15 kinds of trading rules. y. Nat. io. sit. are higher than the returns from buy-and-hold strategy. It also illustrates that. n. al. er. the smaller the n trading rule selects, the higher returns it can obtain.. Ch. i Un. v. Figure 9 Comparison of Returns on WMS and BH strategy. engchi. The performance of utilizing WMS to NTD/USD exchange market by back-testing for 20 years: I examine the profitability of 15 kinds of WMS technical rules with better performance.. 24.
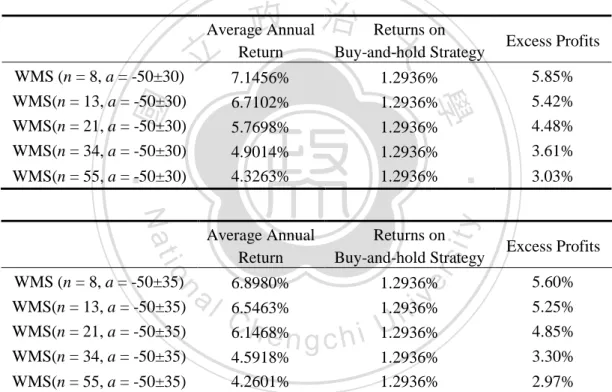
(30) Table 7 illustrates that all the trading rules obtain excess profits and the performance of all trading rules of WMS are much better than the performance on buy-and-hold strategy. The average annual excess profits of WMS is 5.61%, and all average annual excess profits are around 3.5% to 7.15%. The excess profits are higher when either n is lower or a is lower. Table 7 Summary of the performance of all the trading rules on WMS index The performance of utilizing WMS to NTD/USD exchange market by back-testing for 20 years: The average annual returns represent the profitability of 15 kinds of technical rules. Trading rules are denoted as follows: n (period of time), a (trading signals) and b is fixed at 0.. 政 治 Returns 大 on Buy-and-hold Strategy. Average Annual Return. 立. 1.2936% 1.2936% 1.2936% 1.2936% 1.2936%. Average Annual Return. Returns on Buy-and-hold Strategy. io. 5.85% 5.42% 4.48% 3.61% 3.03%. y. sit. Nat. Excess Profits. 6.8980% 6.5463% 6.1468%. 1.2936% 1.2936% 1.2936%. iv. 5.60% 5.25% 4.85%. 1.2936% 1.2936%. 3.30%. WMS(n = 55, a = -50±35). 4.5918% 4.2601%. WMS (n = 8, a = -50±40) WMS(n = 13, a = -50±40). Average Annual Return 6.7750% 6.3417%. Returns on Buy-and-hold Strategy 1.2936% 1.2936%. WMS(n = 21, a = -50±40) WMS(n = 34, a = -50±40). 5.9067% 4.2899%. 1.2936% 1.2936%. 4.61% 3.00%. WMS(n = 55, a = -50±40). 3.5814%. 1.2936%. 2.29%. al. n. WMS (n = 8, a = -50±35) WMS(n = 13, a = -50±35) WMS(n = 21, a = -50±35). er. WMS(n = 55, a = -50±30). ‧. ‧ 國. 7.1456% 6.7102% 5.7698% 4.9014% 4.3263%. 學. WMS (n = 8, a = -50±30) WMS(n = 13, a = -50±30) WMS(n = 21, a = -50±30) WMS(n = 34, a = -50±30). Excess Profits. WMS(n = 34, a = -50±35). Ch. n engchi U. 2.97%. Excess Profits 5.48% 5.05%. Table 8 displays the statistical summary of applying WMS to NTD/USD exchange market. The results illustrate two essential viewpoints: 1.The average 25.
(31) annual returns are higher when the period of time n on WMS index is shorter and the range of trading signal a is narrower. It also shows that the more times the trading signals are produced, the higher average annual returns are. Hence, the average annual returns are higher than others when the n is 8 and a is -50 ± 30. 2.The rates of profits in all trading rules increase with longer periods of time n and the decrease of times of trading, which means the longer the period of time WMS index is utilized, the higher rates of profits can be obtained. These figures also display that the larger range of the trading signal a is, the. 政 治 大. lower the rates of profits are. Consequently, the rates of profits are the highest. 立. when n = 55 and a is -50 ± 30.. ‧ 國. 學. Table 8 Statistical summary of the performance of all trading rules of WMS The statistical summary of the performance of all trading rules of WMS index by back-testing. ‧. for 20 years: Rates of profits represent the corrected rate of predictions within all the trading.. io. Trading signals (a). Average Annual Returns Rates of Profits. Period of Time (n). a l135 Ch 7.15%. n. Times of Trading. 8. 85.19% 8. 13. 34. 55. a = -50 ± 30. v ni. 94 6.71% 78.72%. 64 5.77% 79.69%. 42 4.90% 73.81%. 27 4.33% 96.30%. 13. 21. 34. 55. engchi U. Trading signals (a) Times of Trading. 21. er. Period of Time (n). sit. y. Nat. Trading rules are denoted as follows: n (period of time), a (trading signals) and b is fixed at 0.. a = -50 ± 35. Rates of Profits. 108 6.90% 90.74%. 74 6.55% 81.08%. 55 6.15% 83.64%. 39 4.59% 76.92%. 24 4.26% 95.83%. Period of Time (n). 8. 13. 21. 34. 55. Average Annual Returns. Trading signals (a) Times of Trading Average Annual Returns Rates of Profits. a = -50 ± 40. 81 6.77% 62.11%. 66 6.34% 56.96% 26. 44 5.91% 56.16%. 34 4.29% 58.49%. 22 3.58% 59.46%.
(32) 6. Conclusion and Future Research In this section, I conclude the empirical results into two viewpoints and summarize seven perspectives for further research.. 6.1 Conclusion Past literature mostly focuses on examining the effectiveness of technical strategies on moving averages, filter rules and trading range break. From some real investors’ information, this thesis chose different technical indicators to conduct different technical trading rules to check the efficiency of technical. 政 治 大. analysis. Overall, the empirical results that the profitability of applying CCI. 立. and WMS index to NTD/USD foreign exchange market can be generalized into. ‧ 國. 學. two points:. ‧. 1. WMS’s performances are chiefly superior to the CCI’s performances.. sit. y. Nat. Figure 10 demonstrates the average annual returns of all the trading rules between CCI and WMS index. It is obvious that all the returns on WMS index. er. io. n. are higher than those on aCCI. It represents that the trading i v rules of WMS are. l C n U h i e h n g cfigures also denotes that both of their more profitable than those of CCI. These returns decline with the period of times these two indexes is utilized. Figure 10 Comparison of average annual returns between CCI and WMS index. 27.
(33) Figure 11 illustrates the rates of profits of all the trading rules between CCI and WMS index. The rates of profits represent the probabilities of the corrected predictions. Higher rates mean the index can more likely predict the future trend of exchange rates. This figure displays that the rates of profits of WMS index are higher than those of CCI. It represents that the trading rules of WMS are more accurate than those of CCI. Figure 11 Comparison of rates of profits between CCI and WMS index. 立. 政 治 大. ‧. ‧ 國. 學. Nat. sit. y. 2. Both of these two technical indicators can obtain excess profits.. er. io. Compared with the average annual returns on buy-and-hold strategy, both. n. a. v. the average annual return lareChigher than 1.2936%. n iConsequently, these two. hengchi U. trading rules are profitable to be applied into NTD/USD exchange market for obtaining excess profits. Figure 12 Comparison of average annual returns with BH strategy. 28.
(34) 6.2 Future Research Since the research has only been worked for around a year, the thesis is not able to cover all the perspectives completely and many materials or questions can be prospected further. There are some viewpoints that can be addressed on future research: 1. Utilizing White’s Reality Check (2000, RC) and Hansen’s Superior. Predictive Ability test (2005, SPA) to exam the credibility of these two technical indicators. 政 治 大. This research did not use any test to exam the credibility. Nevertheless, it is. 立. essential and necessary to increase reliability by applying some acknowledged. ‧ 國. 學. tests to exam. White’s RC and Hansen’s SPA test evaluate trading. ‧. performances as well as to account for potential data-snooping biases. White. sit. y. Nat. (2000) presents the testing procedure for whether a given model has predictive. er. io. superiority over a benchmark model after accounting for data-snooping biases.. n. RC can be applied to testa the l profitability of the besti vtrading rule. It tests the. n U i e h n g by c the best trading rule do not exceed null hypothesis that the profits generated. Ch. that of a benchmark strategy and give an estimate of the true and nominal p-values for the null hypothesis by means of bootstrapping simulations. Besides, SPA corrects two drawbacks of White’s Reality Check test and makes the test method more credible. Consequently, using these two methods to exam the technical indicators can be an issue for further research. 2. Consideration of transaction costs This paper did not take transaction cost into consideration. However, much. 29.
(35) research indicates that transaction costs are key factors on executing trading strategies, which may completely change the trading results. The amount of transaction costs depends on trading frequencies and how much percent banks charge for trading. Hence, it will be a necessary topic to test the profitability of the trading rules after accounting for the transaction costs. 3. Mechanism of stop-loss and stop-gain Much research demonstrates that trading strategies can perform much better by adding the mechanism of stop-loss and stop-gain. However, this paper did. 政 治 大. not set up the mechanism of stop-loss and stop-gain. In order to increase the. 立. returns from these two technical indicators, it is an available method to research. ‧ 國. 學. more deeply and to examine the trading strategy with the stop-loss and. ‧. stop-gain mechanism.. sit. y. Nat. 4. Combination of both technical indictors Some literature also illustrates that applying different technical strategies in. er. io. n. a more profits. This paper different times can obtain i v utilizes only two trend-following trading. l C n U h i e h indictors, son itg might c perform. better by adding the. range trading systems in consideration. 5. Consideration of more parameters Past literature seldom records the methods to choose parameters and examines the effects on different parameters. Nevertheless, some factors that might play an important role in the formula of technical indexes are not considered. Consequently, further research can focus on this issue.. 30.
(36) 6. Test out of sample data All the tests in this paper are just focused on the sample data within 20 years. Nevertheless, the results might only be effective in this period of time. Hence, to be more credible, future research can exam some data out of the sample and test the predictability of these two technical indicators. 7. Different exchange markets Although these two indicators perform pretty well on the market of NTD/USD, it does not mean that they are not good indictors on other markets,. 政 治 大. such as GBP/USD, USD/CHF, EUR/USD, USD/JPY and so on. Especially, the. 立. exchange market in Taiwan were strict controlled by the government.. ‧ 國. 學. Consequently, taking these indicators to other exchange markets might conduct. ‧. with different results.. sit. y. Nat. 8. Consideration of interest rates One of the most common reasons for investing in exchange markets is. er. io. n. a in different countries. However, obtaining the interest rates i v this paper did not l C n U h i e h n could consider the interests each investments g c obtain. For the purpose of making the results more realistic, it is necessary to calculate the interests all the investment could receive. As a result, future research can take the interests from all trading into consideration and make the return more authentic.. 31.
(37) Reference Allen, H. and Taylor, M. P. 1992. The use of technical analysis in the foreign exchange market. Journal of International Money and Finance 113, 301–1314. Alexander, S. S. 1961. Price movement in speculative markets: trends or random walks. Industrial Management Review 2, 7-26. Brock, W., Lakonishok, J., and LeBaron, B. 1992. Simple technical trading rules and the stochastic properties of stock returns. Journal of Finance 37, 1731-1764. Chien-Wen, C. 1994. The tests of foreign exchange performance by employing the technical analysis indexes. Unpublished master thesis, National Taiwan University, Taiwan.. 治 政 Chung, Lin and Kuo. 2011. Are technical trading 大 rules always profitable in the 立 Taiwan Economics Prediction and Research, foreign exchange market? ‧ 國. 學. 95–1126.. Duan-Yu, W. and Ming-Shu H. 1999. The Profitability of Technical Analysis in the. ‧. NT/$ Foreign Exchange Market. Unpublished master thesis, National Chi Nan. sit. y. Nat. University, Taiwan.. io. er. Fama, E.F. 1970. Efficient capital market: a review of theory and empirical work, Journal of Finance 25, 383-471.. n. al. Ch. i Un. v. Hamilton, W. P. 1998. The stock market barometer, New York: John Wiley & Sons,. engchi. Inc. (Originally published: New York: Harper & Brothers, 1922.) Hsu, P. H. and Kuan, C. M. 2005. Reexamining the profitability of technical analysis with data snooping checks, Journal of Financial Econometrics 3, 606–628. Hopper, G.P. 1997. What determines the exchange rate: economic factors or market sentiment? Economic Review, Federal Reserve Bank of Philadelphia. Kuen-Liang, L. 2007. Technical analysis in foreign exchange market. Unpublished master thesis, National Taiwan University, Taiwan. Larry, W. 1979. How I Made $1,000,000 Last Year by Trading Commodities. New York: Windsor Books.. 32.
(38) LeBaron, B. 1996. Technical trading rule profitability and foreign exchange intervention.. Journal of International Economics 49, 125-143.. Levy, R. A. 1967. Relative strength as a criterion for investment selection. Journal of Finance 22, 595-610. Levich, R., and Thomas, L. 1993. The significance of technical trading-rule profits in the foreign exchange market: a bootstrap approach. Journal of International Money and Finance 12, no.6, 563-586. Lo, A. W. and MacKinlay, A. C. 1990. Data-snooping biases in tests of financial asset pricing models. Review of Financial Studies 3, 431–1467. Meese, R.A., and Rogoff K. 1983. Empirical exchange rate models of the seventies:. 政 治 大 Pruitt, S. W. and White, R. E. 1988. The CRISMA trading system: who says technical 立 Do they fit out of sample? Journal of International Economics 14, 3-24.. analysis can’t beat the market? Journal of Portfolio Management 14, 55-58.. ‧ 國. 學. Sweeney, R. J. 1986. Beating the foreign exchange market. Journal of Finance 41,. ‧. No.1, 163-182.. Sullivan, R., Timmermann, A., White, H. 1999. Data-snooping, technical trading rule. y. Nat. sit. performance, and the bootstrap. Journal of Finance 54, 1647–1691.. n. al. er. io. Taylor, M. and Allen, H. 1992. The use of technical analysis in the foreign exchange. i Un. v. market. Journal of International Money and Finance 11, 304-314.. Ch. engchi. Taylor, M.P. 1995. The economics of exchange rates. Journal of Economic Literature 33, 13-47.. 33.
(39)
數據
+7
相關文件
For pedagogical purposes, let us start consideration from a simple one-dimensional (1D) system, where electrons are confined to a chain parallel to the x axis. As it is well known
The observed small neutrino masses strongly suggest the presence of super heavy Majorana neutrinos N. Out-of-thermal equilibrium processes may be easily realized around the
incapable to extract any quantities from QCD, nor to tackle the most interesting physics, namely, the spontaneously chiral symmetry breaking and the color confinement..
(1) Determine a hypersurface on which matching condition is given.. (2) Determine a
• Formation of massive primordial stars as origin of objects in the early universe. • Supernova explosions might be visible to the most
(Another example of close harmony is the four-bar unaccompanied vocal introduction to “Paperback Writer”, a somewhat later Beatles song.) Overall, Lennon’s and McCartney’s
DVDs, Podcasts, language teaching software, video games, and even foreign- language music and music videos can provide positive and fun associations with the language for
Microphone and 600 ohm line conduits shall be mechanically and electrically connected to receptacle boxes and electrically grounded to the audio system ground point.. Lines in
