The Development Trends of Textile Integrated Photovoltaic
6
0
0
全文
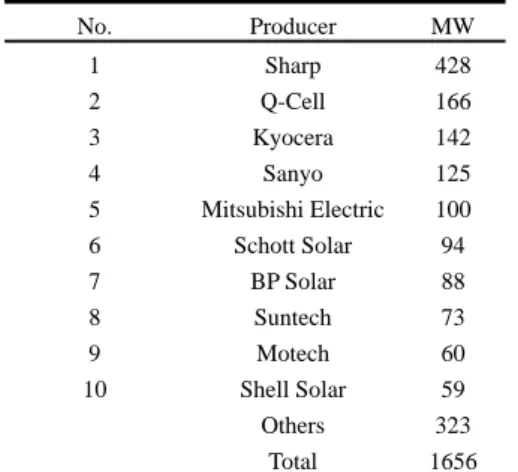
(2) Table 1. Production Outputs of Solar Cells in 2005. MW. No.. Producer. MW. 1. Sharp. 428. 2. Q-Cell. 166. 3. Kyocera. 142. 4. Sanyo. 125. 5. Mitsubishi Electric. 100. 6. Schott Solar. 94. 7. BP Solar. 88. 8. Suntech. 73. 9. Motech. 60. 10. Shell Solar. 59. Others. 323. Total. 1656. 4000 3300. 3500 3000. 2600. 2500. 2100 1706. 2000. 1320. 1500. 1073 858. 1000 500. 675. 122 150 22 27 29 33 39 48 56 59 61 72 78 89. 200. 300. 400. 516. 0. Date Sources: Solarbuzz, March 2006; The Development Trends of Textile Integrated Photovoltaics, ITIS Project, 2006. Data Sources: ABS Renewable Energy Generating Capacity, IEA PPAP/National Statistics; Trends in Solar Energy Textile Developmen, ITIS Project, 2006.. Fig. 1. Statistics and Forecasts: Annual Solar Cell Production. othe r 19.4%. Sha rp 25.8%. According to the most recent figures published by Solarbuzz in March 2006 (see Table 1), the 2005 global production capacity for solar cells was 1,656 MW (compared to 1,146 in 2004). PV News, in its figures released in early 2006, reported 1,727 MW for 2005. These numbers tell us that production capacities will continue to grow in the near future. Some even made bold forecasts of 10 GW by the year 2010. Based on actual figures of 1,656 MW in 2005 and a CAGR of 25%, the annual production capacity for solar cells in 2010 will be around 5,050 MW. The long-term forecasts show that the figures would rise to as high as 54 GW(in 2020) and 380 GW (in 2030) respectively. Because of the dramatic changes in the market, long-term forecast figures for the growth of solar cells can at best serve as references. Their accuracy has yet to undergo the test of time, or be revised from time to time to approximate objective figures. If we look at production from country to country, Japan’s four major producers—Sharp, Kyocera, Sanyo and Mitsubishi—together shared 47.9% of the world’s total output in 2005 (See Table 2), making Japan the virtual world leader in solar cell production. In comparison, however, Shell Solar’s production in 2005 was lower than its figure for 2004, 72 MW. Reasons may be the company’s inability to access sufficient silicon raw materials. At the same period, China’s Suntech rose to become the world’s eighth largest solar cell supplier. Finding enough supply of silicon materials and making it to the World’s Top Five for market security seem to be the goals of manufacturers before the advent of cutthroat competition in the industry. The key point of 40% CAGR can be attained after 2005 (Shortage of silicon materials had lead to a growth rate of 20% for 2006) will not depend upon manufacturers’ expansion of plant facilities, but instead upon access to silicon materials and reduction of prices that could attract more installation. As the silicon material supply problem will not be permanent, the industry can remain careful yet optimistic on its future. In summary, the growth in solar cell output, growing ten times in a matter of ten years, is staggering. This trend reflects a more mature technology and is a result of rises in petroleum prices, while also suggesting enhanced consciousness on environmental protection and ecological balance.. She ll Sola r 3.6% Mote c h Industrie s 3.6% Sunte c h Powe r 4.4%. Q-Ce ll 10.0%. BP Sola r 5.3% Sc hott sola r 5.7% Mitsubishi Ele c tric 6.0%. Kyoc e ra Sa nyo. 8.6%. 7.5%. Data Sources: Solarbuzz, March 2006 Issue; The Development Trends of Textile Integrated Photovoltaic,” ITIS Project, 2006.. Fig. 2. Solar Cell Makers’ Share in the 2005 Global Market. 2.2 Market Analysis of Membrane Textiles A flexible solar cell can be easy to laminate on membrane textile (Fig. 3) and it is a big market in this world. Statistics released by the Freedonia Group, Inc. show that in 2004, global demand for membrane textiles was about 2 billion square yards. Of this, the US alone took up 29% (or 580 million square yards), while the other large users are Western Europe and the Asia-Pacific.. Fig. 3. Solar Cell laminated on membrane textile. The Western European demand for membrane textiles in 2004 reached 500 million square yards (a fourth of the total global demand), with the fastest application growths recorded in automobile uses and protective clothing. Both share characteristics of small volume and high unit price, which are suitable for production in high-wage countries as they can avoid competition from low-wage countries with insufficient technological capabilities. The rapid growth in the protective clothing market has a reason similar to the same trend in the.
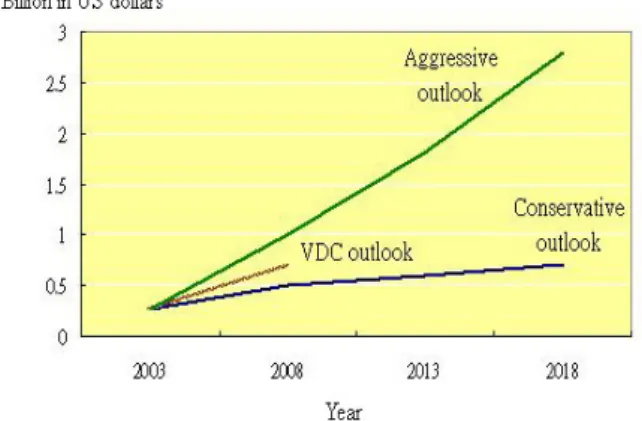
(3) US—for protection against terrorist chemical and biochemical attacks. In the Asia-Pacific, the demand for membrane textiles is approximately 450 million square yards. Robust economic performance in the PRC, India, Malaysia, Singapore and South Korea, and the encouraging economic growths enjoyed by Taiwan, Indonesia, the Philippines and Thailand, bodes well for economic growth in the Asia-Pacific until 2009. This will induce the rise in demand for membrane textiles. In 2004, demand for membrane textiles for automobile use was the highest in the US market (about 30%, See Figure 4), with applications such as interiors (seat covers, back rests, floor mats, carpeting and curtains), interior decoration, airbags and cargo truck tents. For protective clothing, applications include those for military (protection against toxic gas and chemical disaster) and occupational uses (protection against gaseous chemicals, solvents and electromagnetic waves). The threats of the SARS epidemic and bird flu in recent years have also contributed to the growth in the membrane textiles market. It is predicted that by 2009, the protective clothing sector will grow the fastest. Comparing figures for 2004 and 2009, growth rate will be in the vicinity of 9.7% (See Table 2).. Based on US Customs statistics, the US imported US$670 million of membrane textiles from other countries, mostly from Asia-Pacific countries, with a combined figure of 35.9% (See Figure 5). This is followed by imports from neighboring Canada, which supplies the largest quantity to the US from a single country. This suggests that the membrane textiles industry still offers enough profits for the high-wage Canadian makers to be able to survive competition. This tells us that Taiwan, with a relatively lower wage, excellent processing technology, sufficient supply of raw materials and proximity to the PRC market, has great potentials in developing this industry.. Data Sources: The Freedonia Group, Inc.; The Research of Membrane Textile,” ITIS Project, 2005.. Fig. 5. Sources of US Imports of Membrane Textiles in 2004. Among the various products and applications of membrane textiles, many can be coupled with solar cell technology, such as those of industrial curtains, canopies, banners, clothing, bags, luggage, canopies for cargo trucks and boats, protective clothing and convertible car hood. If further integrated with LED, membrane textiles will not only be energy saving and power generating, but will also include illumination, signaling and advertising features. The market potentials are really encouraging. Data Sources: The Freedonia Group, Inc.; The Research of Membrane Textiles, ITIS Project, 2005.. Fig. 4. 2004 US Industry Demands for Membrane Textiles Table 2. Predictions for Various US Market Applications of Membrane Textiles [unit: Million square yards] Market Automobile Interiors & decorations Sedan airbags Boats and other non-automobile uses Protective clothing Furniture Industrial uses Wallpaper Books Canopy/Tents Total Demand $/Square yard Total market. Annual Growth Rate 04/99 09/04. 1999. 2004. 2009. 2014. 121. 113. 116. 125. -1.4. 0.5. 50 38. 60 46. 73 55. 86 65. 3.7 3.9. 4.0 3.6. 41 74 70 38 31 64 527 3.91 2060. 73 70 68 36 28 86 580 3.71 2150. 116 68 87 40 26 104 685 3.50 2410. 144 67 105 44 24 125 785 3.40 2630. 12.2 -1.1 -0.6 -1.1 -2.0 6.1 1.9 -1.0 0.9. 9.7 -0.6 5.1 2.1 -1.5 3.9 3.4 -1.2 2.3. (in Million US Dollars) Data Sources: The Freedonia Group, Inc.; The Research of Membrane Textiles, ITIS Project, 2005.. 2.3 Market Analysis of Electronic Apparel Electronic apparel requires electric power, which is usually directly supplied through batteries. A small minority is equipped with gadgets that transform body heat into electrical power. However, since the price of solar panels started to fall, the opportunity of using solar cells as power source in electronic apparel has markedly increased. If fiber itself can be made into solar cells, the latter’s use in electronic apparel can be even more justified. In contemporary high-tech apparel exhibitions, we often see apparel equipped with electronic parts. Of this, Michael Janecke, Project Manager at Frankfurt Trade Exhibition Co., points out: “Intelligent textile products can stimulate the industry as these products are innovative and full of potentials.” Mr. Libeert, Chairman of the European Textile and Garment Association, underscored the importance of intelligent textiles to the European textile industry. He has realized this trend ever since he started organizing high-tech textile exhibitions in 1986. Although these comments refer to electronic apparel as defined in this study, they also reflect the achievements in innovating and developing the global textile industry. Figure 6 represents forecasts and analysis made by Venture Development Corporation on the future of electronic apparel..
(4) Projecting based on the 2003 market figure of US$303 million, an aggressive prediction of US$1.05 billion may be realized in 2008. This trend will show a market growth of US$3 billion. If we calculate with a conservative view, estimates for the market in 2018 will be US$550 million in consumption value.. Data Sources: Venture Development Corp.; Development Trends in Intelligent Textile Products, ITIS Project, 2004.. Fig. 6. Consumption Forecast for Intelligent Textile Products. According to a market analysis report[1] made by Venture Development Corp., the global demand for electronic apparel was US$70 million. Linear estimates by 2006 will reach US$556 million. Undoubtedly, trends show that electronic apparel will be integrated with precision electronics to arrive at products that better meet people’s daily living needs.. Market Size (in Million US$). 600. 556.3. 500 400. 362.3. 300. 238.9. 200 100. 158.3 105.3 70.4. 0 2001. 2002. 2003. 2004. 2005. 2006. Year. Date Sources: Venture Development Corp.; Development Trends in Intelligent Textile Products, ITIS Project, 2006.. Fig. 7. Global Market Size of Electronic Apparel. 2.4 Market Analysis of bags, cases and luggage Among items combining solar energy with textile products, the bags, cases and luggage category is the most worthy of attention, because these products have an abundance of planar surfaces, and offer easy installation of solar cells. Apparel products require astringent water resistance and solar cells must not sacrifice the products’ overall aesthetics. In contrast, the bags, cases and luggage category has less of such demands. Moreover, because of the lower unit price of bags, cases and luggage products, they are the easiest to promote among solar energy textile products. Before other applications can even become popular, solar energy. bags, cases and luggage products may be the first to generate substantial profits. It is well-known that Taiwan is a major producer of electronic products, but few are aware that Taiwan was once a world top maker of bags, cases and luggage. Taiwan’s bags, cases and luggage industry started in the 1970s. Although production was mostly OEM, the excellent processing standard and strict quality control employed have led to the market popularity of these products. Taiwan’s rise as an electronics producer, notably in laptops, in fact contributed to the survival and development opportunities enjoyed by Taiwan bags, cases and luggage producers, as each laptop computer is accompanied by a carrying case. After Taiwan’s accession to WTO in 2002, Taiwan’s bags, cases and luggage industry faced the problem of quota cancellation, which prompted many to transfer their production lines to mainland China. This explained the gradual drop in Taiwan’s output in this sector. Taiwan was once known as a world leader in luggage production, especially in those times when the island enjoyed the advantages of cheap manpower and excellent technological capabilities. Today, low-end bags, cases and luggage products have become associated with China, while Taiwan has started to focus on developing middle to top-end products. Taiwan’s hand-carried bag exports mainly consist of traveling cases and portfolios, often making up about 50% of exports. Because of design excellence and dependable quality, these products have made a name for Taiwan in the markets of Europe, the US and Japan. It is interesting to note that for bags, cases and luggage products, the US, Japan and Europe will always remain as the major world consumers. On the production side, Taiwan and China are important suppliers of these items. Because of textile quota and the appreciation of the NT dollar, Taiwan’s hand-carried bag industry started moving out in the 1990s. Figure 8 shows clearly that Taiwan’s bags, cases and luggage industry has almost completely moved out of the international market, and had been taken over by the Chinese who now dominate the market. But by looking at the Japanese market, we can see that products that are branded (i.e. with excellent quality) can survive competition from cheaper products made in China or Southeast Asia. We all know that Taiwan has to build up brand image but this is a difficult task, and results may not always be successful. Actually, a better way is to join supply chains of international brands or to adopt multifunctional or multi-styled designing. Here, the application of solar cells is one important pathway. An ordinary bag may be priced NT$200~300. After inclusion of solar cells, the price may be raised to at least NT$1000, which shows a tremendous added value. Figure 8 is a complete export record from 1982 to 2005. With the exception of 1989, the year when the Tienanmen Incident occurred and when there was a massive return of production orders to Taiwan’s bags, cases and luggage makers, export trends started to drop from peak figures in the 1980s all the way down to just NT$2.2 billion last year. With competition from Chinese makers who enjoy cost advantages, local bags, cases and luggage makers suffered export declines and Taiwan is no longer the international market leader. It had been replaced by China. With the exception of branded products, related industries around the world, including those in Southeast Asia such as Thailand, have been facing fierce competition from mainland Chinese bags, cases and luggage industry..
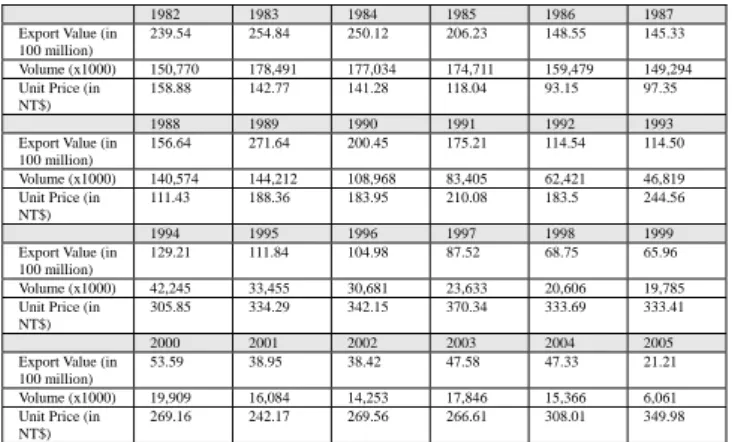
(5) 350 254. 370 334 342 334 333. 350 224. 250. 400. 290. 276 270. 214 189. 171 167 177. 200. 306. 126 121 133 116 108. 150. 91. 100. 72 68. 56. 39 38 49 48. 50. 22. 0. 200 159 143 141 118 111 150 93 97 100. 188 184. 270 267. 308. 242. 245. 250. 350 269. 300 NT Do llar. 100 million in NT$. 300. 210 184. 50 0. 1982 1983 1984 1985 1986 1987 1988 1989 1990 1991 1992 1993 1994 1995 1996 1997 1998 1999 2000 2001 2002 2003 2004 2005. 1982 1983 1984 1985 1986 1987 1988 1989 1990 1991 1992 1993 1994 1995 1996 1997 1998 1999 2000 2001 2002 2003 2004 2005. Year. Year. Date Sources: www.tier.org.tw; The Development Trends of Textile Integrated Photovoltaics, ITIS Project, 2006.. Date Sources: www.tier.org.tw; The Development Trends of Textile Integrated Photovoltaics, ITIS Project, 2006.. Fig. 8. Export Values of Luggage and Hand-carried Bags Industry. Fig. 11. Non-leather Luggage and Hand-carried Bags Unit Prices. Deduction from statistics in Fig. 8 for leather products, we can focus analysis on plastic and textile bags, cases and luggage products. Export values, quantities and unit prices of non-leather bags, cases and luggage products are illustrated in Figures 9, 10 and 11. The figures show that leather products made up a small portion of exports, and trends concurred well with that shown in Fig. 8. However, Fig. 11’s unit prices tell us that because production of low-priced bags, cases and luggage products has moved to China, products made in Taiwan appeared to have higher unit prices. This is a result of adjustments in product characteristics and pricing made necessary by fierce low-price competition. This shows that only by increasing processing technology and product added value can the industry really thrive. Solar cells, may open yet another path for Taiwan’s bags, cases and luggage makers. Adding functions through integration with solar cell technology, local makers can orient themselves to the high unit-price market.. 300. 10 0 millio n in NT$. 250. 240. 272. 255 250 206. 200 175. 200. 149 145 157. 150. 115 115. 129. 112 105. 88 69 66. 100. 54 39. 38 48 47 21. 50 0. 1982 1983 1984 1985 1986 1987 1988 1989 1990 1991 1992 1993 1994 1995 1996 199 7 1998 1999 2000 2001 2002 2003 2004 2005. Year. Date Sources: www.tier.org.tw; The Development Trends of Textile Integrated Photovoltaics” ITIS Project, 2006.. Fig. 9. Non-leather Luggage and Hand-carried Bags Export Values. 20000 17849 17703. x10,000 pieces. 15000. 15077. 15948 14929. 14057 14421. 8341 6242. 5000. Export Value (in 100 million) Volume (x1000) Unit Price (in NT$) Export Value (in 100 million) Volume (x1000) Unit Price (in NT$) Export Value (in 100 million) Volume (x1000) Unit Price (in NT$) Export Value (in 100 million) Volume (x1000) Unit Price (in NT$). 1982 239.54. 1983 254.84. 1984 250.12. 1985 206.23. 1986 148.55. 1987 145.33. 150,770 158.88. 178,491 142.77. 177,034 141.28. 174,711 118.04. 159,479 93.15. 149,294 97.35. 1988 156.64. 1989 271.64. 1990 200.45. 1991 175.21. 1992 114.54. 1993 114.50. 140,574 111.43. 144,212 188.36. 108,968 183.95. 83,405 210.08. 62,421 183.5. 46,819 244.56. 1994 129.21. 1995 111.84. 1996 104.98. 1997 87.52. 1998 68.75. 1999 65.96. 42,245 305.85. 33,455 334.29. 30,681 342.15. 23,633 370.34. 20,606 333.69. 19,785 333.41. 2000 53.59. 2001 38.95. 2002 38.42. 2003 47.58. 2004 47.33. 2005 21.21. 19,909 269.16. 16,084 242.17. 14,253 269.56. 17,846 266.61. 15,366 308.01. 6,061 349.98. Date Sources: www.tier.org.tw; The Development Trends of Textile Integrated Photovoltaics, ITIS Project, 2006.. Yet, if we make a deep probe into why the Chinese bags, cases and luggage industry continues to expand in the international market, we discover that behind their success are Taiwan investors. That goes to say that Taiwan uses its own technology and management expertise, integrated with China’s cheap labor, to join hands in entering the global market. To date, this strategy seems to be working. Thus, even though Taiwan no longer holds the title of “world’s top bags, cases and luggage maker,” it is now replaced by the title “global leader,” the latter in reference to Taiwanese investors who have moved their product base to mainland China and Southeast Asia. 3. Conclusions and Recommendations The conclusions of this paper will be made on three areas—technology, market and regulations—to better understand the problems faced by Taiwan manufacturers today, as well as to analyze what measures they must adopt.. 17471. 10897. 10000. Table 3. Export for Non-leather Luggage and Hand-carried Bags. 4682. 4225 3346 3068. 2363 2061 1979 1991 1608 1425 1785 1537 606. 0 1982 1983 1984 1985 1986 1987 1988 1989 1990 1991 1992 1993 1994 1995 1996 1997 1998 1999 2000 2001 2002 2003 2004 2005. Year. Date Sources: www.tier.org.tw; The Development Trends of Textile Integrated Photovoltaics, ITIS Project, 2006.. Fig. 10. Non-leather Luggage and Hand-carried Bags Export Volumes. 3.1 Technology Although Taiwan manufacturers face fierce competition from Chinese and Southeast Asian counterparts, they actually have their own advantages. Taiwan’s electronic industry is mature and superior, such that the learning curve for engaging in solar cell production will be shorter and much more efficient compared with other countries. Moreover, Taiwan is very familiar with membrane textiles and bags, cases and luggage production, so that the challenges of integrating these industries with solar cell technology can easily be overcome. Some solar energy bags are now visible in the market. Although already present in the market,.
(6) this type of products has a lot of room for improvements as far as fashion is concerned. Perhaps a better way to improve consumer attraction is to find a bag product of trendy design to which solar cells may be installed. However, the amount of added cost may be too forbidding. Currently, electronic apparel is a much-waited addition among people in the textile industry. Makers of portable electronic products and parts will be interested in the combination. For solar energy textiles, the hope is to arrive at fibers that are themselves solar cells. Scientists are currently working on this but it may require some time for integration before products can actually attain a certain level of practicality. For this reason, the direct integration of solar cells into textile products may be a more feasible method. As existing solar cells are modularized, merely sewing them on may even prove useful, and this may lower down technical difficulties. The bigger problem is the function of the textile product after solar cells have been installed, as well as their effects on aesthetics and fashion. Other issues of concern are the bending- and water-resistance of solar cells and aggregate parts. After solutions to all these are found, solar energy textiles cannot be broadly called textiles, for which naming and branding must be important areas to work on. In summary, making solar cells become part of textiles is an excellent way to upgrade product functions and increase value-added. However, one must focus merely on technology. To make products more attractive to consumers, the idea of maintaining the ultimate function of textile products must never be overlooked. 3.2 Market It is predicted that electronic apparel will have a market of US$560 million in 2006. In 2005, the US imported US$2 billion worth of plastic and textile bags, cases and luggage products. In 2006, the US demand for all types of membrane textile will be worth US$2.2 billion. The figures are large and still growing. With the current number of investors still quite limited, we can assume that a short-term goal for solar energy textiles of 5% of the above market size is reasonable. Currently, the addition of 1 watt of solar cells to small size bags and cases will mean an increase, based on current prices, of about NT$100 in cost (excluding rechargeable batteries). However, the selling price can have mark ups of between NT$500 to 3000. Moreover, as the market is barely rising, the potentials of the market are great. However, there is much room for improvement, such as increasing wattage, and shifting attention from quantitative to qualitative issues, before the target consumer brackets can be made active in the market. If more are done in terms of branding and fashion, the market can be expanded to include female consumers. The industry is still in the development stage, but all interested manufacturers must remember to take actions double-step. 3.3 Regulations Taiwan laws now cover regulations on “green building.” Owing to the light penetration of membrane textiles, gymnasiums easily become hot and humid, making increased power consumption for air-conditioning a necessity. For this reason, membrane textiles are not ecology-conscious, energy-saving products. However, solar cells can fully solve the predicament. By installing solar cells on membrane textiles, light penetration can be ameliorated and air-conditioning costs economized. Moreover, the power thus generated can be utilized. All these can make membrane textile an attractive choice for green buildings as well.. Current proposed laws include regulations on energy recycling, although this has yet to pass the third reading. Among others, these regulations include subsidies for the solar energy industry in terms of installation and electricity prices. However, these subsidies are limited to solar energy generation for buildings. No such coverage is extended to solar cells for textiles. The cost of solar cell installation on textiles is in the vicinity of a few hundred dollars, a figure considered acceptable for consumers. As textile products are common necessities, tax benefits and subsidy measures may be legislated to cover the industry or its products. The energy-saving concept of solar power generation, when applied to the clothes we wear, is something worth propagating. The rise of solar power will benefit not just the solar energy industry. Its applicable potentials cover the electronics, telecommunications, lighting and textile industries as well. Taiwan, with its long-term development experience in textiles and electronics, must fully exploit these advantages to hone the competitiveness of its industries and to increase their value-added. In the imminent solar energy textile products competition, Taiwan has the capabilities to find a place of significance for itself. It is worth the combined efforts of the government, the industries and the private sector, so that Taiwan can create an industrial achievement yet again. Acknowledgements The authors gratefully acknowledge the Industry & Technolgy Intelligence Services (ITIS) for their financial support. References [1] The Global Market for Wearable Computers: Then Quest for Killer Applications..
(7)
數據
![Table 2. Predictions for Various US Market Applications of Membrane Textiles [unit: Million square yards]](https://thumb-ap.123doks.com/thumbv2/9libinfo/8917593.261940/3.892.87.415.463.714/table-predictions-various-market-applications-membrane-textiles-million.webp)
相關文件
The majority of cases of malignancy in conjunction with dental implants in both the literature and the pre- sent series have been of SCC, and most were primary tumors, which is
Huvos, “Central salivary gland tumors of the maxilla and mandible: a clinicopathologic study of 11 cases with an analysis of the literature, ” Journal of Oral and Maxillofacial
Additionally, we review the literature for cases of benign glomus tumor in the oral regions and offer data on the clinical and histopathologic features of this rare tumor.. CASE
Orthokeratinized odontogenic cyst with an associated keratocystic odontogenic tumor component and ghost cell Table 1 Previous case reports of multiple orthokeratinized
body and ramus of the mandible, displacing the tooth germs of the first and second permanent lower right molars. d, e Cone beam com- puted tomography revealed a hypodense image in
Animal or vegetable fats and oils and their fractiors, boiled, oxidised, dehydrated, sulphurised, blown, polymerised by heat in vacuum or in inert gas or otherwise chemically
Milk and cream, in powder, granule or other solid form, of a fat content, by weight, exceeding 1.5%, not containing added sugar or other sweetening matter.
Cartons, boxes, cases, bags and other packing containers, of paper, paperboard, cellulose wadding or webs of cellulose fibres; box files, letter trays and similar articles, of paper
