Body Mass Index and All-cause Mortality in a large Chinese Cohort
Wen-Yuan Lin MD, PhD1,2,3,5, Shin-Li Tsai MD, MS5, Jeanine B. Albu MD8,
Cheng-Chieh Lin MD, PhD1,2,3,6, Tsai-Chung Li, PhD4,6, F. Xavier Pi-Sunyer MD,
MPH8, Pei-Kun Sung MD7, Kuo-Chin Huang MD, PhD3,5 1
Department of Family Medicine, China Medical University Hospital, Taichung,
Taiwan; 2School of Medicine, 3Graduate Institute of Clinical Medical Science, and 4
Graduate Institute of Biostatistics, China Medical University, Taichung, Taiwan; 5
Department of Family Medicine, National Taiwan University Hospital, Taipei,
Taiwan; 6Institute of Health Care Administration, College of Health Science, Asia
University, Taichung, Taiwan; 7MJ Health Screening Center, Taipei, Taiwan; 8New
York Obesity Research Center, St. Luke’s-Roosevelt Hospital, Columbia University,
New York, United States
Short running title: Body mass index and mortality in Taiwan
Correspondence and reprint request to:
Kuo-Chin Huang
Department of Family Medicine, National Taiwan University Hospital, 7 Chung-Shan
South Road, Taipei, Taiwan 100 Tel: +886-2-23123456 ext 66081, Fax:
+886-2-23118674, E-mail: [email protected]
Funding/Support: This study was financially supported by grants from China
Medical University Hospital (DMR-97-149, DMR-98-090 and DMR-99-110, Dr. WY
Lin and CC Lin), from Taiwan Department of Health Clinical Trial and Research
Center of Excellence (DOH99-TD-B-111-004, Dr. TC Li), and from the US National
Institutes of Health (DK 026687, Dr. FX Pi-Sunyer).
Abstract
1
Background: Obesity, defined by the body mass index (BMI), is related to the
2
increased risk of death in Caucasians. However, the prospective association between 3
BMI and the risk of death in adult Taiwanese remains unclear. 4
Methods: We examined the association between BMI and all-cause mortality
5
prospectively among 58,738 men and 65,718 women, aged 20 years and older at 6
enrollment in 1998-1999, from four nationwide health screening centers in Taiwan. 7
Cox proportional hazards regression analyses were used to estimate the relative risks 8
of all-cause death for different BMI categories during a maximum follow-up of 10 9
years. 10
Results: 3,947 participants died during the follow-up period. The lowest risks of
11
death were observed at a BMI between 24.0 to 25.9 for both men and women (mean 12
BMI= 24.9 in both genders). After adjustment for age, smoking status, alcohol intake, 13
betel nut chewing, physical activity, income status, and education level, a U-shaped 14
association between BMI and all-cause death was observed. Similar U-shaped 15
relationship existed on different age groups, smoking status, having preexisting 16
chronic diseases, or if excluding deaths during the first 3 years of follow up. 17
Interpretation: The association between BMI and all-cause death was represented as
18
a U-shape relationship in adult Taiwanese. The lowest risk for all-cause death among 19
Keywords: body mass index, mortality, obesity, underweight, Chinese
1 2
Introduction
1
The prevalence of obesity has dramatically increased in past decades in both 2
developed and developing countries. The World Health Organization (WHO) reported 3
that 1.6 billion adults are overweight and at least 400 million adults are obese; they 4
further predicted that by year 2015, approximately 2.3 billion adults will be 5
overweight and more than 700 million will be obese 1. In Taiwan, according to the 6
National Health and Nutrition Survey performed between 1993-1996 and 2005-2008, 7
the prevalence of overweight or obesity (defined as body mass index (BMI) ≥ 24 8
kg/m2) in men and women had also dramatically increased from 33.4 % and 31.7 % to 9
50.8 % and 36.9 % 2. Overweight and obesity have been recognized as important and 10
independent risk factors for many chronic diseases, such as diabetes, hypertension, 11
stroke, cardiovascular diseases, and cancers 3-7. Substantial epidemiological evidences 12
indicated that obesity is associated with increased cardiovascular and all-cause 13
mortality 8,9. Therefore, obesity has become a major public health problem around the 14
world. Current definitions for obesity and overweight in adults were based on 15
Caucasian populations. The WHO has proposed another definition of obesity and 16
overweight for Asians, but most of these data were based on the cross-sectional 17
studies 10. Previous study also found that, for a given BMI, Asians had higher body fat 18
than Caucasians 11. Furthermore, the association between BMI and all-cause mortality 19
had been found to be a J-shaped or U-shaped relationship. Most studies were done in 1
Caucasians, with only a few conducted amongst Asians. For example, Gu et al 2
reported that a U-shaped association existed between BMI and all-cause mortality in 3
Chinese 12. However, the participants in Gu’s study were middle-aged adults with age 4
over 40 years, not general adults (age over 20 years). Therefore, we designed a large 5
prospective cohort study to assess the relationship between BMI and all-cause 6
mortality in a nationwide representative sample of Taiwanese adult (age over 20 7
years). We also intended to find the optimal BMI cut-off values for overweight or 8
obesity in Taiwanese adults. 9
Methods
1
Study subjects
2
The data were collected from four private nationwide MJ Health Screening 3
Centers in Taiwan from 1998 to 1999. Membership was required for attending the 4
programme. The registered health practitioners in these centers provide a 5
multidisciplinary team approach of health assessment programme for their members. 6
Most of them undergo health examination every 3-4 years and approximately 30 % of 7
them will receive the same health check-up every year. A total of 58,738 male and 8
65,718 female adults, aged 20 years and above, were recruited into the study. The 9
population structure in our study was similar to the national data of adult published by 10
the Taiwanese government. The population structure in our study was similar to the 11
national data of adult published by the Taiwanese government 13. Deaths were 12
ascertained by computer linkage to the national death registry using ID number. All 13
deaths that occurred between study entry and December 2008 were included. 14
Anthropometric indices
15
Anthropometric characteristics were described in our previous report 14,15. In 16
brief, trained staff measured height (measured to the nearest 0.1 cm) and weight 17
(measured to the nearest 0.1 kg) of each participant using an auto-anthropometer 18
(KN-5000A, Nakamura, Tokyo, Japan). Body mass index (BMI) was calculated as 19
weight (kg) divided by height squared (m2). Study participants were grouped into 9 1
categories according to BMI at baseline (<18.5, 18.5-19.9, 20-21.9, 22-23.9, 24-25.9, 2
26-27.9, 28-29.9, 30-34.9,and ≥35 kg/m2). Approval for patient recruitment and data 3
analyses was obtained from the MJ Research Foundation Review Committee in 4
Taiwan. Informed consent was obtained from every subject. The reported 5
investigations were carried out in accordance with the principles of the Declaration of 6
Helsinki as revised in 2000. 7
Questionnaire
8
Cigarette smoking, alcohol intake, betel nut chewing, and physical activity 9
histories were recorded for each subject using questionnaires. Current, former, or 10
never users for smoking, alcohol intake, and betel nut chewing were defined as those 11
who reported the current use, any prior use, or never use of these substances, 12
respectively, at baseline survey. The cumulative exposure to smoking was assessed by 13
recording the duration (years) and quantity (number of cigarettes/day). Former users 14
were also asked for their age at quitting. Cumulative pack-years of smoking were 15
calculated as smoking-years multiplied by average daily cigarette use divided by 20. 16
Cumulative pack-years for smokers were categorized into two groups (Low: <10 17
pack-years; High: ≥ 10 pack-years), so smoking status was categorized as none (0 18
pack-years), low (0~9.9 pack-years), and high (≥ 10 pack-years). Physical activity 19
was classified into three levels: none to mild (exercise less than one hour per week), 1
moderate (exercise one to four hours per week), and vigorous (exercise more than five 2
hours per week) physical activity. Income status was sub-divided into three levels: 3
low (< USD 12,500/year), middle (12,500-37,500/year), and high (>37,500/year). 4
Education was also sub-divided into three levels: low (elementary school and below), 5
middle (junior and senior high school), and high (college/university and above). 6
Participants who reported a history of stroke, cardiovascular disease, liver cirrhosis, 7
asthma, chronic renal disease, and cancer were defined as with preexisting chronic 8
diseases (n=15,180). Others were defined as health participants (n=109,276). 9
Statistical analysis
10
The data are presented as the means and standard deviation for continuous 11
variables. Analysis of variance (ANOVA) test was used to compare the continuous 12
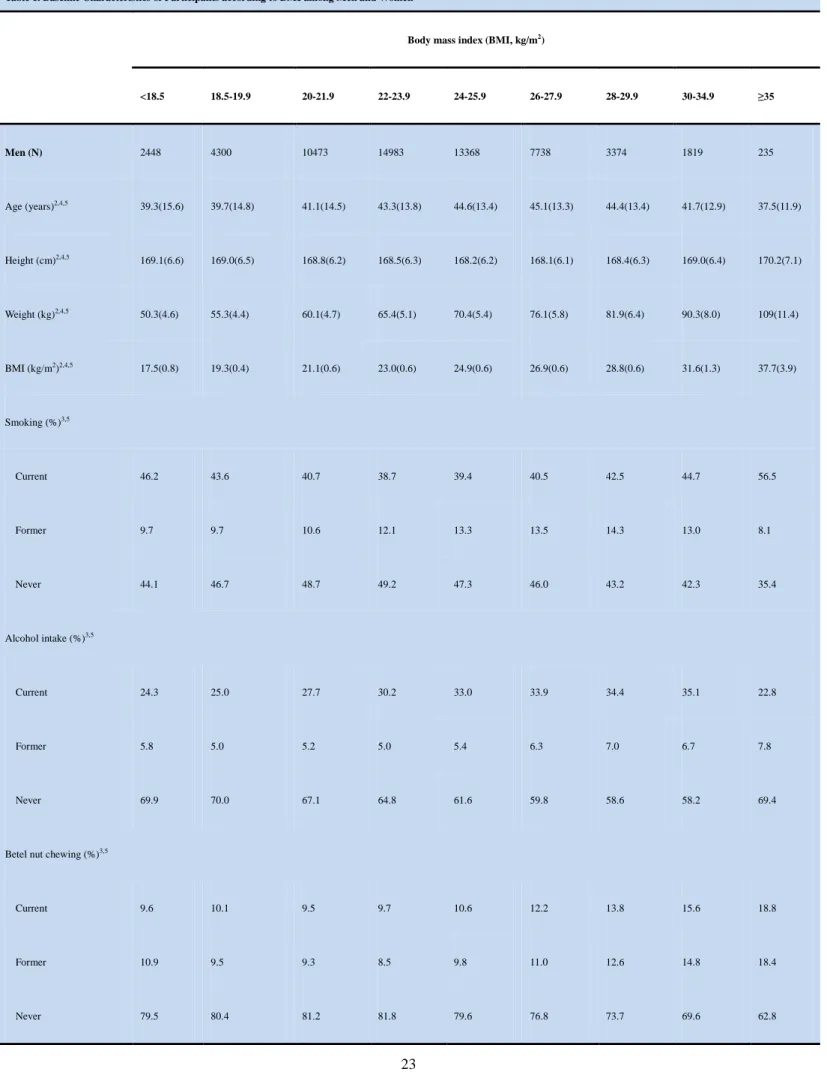
variables (such as age, height, weight) across BMI groups in Table 1. Proportions and 13
categorical variables (such as smoking, alcohol drinking, and betel nut chewing status) 14
were tested by the χ2 test and by the two-tailed Fisher’s exact method when 15
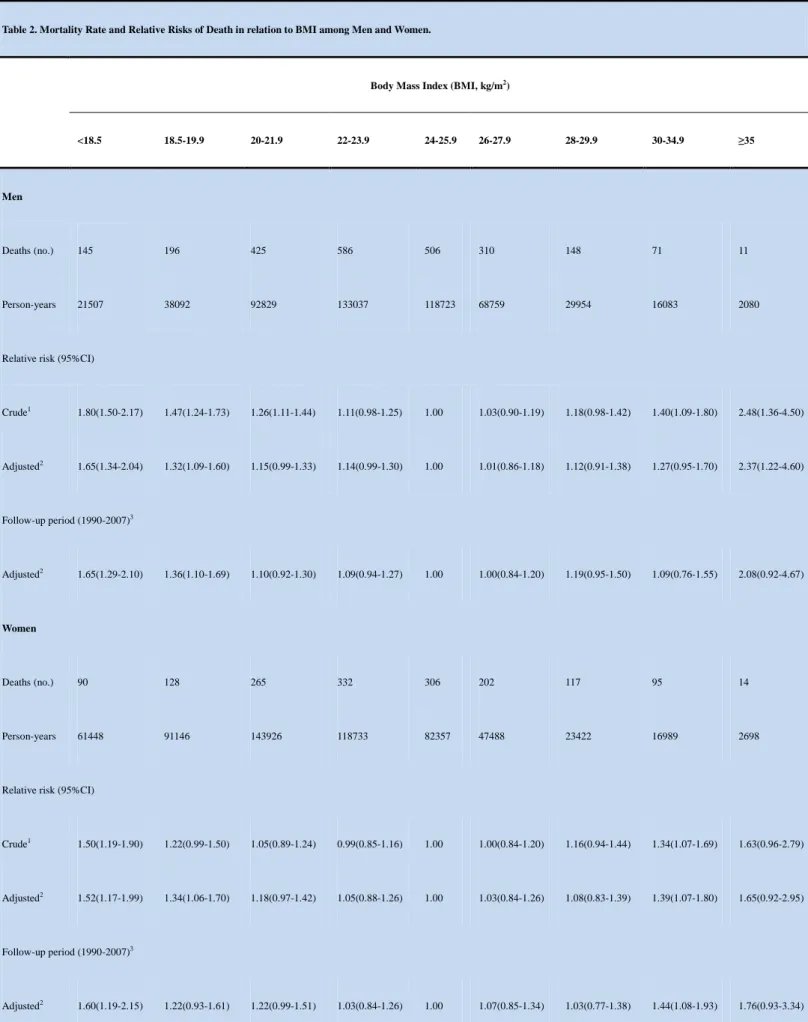
appropriate in Table 1. Cox proportional hazards regression analyses adjusted for 16
possible confounders were used to estimate the relative risks (RRs) for all-cause death 17
in relation to BMI categories in Table 2 and Figure 1-2. Survival curves adjusted for 18
other covariates were drawn for different BMI categories in Figure 1-2. These 19
statistical analyses were performed using the PC version of SPSS statistical software 1
(13th version, SPSS Inc., Chicago, IL, USA). 2
Results
1
During a maximum follow-up of 10 years (1,109,273 person-years), 2,398 men 2
and 1,549 women died. In Table 1, we showed the baseline characteristics of study 3
participants across 9 BMI categories. Participants with a higher BMI, as compared 4
with those who had a lower BMI, were characterized by older age, more likely to 5
consume alcohol and betel nut chewing currently, less physical activity, with higher 6
income status in men and a lower income status and lower educations level in 7
women,. 8
In Table 2, we showed the RRs for the risk of all-cause death among men and 9
women. It poses a nonlinear association between BMI and the risk of all-cause death. 10
The lowest risk in relation to all-cause death among both male and female participants 11
was found at a BMI between 24.0 to 25.9 kg/m2. There was a statistically significant 12
U-shaped association between BMI and all-cause death. Using participants with a 13
BMI between 24.0 to 25.9 as the reference group, and with the Cox proportional 14
hazards regression analyses with adjustment for age, smoking status, alcohol intake, 15
betel nut chewing, physical activity, income status, and education level, the RRs for 16
all-cause death across BMI categories among men and women were showed in Table 17
2 and Figure 1.
18
There were significant interactions (P< 0.05) between BMI categories and 19
preexisting chronic disease status/age group/smoking status for predicting the risk of 1
all-cause mortality. We therefore stratified these groups and presented the results in 2
Figure 2. Figure 2 showed the adjusted RRs in relation to all-cause death according
3
to smoking status (never smoker, low-dose smokers, and high-dose smokers; Figure 4
2a), different age groups (participants aged 20 to 64 years old and aged 65 years or 5
more; Figure 2b), and with or without preexisting chronic diseases (Figure 2c). The 6
U-shaped association between BMI and all-cause death persisted within these three 7
smoking groups and within the two age groups. High-dose and low-dose smokers 8
seem to have higher RRs for all-cause mortality in relation to BMI than the never 9
smokers with increased risks in the lower BMI categories. In comparison to the 10
high-dose smokers, for those participants in the higher BMI categories, the RRs for 11
all-cause mortality were higher among never and low-dose smokers. In comparison to 12
participants less than 65 years, the RRs for all-cause mortality in lower and higher 13
BMI categories were higher among those with age over 65 years. The lowest all-cause 14
mortality was also found in BMI between 24.0 to 25.9 in both age groups. Participants 15
with or without preexisting chronic diseases also exhibited the U-shaped relationship 16
between BMI and all-cause death. Participants with preexisting chronic diseases in the 17
lower BMI categories had higher risks of death than healthy participants. In contrast, 18
participants with preexisting chronic diseases in the higher BMI categories had lower 19
risks of death than healthy participants. 1
After excluding study participants who died during the first 3 years of follow-up 2
and using BMI between 24.0 to 25.9 for comparison, the adjusted RRs for all-cause 3
death across BMI categories were also showed in Table 2. The U-shaped association 4
between BMI and all-cause death still existed among both men and women. 5
Interpretation
1
In this population-based prospective study, we demonstrated that the higher risks of 2
death were observed in the lower and upper BMI categories compared to the middle 3
categories, showing a U-shaped relationship between BMI and all-cause mortality in 4
adult Taiwanese. The same U-shaped association existed on those who were either 5
aged over 65 or less than 65 years old, or who were never smokers, low-dose smokers, 6
or high-dose smokers, or who were with or without preexisting chronic diseases, or 7
who did not die during the first 3 years of follow-up. In addition, we also found that 8
the lowest death in relation to BMI was observed at a BMI of 24.9 for both men and 9
women. 10
The WHO has proposed a lower BMI cut-off values for defining overweight and 11
obesity in Asians. However, most of this evidence was based on cross-sectional 12
studies. Some prospective studies done in Chinese have reported the U-shaped 13
relationship between BMI and all-cause mortality and found subjects with BMI 14
between 24.0 to 28.0 have the lowest risks of all-cause death 12,16,17. For example, Gu 15
et al reported that subjects with BMI between 24.0 to 24.9 in both men and women 16
had the lowest risk of all-cause death in 169,871 Chinese aged 40 years and older. 17
Studies done in Caucasians have also identified a J- or U-shaped association between 18
BMI and all-cause mortality. They also reported that subjects with a BMI between 19
23.0 to 28.0 had lowest risk in relation to all-cause mortality and the minimum 1
mortality close to a BMI of 25.0 8,18-20. Our findings are consistent with these studies 2
and do not support the use of a lower BMI cut-off value for obesity in Taiwanese 3
general adults. We also conducted the sensitivity analyses to demonstrate the optimal 4
cut-off values of BMI for all-cause mortality by dividing BMI into 15 groups 5
according to BMI- <18.5, 18.5-19.9, 20-20.9, 21-21.9, 22-22.9, 23-23.9, 24-24.9, 6
25-25.9, 26-26.9, 27-27.9, 28-28.9, 29-29.9, 30-34.9, ≥35 kg/m2. The lowest risk of 7
death was observed at a BMI of 24.0 to 24.9 for men and 25.0 to 25.9 for women 8
(mean BMI= 24.5 in men and 25.5 in women) which were also consistent with our 9
results (BMI: 24.0-25.9). These findings demonstrated the robustness of our results. 10
Previous studies had found that age was an effect modifier for the relationship 11
between BMI and the risk of death 18,20. For example, Weiss et al reported that BMI is 12
inversely related to mortality in the elderly 21. Our study, however, found that the 13
similar U-shaped association between BMI and all-cause death was presented among 14
participants aged 20 to 64 years and among those 65 years and above. This finding did 15
not support the theory of “obesity paradox” in the elderly. 16
Smoking is associated with lower body weight and an increased risk of death 22-24. 17
Compared to previous studies 12,23, our findings are consistent with the findings that 18
among current smokers, subjects in lower BMI categories had higher risk of death. 19
However, among never smokers we did not find subjects in the higher BMI categories 1
had higher risk of death. Similar U-shaped relationships between BMI and all-cause 2
mortality were found among never smokers, low-dose smokers, and high-dose 3
smokers. 4
Preexisting chronic diseases were linked to an increase in all-cause death and 5
decrease in body weight. Two criteria were used to avoid possible bias caused by 6
preexisting chronic diseases: 1) limited the analysis to healthy participants and 2) 7
excluded those who died during the first 3 years of follow-up. In this study, similar 8
U-shaped association between BMI categories and all-cause death remained existed 9
after making these adjustments. In the lower BMI categories, the risk of death was 10
higher for those participants with preexisting chronic diseases, compared to healthy 11
participants. This confirmed that preexisting chronic diseases were associated with the 12
increase of all-cause death. In contrary, in the higher BMI categories, the risk of death 13
among participants with preexisting chronic diseases was lower compared to the 14
healthy participants. This suggested that obesity may be a protective factor among 15
subjects with preexisting chronic diseases. However this finding was consistent with 16
the reports from other populations i.e. see Adams et al. in the United States 25. 17
Limitations
18
Although we have shown that a U-shaped relationship existed between BMI and 19
all-cause mortality in adult Taiwanese, there are some limitations in this study. Firstly, 1
we didn’t measure the weight at the end of follow-up, so we could not get information 2
about weight changes over time. Hence, we could not find the relationship between 3
weight change and mortality. Secondly, our study population mainly came from 4
generally healthy volunteers who attended health screening centers rather than 5
nationally representative subjects. However, the population structure in our study was 6
similar to the national data of adult published by the Taiwanese government. External 7
validation will be necessary in future studies. Finally, we have adjusted several 8
variables, including smoking status, alcohol intake, betel nut chewing, physical 9
activity, level of education, and level of income, which allowed us to minimize the 10
potential confounders. However, we still could not exclude the possibility of the 11
residual confounding. 12
Conclusion
13
We have demonstrated that both obesity and underweight are related to increase 14
all-cause mortality in adult Taiwanese population. This relation was found in persons 15
who were above or less than 65 years old, were heavy, mild, or never smokers, were 16
with or without preexisting chronic diseases, and who did not die during the first 3 17
years of follow-up. The consistency of our findings in both men and women and 18
across all ages (younger to middle-aged adults and in the elderly) also argues for the 19
use of a single recommended range of body weight throughout life. 1
Competing interests: None declared
1
Contributions: Dr. WY Lin and KC Huang had full access to all of the data in the
2
study and take responsibility for the integrity of the data and the accuracy of the data 3
analysis. Study concept and design: Dr. WY Lin, CCLin, and KC Huang. Acquisition 4
of data: Dr. PK Song, SL Tsai, and TC Li. Analysis and interpretation of data: Dr. WY 5
Lin, JB Albu, FX Pi-Sunyer, and TC Li. Drafting of the manuscript: Dr. WY Lin and 6
KC Huang. Critical revision of the manuscript for important intellectual content: Dr. 7
JB Albu, FX Pi-Sunyer, CC Lin, TC Li, and KC Huang. Statistical analysis: Dr. WY 8
Lin, SL Tsai, and TC Li. Obtained funding: Dr. WY Lin, CC Lin, TC Li, and FX 9
Pi-Sunyer. Administrative, technical, and material support: Dr. PK Song and CC Lin. 10
Study supervision: Dr. CC Lin, KC Huang, JB Albu, and FX Pi-Sunyer. All of the 11
authors approved the final version of the manuscript submitted for publication. 12
Acknowledgement: The authors thank staff from MJ clinical for their kindly assistant
13
in data collection. 14
Funding/Support: This study was financially supported by grants from China
15
Medical University Hospital (DMR-97-149, DMR-98-090 and DMR-99-110, Dr. WY 16
Lin and CC Lin), from Taiwan Department of Health Clinical Trial and Research 17
Center of Excellence (DOH99-TD-B-111-004, Dr. TC Li), and from the US National 18
Institutes of Health (DK 026687, Dr. FX Pi-Sunyer). 19
REFERENCE
1. World Health Organization. Obesity and overweight. 2006;Fact sheet
311:http://www.who.int/mediacentre/factsheets/fs311/en/index.html. Accessed at 10, Dec., 2010.
2. Department of Health, Executive Yuan, TAIWAN. Prevalence of overweight, obesity, and metabolic
syndrome in Taiwan. 2009: http://www.doh.gov.tw/EN2006/index_EN.aspx. Accessed at 10, Dec., 2010.
3. Calle EE. Obesity and cancer. BMJ 2007;335:1107-8.
4. World Health Organization. Obesity: preventing and managing the global epidemic. Report of a WHO
consultation. WHO Tech Rep Ser 2000;894:1-253.
5. Narayan KM, Boyle JP, Thompson TJ, et al. Effect of BMI on lifetime risk for diabetes in the U.S.
Diabetes Care 2007;30:1562-6.
6. Lin WY, Yang WS, Lee LT, et al. Insulin resistance, obesity, and metabolic syndrome among
non-diabetic pre- and post-menopausal women in North Taiwan. Int J Obes (Lond) 2006;30:912-7.
7. Lin WY, Yao CA, Wang HC, et al. Impaired lung function is associated with obesity and metabolic
syndrome in adults. Obesity (Silver Spring) 2006;14:1654-61.
8. Pischon T, Boeing H, Hoffmann K, et al. General and abdominal adiposity and risk of death in Europe.
N Engl J Med 2008;359:2105-20.
9. Kannel WB, D'Agostino RB, Cobb JL. Effect of weight on cardiovascular disease. Am J Clin Nutr
1996;63:419S-22S.
10. World Health Organization. The Asia-Pacific perspective:Redefining obesity and its treatment.
subjects: implications of obesity cutoffs. Int J Obes Relat Metab Disord 2003;27:253-9.
12. Gu D, He J, Duan X, et al. Body weight and mortality among men and women in China. JAMA
2006;295:776-83.
13. Department of Health, Executive Yuan, Taiwan. Taiwan Public Health Report 1998-2000. DOH: Taipei,.
2001:http://www.doh.gov.tw.
14. Lin WY, Chiu TY, Lee LT, et al. Betel nut chewing is associated with increased risk of cardiovascular
disease and all-cause mortality in Taiwanese men. Am J Clin Nutr 2008;87:1204-11.
15. Lin WY, Lee LT, Chen CY, et al. Optimal cut-off values for obesity: using simple anthropometric
indices to predict cardiovascular risk factors in Taiwan. Int J Obes Relat Metab Disord 2002;26:1232-8.
16. Zhou BF. Effect of body mass index on all-cause mortality and incidence of cardiovascular
diseases--report for meta-analysis of prospective studies open optimal cut-off points of body mass index in
Chinese adults. Biomed Environ Sci 2002;15:245-52.
17. Yuan JM, Ross RK, Gao YT, et al. Body weight and mortality: a prospective evaluation in a cohort of
middle-aged men in Shanghai, China. Int J Epidemiol 1998;27:824-32.
18. Flegal KM, Graubard BI, Williamson DF, et al. Excess deaths associated with underweight, overweight,
and obesity. JAMA 2005;293:1861-7.
19. Allison DB, Fontaine KR, Manson JE, et al. Annual deaths attributable to obesity in the United States.
JAMA 1999;282:1530-8.
20. Calle EE, Thun MJ, Petrelli JM, et al. Body-mass index and mortality in a prospective cohort of U.S.
subjects. J Gen Intern Med 2008;23:19-24.
22. Gu D, Kelly TN, Wu X, et al. Mortality attributable to smoking in China. N Engl J Med 2009;360:150-9.
23. Miyazaki M, Babazono A, Ishii T, et al. Effects of low body mass index and smoking on all-cause
mortality among middle-aged and elderly Japanese. J Epidemiol 2002;12:40-4.
24. Wilson K, Clark H, Hotz S, et al. Impact of smoking status on weight loss and cardiovascular risk
factors. J Epidemiol Community Health 2001;55:213-4.
25. Adams KF, Schatzkin A, Harris TB, et al. Overweight, obesity, and mortality in a large prospective
Table 1. Baseline Characteristics of Participants according to BMI among Men and Women1
Body mass index (BMI, kg/m2)
<18.5 18.5-19.9 20-21.9 22-23.9 24-25.9 26-27.9 28-29.9 30-34.9 ≥35 Men (N) 2448 4300 10473 14983 13368 7738 3374 1819 235 Age (years)2,4,5 39.3(15.6) 39.7(14.8) 41.1(14.5) 43.3(13.8) 44.6(13.4) 45.1(13.3) 44.4(13.4) 41.7(12.9) 37.5(11.9) Height (cm)2,4,5 169.1(6.6) 169.0(6.5) 168.8(6.2) 168.5(6.3) 168.2(6.2) 168.1(6.1) 168.4(6.3) 169.0(6.4) 170.2(7.1) Weight (kg)2,4,5 50.3(4.6) 55.3(4.4) 60.1(4.7) 65.4(5.1) 70.4(5.4) 76.1(5.8) 81.9(6.4) 90.3(8.0) 109(11.4) BMI (kg/m2)2,4,5 17.5(0.8) 19.3(0.4) 21.1(0.6) 23.0(0.6) 24.9(0.6) 26.9(0.6) 28.8(0.6) 31.6(1.3) 37.7(3.9) Smoking (%)3,5 Current 46.2 43.6 40.7 38.7 39.4 40.5 42.5 44.7 56.5 Former 9.7 9.7 10.6 12.1 13.3 13.5 14.3 13.0 8.1 Never 44.1 46.7 48.7 49.2 47.3 46.0 43.2 42.3 35.4 Alcohol intake (%)3,5 Current 24.3 25.0 27.7 30.2 33.0 33.9 34.4 35.1 22.8 Former 5.8 5.0 5.2 5.0 5.4 6.3 7.0 6.7 7.8 Never 69.9 70.0 67.1 64.8 61.6 59.8 58.6 58.2 69.4
Betel nut chewing (%)3,5
Current 9.6 10.1 9.5 9.7 10.6 12.2 13.8 15.6 18.8
Physical activity (%)3,5 None/mild 52.1 48.6 45.5 42.6 42.8 44.7 46.4 51.0 55.6 Moderate 34.9 37.5 38.4 39.4 38.5 37.2 36.5 34.5 34.7 Vigorous 13.1 13.8 16.1 18.0 18.7 18.1 17.1 14.5 9.7 Income (%)3,5 Low 39.7 37.2 32.2 27.8 27.0 28.3 29.3 29.0 34.6 Moderate 55.1 57.1 59.5 61.5 60.6 59.2 58.5 60.3 55.1 High 5.2 5.7 8.3 10.7 12.4 12.5 12.2 10.7 10.3 Education (%)3,5 Low 13.5 13.7 13.5 15.5 16.9 18.3 18.9 15.8 12.6 Moderate 38.2 36.1 34.6 33.2 34.8 36.1 37.5 39.0 41.7 High 48.3 50.2 51.8 51.3 48.4 45.6 43.6 45.2 45.7 Women (N) 6850 10171 16054 13253 9224 5322 2633 1908 303 Age (years)2,4,5 32.7(10.6) 35.5(11.1) 40.1(12.2) 45.5(13.1) 49.5(12.8) 51.6(12.5) 51.8(12.4) 51.2(13.0) 47.6(13.5) Height (cm)2,4,5 158.6(5.6) 158.0(5.5) 157.0(5.6) 155.7(5.6) 155.0(5.5) 154.4(5.5) 154.3(5.6) 154.3(5.6) 154.4(6.3) Weight (kg)2,4,5 44.0(3.7) 48.3(3.5) 51.8(3.8) 55.7(4.1) 59.9(4.4) 64.2(4.7) 68.9(5.1) 75.6(6.3) 89.7(9.5) BMI (kg/m2)2,4,5 17.5(0.8) 19.3(0.4) 21.0(0.6) 23.0(0.6) 24.9(0.6) 26.9(0.6) 28.9(0.6) 31.7(1.3) 37.6(2.4) Smoking (%)3,5 Current 9.0 7.3 5.6 4.7 3.9 4.2 4.3 5.0 6.7 Former 2.2 2.0 1.6 1.3 1.1 1.0 1.5 1.5 2.1
Never 88.8 90.7 92.8 94.0 95.0 94.8 94.2 93.5 91.2
Alcohol intake (%)3,5
Current 5.6 4.9 5.9 5.7 5.7 5.6 4.6 5.3 6.2
Former 1.5 1.3 1.4 1.6 1.5 1.4 1.3 2.3 6.2
Never 92.9 93.8 92.7 92.8 92.8 92.9 94.1 92.4 87.6
Betel nut chewing (%)3,5
Current 0.2 0.3 0.3 0.3 0.5 0.9 1.3 1.6 2.9 Former 0.2 0.1 0.2 0.4 0.3 0.5 0.5 0.9 0.4 Never 99.6 99.6 99.5 99.3 99.2 98.6 98.2 98.5 96.7 Physical activity (%)3,5 None/mild 67.2 60.2 54.7 50.2 49.0 48.9 52.7 54.6 59.2 Moderate 28.1 32.9 35.1 34.3 32.8 31.6 30.0 29.0 29.6 Vigorous 4.7 7.0 10.2 15.5 18.2 19.5 17.2 16.5 11.2 Income (%)3,5 Low 57.8 54.3 57.0 65.6 73.4 78.5 79.4 82.8 80.1 Moderate 39.8 42.7 39.6 31.6 24.4 19.5 17.9 15.7 18.1 High 2.4 3.0 3.4 2.8 2.2 2.1 2.7 1.5 1.8 Education (%)3,5 Low 7.0 9.9 18.6 34.7 48.5 58.5 61.6 62.0 56.7 Moderate 38.6 39.7 40.5 37.0 32.8 28.5 26.6 26.1 28.9
High 54.4 50.5 40.9 28.3 18.7 13.0 11.8 11.9 14.4
1
BMI, body mass index; 2
ANOVA test was used for comparing mean values of continuous variables between groups 3
Pearson chi-square test was used for categorical data 4
mean (SD) (all such values). 5
Table 2. Mortality Rate and Relative Risks of Death in relation to BMI among Men and Women.
Body Mass Index (BMI, kg/m2)
<18.5 18.5-19.9 20-21.9 22-23.9 24-25.9 26-27.9 28-29.9 30-34.9 ≥35
Men
Deaths (no.) 145 196 425 586 506 310 148 71 11
Person-years 21507 38092 92829 133037 118723 68759 29954 16083 2080
Relative risk (95%CI)
Crude1 1.80(1.50-2.17) 1.47(1.24-1.73) 1.26(1.11-1.44) 1.11(0.98-1.25) 1.00 1.03(0.90-1.19) 1.18(0.98-1.42) 1.40(1.09-1.80) 2.48(1.36-4.50) Adjusted2 1.65(1.34-2.04) 1.32(1.09-1.60) 1.15(0.99-1.33) 1.14(0.99-1.30) 1.00 1.01(0.86-1.18) 1.12(0.91-1.38) 1.27(0.95-1.70) 2.37(1.22-4.60) Follow-up period (1990-2007)3 Adjusted2 1.65(1.29-2.10) 1.36(1.10-1.69) 1.10(0.92-1.30) 1.09(0.94-1.27) 1.00 1.00(0.84-1.20) 1.19(0.95-1.50) 1.09(0.76-1.55) 2.08(0.92-4.67) Women Deaths (no.) 90 128 265 332 306 202 117 95 14 Person-years 61448 91146 143926 118733 82357 47488 23422 16989 2698
Relative risk (95%CI)
Crude1 1.50(1.19-1.90) 1.22(0.99-1.50) 1.05(0.89-1.24) 0.99(0.85-1.16) 1.00 1.00(0.84-1.20) 1.16(0.94-1.44) 1.34(1.07-1.69) 1.63(0.96-2.79)
Adjusted2 1.52(1.17-1.99) 1.34(1.06-1.70) 1.18(0.97-1.42) 1.05(0.88-1.26) 1.00 1.03(0.84-1.26) 1.08(0.83-1.39) 1.39(1.07-1.80) 1.65(0.92-2.95)
Follow-up period (1990-2007)3
2
Adjusted 1: adjusted for age, smoking status (current, former, never), alcohol intake, betel nut chewing,
physical activity, income, and education level. 3
Excluded those who died during first 3 years follow-up (only deaths that occurred after more than 3 years of
Legend to Figure 1
Adjusted relative risks of all-cause mortality according to BMI categories among men and women. Relative
risks adjusted for age, smoking status, alcohol intake, betel nut chewing, physical activity, income, and
Figure 1(a)
Legend to Figure 2
Adjusted relative risks of all-cause mortality according to BMI categories by smoking status, age group, and
presence of preexisting chronic diseases. (a) Smoking status was divided into three categories by the
consumption and smoking duration: none, <10 PY, and ≥ 10 PY (PY: pack per day x smoking duration (year)).
The relative risks were adjusted for age, gender, cumulative smoking amount, alcohol intake, betel nut
chewing, income, and education level; (b) age was divided into two categories: <65 years old and ≥ 65 years
old; (c) participants with and without preexisting chronic diseases (previous history of stroke, cardiovascular
disease, liver cirrhosis, chronic renal disease, asthma, or cancers). The relative risks were adjusted for age,