www.elsevier.com / locate / bres
Research report
Dynamic changes of touch- and laser heat-evoked field potentials of
primary somatosensory cortex in awake and pentobarbital-anesthetized
rats
a b b ,
*
Fu-Zen Shaw , Ruei-Feng Chen , Chen-Tung Yen
aInstitute of Neuroscience, Tzu Chi University, Hualien, Taiwan
b
Department of Zoology, National Taiwan University, No. 1, Section 4, Roosevelt Road, Taipei 106, Taiwan Accepted 1 June 2001
Abstract
In this investigation, changes of mechanical- (MEP) and laser-evoked potentials (LEP) in rat primary somatosensory cortex during the course of pentobarbital (PB) anesthesia were examined. Temporal analysis of changes in the magnitude and latency of MEP and LEP, EEG activity, gross motor behaviors, and the tail flick response following laser stimulation before, during, and after PB administration (50 mg / kg, i.p.) was performed and correlated in chronically implanted rats. During the wakeful condition, there were two major cortical components each following mechanical stimulation (MEP1 and MEP2, n517) and laser stimulation (LEP1 and LEP2, n510), respectively. After PB administration, the positive peak in MEP1 was enhanced, and all other components disappeared. These components returned with different time courses. Two hours after PB administration, when the rat had spontaneous movements and flexor reflexes, LEP2 showed reversed polarity. MEP2 returned gradually 3 h after PB administration when the rat regained its ability to execute coordinated movements. After 4 h, LEP1 began to reappear and LEP2 returned to its negative polarity. We found that PB facilitated Ab fiber-related cortical evoked potential (MEP1), while differentially inhibited Ad and C fiber-related components (MEP2, LEP1 and LEP2). Characterization of these anesthesia-induced changes in cortical output may be useful in studying the neural basis of tactile and pain sensations. 2001 Elsevier Science B.V. All rights reserved.
Theme: Sensory systems Topic: Somatosensory cortex
Keywords: Nociception; Pain; C fiber; Ad fiber; Freely moving rat
1. Introduction animal and human lesion (for reviews, see Refs. [23,35]),
and functional imaging studies (for reviews, see Refs.
Early in the 20th century, Head and Holms [19] reported [10,20]). However, the temporal characteristics of
nocicep-that ‘pure cortical lesions cause no increase or decrease of tive processing in the cortex have remained largely
un-sensibility to measured painful stimuli’. It was inferred for known. Several technologies could be used to address this
decades that the cerebral cortex is not involved in human question. Recording cortical electrical activity elicited by
pain processing. Converging clinical and experimental noxious stimuli has a nice temporal resolution in the
evidence has substantially modified this view over the millisecond range. It will be helpful to understand the
years. Several cortical areas, such as the primary (SI) and temporal properties of nociceptive inflow in the cortex.
secondary (SII) somatosensory cortices and the anterior Evoked potentials of SI, which are elicited by innocuous
cingulate cortex, have been confirmed to process the and noxious stimulation, have been described in many
nociceptive inflow as revealed by data from experimental anesthetized animal studies [1,4,22]. In these
investiga-tions, a positive and Ab-fiber related evoked potential (EP) induced by innocuous stimulation is consistently recorded *Corresponding author. Tel.: 0231; fax:
1886-2-2363-on the surface of the SI [1,4,12,22,27,30]. A clear positive
6837.
E-mail address: ctyen@ccms.ntu.edu.tw (C.-T. Yen). and C-fiber related EP responding to noxious laser
stimula-0006-8993 / 01 / $ – see front matter 2001 Elsevier Science B.V. All rights reserved. P I I : S 0 0 0 6 - 8 9 9 3 ( 0 1 ) 0 2 6 8 6 - 5
tion has been demonstrated in halothane-anesthetized rats functioning of the electrodes, evoked potentials were
[22]. It is well known that anesthetics strongly modulate elicited by stimulating the tail of the rat using 0.5-ms
functional properties of cortical neurons duration constant current pulses (Grass model 44). Only
[11,13,15,16,24,31,32,37]. For instance, major differences subjects with identifiable short-latency evoked potentials of
in neuronal firing patterns can be observed between the positive polarity were used in this study. Dental cement
awake and anesthetized condition, especially in long was then applied to fasten the connection module on the
latency evoked responses [11,13,26,29,34,37]. Further- surface of the skull. Finally, animals were injected with
more, a negative cortical component elicited by innocuous antibiotics (Combion-S) and housed individually in cages
mechanical stimulation exists only in awake monkeys for recovery.
[11,12,27]. To avoid these anesthetic effects and to study Three weeks later, animals were placed individually in
the underlying cortical responses following innocuous and clear acrylic chambers, so that the behavior of the rats
noxious stimulation, it is necessary to record cortical could be easily observed. At the top of the chamber, there
activity in the conscious animal. On the other hand, detail was a narrow opening through which the head plug / cable
neurophysiological data can only be obtained in anes- assembly was fed to permit unimpeded access to the skull
thetized condition. Thus it is important to be able to relate implant. To habituate rats to the experimental apparatus,
responses under anesthetized and conscious conditions. each animal was placed in the recording environment at
Recently, the use of short pulse CO laser stimulation2 least five times (2 h / day) prior to testing. On the day of
has been developed for pain research (for reviews, see the recording, a 30-min period was allowed for the rat to
Refs. [3,6]). The heat stimulus selectively activates become familiar with the chamber. Sodium pentobarbital
nociceptive receptors and generates a pure pain sensation, (50 mg / kg) was administered intra-peritoneally. About
which is conveyed through both small myelinated Ad and 100 mechanical and CO -laser stimulation trials were2
unmyelinated C fibers to the cerebral cortex in humans applied to the rat’s tail hourly, before, during, and after
[7,8]. Two major cortical evoked components (LEP1 and pentobarbital administration. Mechanical-evoked cortical
LEP2), following CO -laser stimulation of the tail of2 potential (MEP) and LEP were averaged (see below).
freely moving rats, are also observed [30]. LEP1 and LEP2 Surgical and experimental procedures complied with NIH
are related to Ad and C afferent fiber activation, respec- (USA) recommended procedures for animal use and care
tively [30]. These two specific components elicited by CO2 and were approved by the Experimental Animal
Commit-laser differ greatly from the results obtained from anes- tee of the Tzu Chi University.
thetized animals. For example, LEP1, a component that A blunt probe attached to a coil was used as an
was observed in conscious rats [30], could not be sys- innocuous mechanical stimulator. The probe was displaced
tematically obtained in halothane-anesthetized rats [22]. In by a short current pulse (2 ms) generated by a Grass
addition, a negative C fiber-mediated LEP2 component stimulator. The stimulator was adjusted to induce light
that was found in behaving rats [30] demonstrated positive pressure on the skin (15–20 g). The inter-stimulus interval
polarity under halothane anesthesia [22]. In light of drug- of the mechanical stimulation trial was kept longer than 2
induced changes evident in cortical evoked activity, it is s. In addition, a medical surgical CO2 laser (10.6 mm
important to further characterize changes in stimulus- wavelength, TEM00 mode) was used to excite nociceptors.
evoked components of cortical activity before, during, and The unfocused laser beam (3 mm in diameter) was
after general anesthesia. Correlating temporal alterations of randomly applied to the skin area at the middle portion of
2
somatosensory electrical potentials in response to innocu- the tail (|100 mm ). The laser intensity was 120 mJ (12
ous and noxious stimuli with EEG as well as spontaneous / W, 10 ms). The inter-stimulus interval of the laser
stimula-reflexive behaviors may reveal important functional fea- tion trial was longer than 10 s to minimize sensitization or
tures integral to the central processing of touch and pain. habituation of nociceptors. The hairs in the middle region
of the tail were shaved before the laser experiment. These detailed experimental procedures have been described
2. Materials and methods previously [30,40].
Field potentials from skull electrodes were amplified
Adult male Wistar rats (250–300 g) were anesthetized (4th order band-pass filter: 0.3–1000 Hz, gain550003).
initially with sodium pentobarbital (50 mg / kg, i.p.). Each evoked potential was sampled at 4 kHz with a
Ketamine was administered as necessary to maintain time-locked signal in 1-s segments (4000 data points).
proper anesthetic depth during surgery. The dorsal surface Each evoked potential was selected averaged from the
of the skull was exposed and cleaned. Stainless steel responses of about 100 stimulation trials. Data trials were
screws (O.D.51 mm) were driven bilaterally into the skull rejected from average if they showed a contaminated
overlaying the tail representative area of SI. The mean movement artifact or large baseline drift. Each selected
impedance of these electrodes was 7.5 kV. Reference LEP was filtered with a zero-phase lowpass filter (cut-off
electrodes were implanted 2 mm caudal to lambda. These frequency5200 Hz) before averaging. Another zero-phase
extract the high frequency signal from original LEP, which pattern to a biphasic pattern. The entire data acquisition
correlated with muscle activities induced by tail flick and analysis program was developed on a LabView
and / or nuchal muscle (orientation) as compared with the (National Instrument, Austin, TX) environment [31].
behavior record. In addition, the EEG was monitored and Magnitudes and latencies of MEP1, MEP2, LEP1, and
stored in order to further evaluate the vigilance state of the LEP2, and the ratio and latency of tail flick (TF) elicited
rat before, during, and after the pentobarbital anesthesia. by laser stimulation after anesthesia were compared with
An additional lowpass filter (cut-off frequency570 Hz; 4th variations of those values before anesthesia by one-way
order) was used for filtering out high-frequency noise of repeated measures ANOVA. Multiple comparisons among
the amplified field potential. The sampling frequency for data at different time courses were accomplished using the
the EEG was 250 Hz. EEG data were partitioned into 8-s Student–Newman–Keuls test. After PB administration, the
segments (2000 data points) for calculating the power magnitudes of MEP2, LEP1, and LEP2 were sometimes
spectrum. The power spectrum of the EEG was monitored too small to measure quantitatively during the initial phase
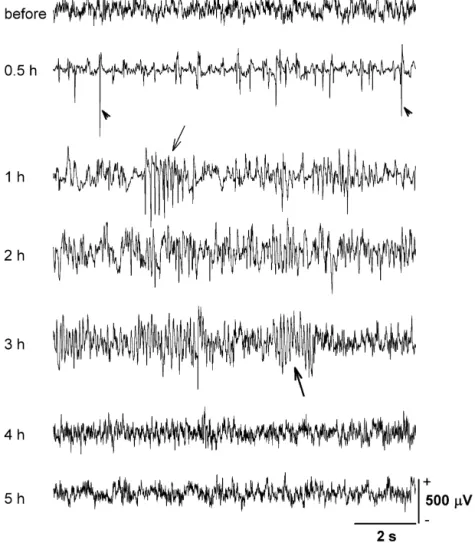
continuously throughout the 5-h period. In general, barbi- of anesthesia (see results). During this low-amplitude
turate spikes / spindles were recorded in PB-anesthetized period, the ceiling scores of the latencies of MEP2, LEP1,
animals [2,33] (Fig. 1). Note that 1 h after PB administra- and LEP2 were modified and set to 300, 300, and 600 ms,
tion (Fig. 1, 3rd trace from top), there were many respectively. Data that appear in figures and in the results
barbiturate spikes and occasionally barbiturate spindles are expressed as mean6S.E.
present, indicating a light anesthetic condition at this time After the completion of the stimulation and recording
[15]. From 1 to 3 h the shapes of the barbiturate spindles experiment, the animal was sacrificed with an overdose of
changed progressively from a predominantly negative sodium pentobarbital. Special attention was given to
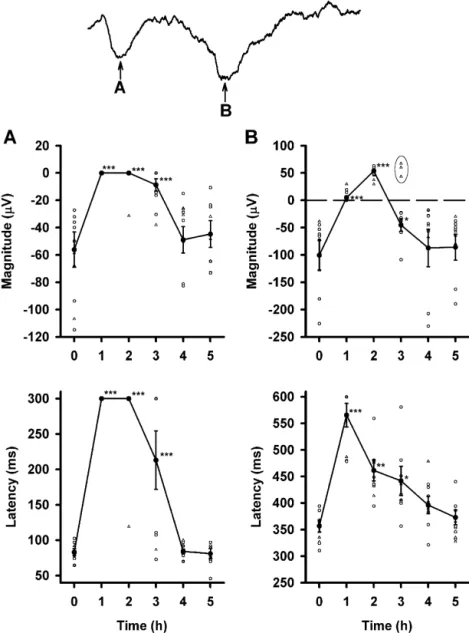
Fig. 1. A representative example of the EEG change in one rat before and after PB administration (50 mg / kg, i.p.). Barbiturate spikes with a dominant negative polarity were present at 0.5 and 1 h after PB injection (arrowhead). Barbiturate spindles with a predominantly negative polarity were seen at 1 h after PB administration (thin arrow). This gradually changed to a biphasic polarity 3 h after PB injection (thick arrow). In this and the following figures, positivity is oriented upwards.
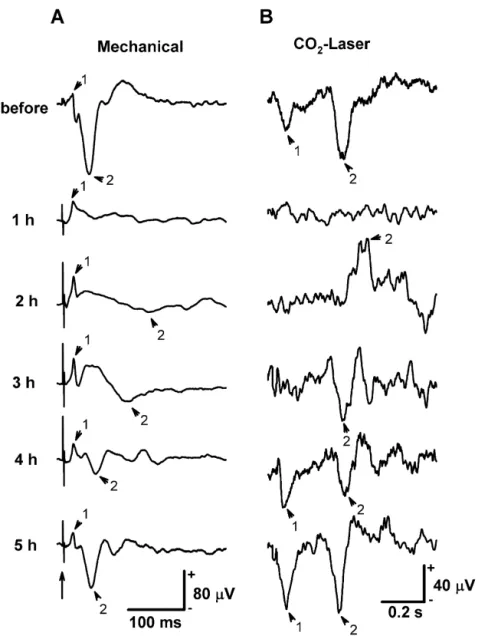
ascertain that the stainless steel screws had not penetrated arrowhead 1) followed by a negative peak (MEP2,
indi-the dura. cated by arrowhead 2) (Fig. 2A). MEP1 maintained the
same polarity throughout the anesthetized condition. The magnitude of MEP1 increased slightly during PB
anes-3. Results thesia. On the other hand, the waveform of MEP2 was
dynamically affected by sodium pentobarbital. It
disap-3.1. Cortical responses to different somatic stimulation peared 1 h after PB administration. A small complex
before, during, and after anesthesia component were seen 2 h after PB administration. The
MEP1 and MEP2 waveform structures began to reappear
A representative example of the evoked cortical 2–3 h after pentobarbital injection. In contrast, following
waveforms to innocuous mechanical and noxious CO -2 laser stimulation, the cortical evoked potential showed two
laser stimulation before, during, and after pentobarbital distinct negative peaks (LEP1 and LEP2) in the awake
anesthesia is shown in Fig. 2. In the awake condition, the condition (Fig. 2B). The LEP1 component could not be
major cortical potentials responding to mechanical stimula- detected between 1 and 3 h after PB administration. The
tion demonstrated a positive peak (MEP1, indicated by initial sign of the LEP1 waveform could be observed 4 h
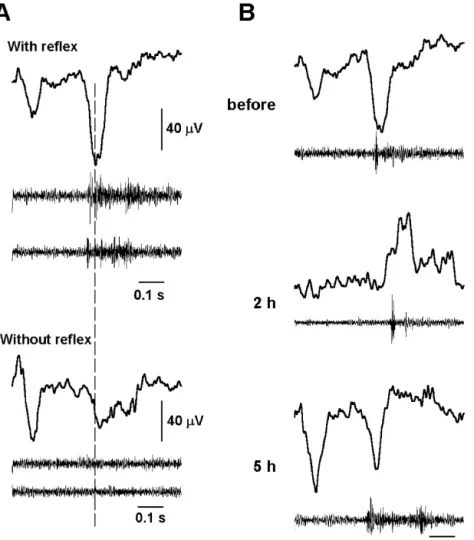
Fig. 2. Examples of MEPs and LEPs recorded over the tail representation of SI. These components were evoked from stimulating the middle portion of the tail before, during, and after PB anesthesia. (A) Mechanical stimulation. The major components of MEP are indicated by arrowheads (1: MEP1; 2: MEP2) in each individual trace. The long arrow indicates the tactile stimulus artifact. (B) Laser heat stimulation. Stimulation pulses (12 W, 10 ms) were given at the beginning of each trace. Arrowheads in each individual trace indicate the major components of LEP. Two distinct negative components (1: LEP1; 2: LEP2) can be seen.
after PB injection. The LEP2 component, however, dis- 3). These data were not included in the statistical analysis.
appeared for only an hour. An interesting finding is that the The magnitude and latency of MEP1 in the control
LEP2 component appeared but with a positive polarity 2 h condition (n513) were 10.561.9 mV and 1760.3 ms,
after PB administration. The polarity of LEP2 then re- respectively. After PB administration, MEP1 could be
turned to a negative orientation 3 h after PB injection. clearly observed in all cases, and the positive polarity of
These findings were repeatedly observed in all animals MEP1 was consistently maintained throughout the entire
tested. recording period. Changes in the averaged magnitude and
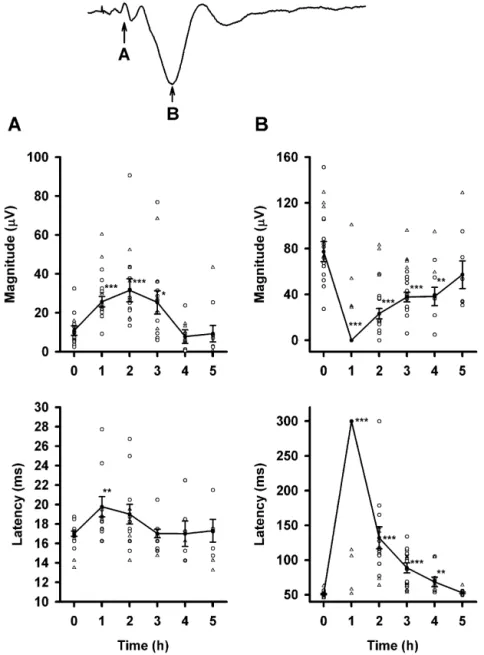
averaged latency of MEP1 before and after PB injection
3.2. Changes of MEP amplitude and latency before, indicated a trend (P,0.001) toward an increased
mag-during, and after anesthesia nitude of MEP1 at 1, 2, and 3 h relative to the wakeful
condition (upper part of Fig. 3A). In addition, there was a
Changes in the magnitude and latency of both MEP1 slight but significant increase in the latency of MEP1 at 1
and MEP2 (n517) are shown in Fig. 3. During PB and 2 h after PB administration (P,0.01).
anesthesia, rebound oscillation of the mechanical-evoked In contrast, the changes in MEP2 after PB injection
potential was observed in four rats (open triangle in Fig. followed a markedly different pattern. The peak value and
Fig. 3. Changes in the amplitude and latency of MEP1 (A) and MEP2 (B) before and after PB administration. Four rats showed rebound oscillations during PB anesthesia (^), and their data were not included in the statistical analysis. Lines connect averaged values (d) from individual data which are represented by open circles. Error bars are the S.E. of the mean. *** P,0.001; ** P,0.01; * P,0.05.
the latency of MEP2 before PB administration were logical states may have contributed to this small collection
27769 mV and 5161 ms, respectively. After PB injection, of deviant responses, data from these three rats were
MEP2 was totally abolished at 1 h. MEP2 began to recover excluded from the following quantitative analysis. The
2 h after PB injection in all but one rat. Changes in the magnitude and latency of LEP1 (n57) during the control
averaged magnitude and averaged latency for MEP2 before condition were 256613 mV and 8365 ms, respectively.
and after PB injection were significant (P,0.001). As Both the magnitude and latency of LEP1 1, 2, and 3 h
compared to the wakeful condition, differences in the peak post-PB injection differed significantly with the wakeful
value and latency of MEP2 were evident at 1, 2, 3, and 4 h condition (P,0.001). The magnitude and latency of LEP2
(Fig. 3B). Detailed values of averaged MEP2 magnitude in the wakeful condition were 2100627 mV and 357611
and latency before and after PB injection are depicted in ms, respectively. Two hours after PB administration, the
Table 1. magnitude and latency of LEP2 were 5363 mV and
461620 ms, respectively. This was a significant (P,
3.3. Changes of LEP amplitude and latency before, 0.001) biphasic trend of change of the LEP2 magnitude. In
during, and after anesthesia addition, the latency of LEP2 showed a significant trend of
increase under PB anesthesia (P,0.001). Detailed values
Changes in the magnitude and latency of both LEP1 and of averaged LEP magnitudes and latencies before and after
LEP2 (n510) are shown in Fig. 4. Relative to MEP, the PB injection are depicted in Table 1.
responses of LEP to PB anesthesia were more complex.
LEP1 was totally abolished at 1 h, and nearly abolished at 3.4. Changes of tail flick and behavior before, during,
2 h with the exception of one rat after PB injection (Fig. and after anesthesia
4A). Even 3 h after PB injection, more than half of the
animals (six of ten rats) had no sign of LEP1. LEP1 was Specific behavioral changes were noted before and after
restored 4 h post-PB injection for the entire experimental PB injection. One hour after PB injection, rats showed no
group. In contrast to the monophasic change of LEP1, the sign of spontaneous motor activity. Two hours after PB,
change of LEP2 with PB anesthesia displayed a biphasic the animals showed evidence of reflexive and spontaneous
pattern (Fig. 4B). One hour after PB injection, the re- behavior, i.e. chewing, climbing, blinking, and sniffing.
sponse of LEP2 was almost eliminated, however, three rats However, their movements were not well coordinated at
showed a positive LEP2 with a small but discernable this time. Rats appeared to move and stand up easily
magnitude. Interestingly, the polarity of LEP2 in all without handicap (well-coordinated) 3 h after PB
adminis-samples was reversed 2 h post-PB injection and appeared tration.
as a positive peak in all animals that were sampled (Fig. The TF reflex elicited by laser stimulation was analyzed
4B). Seven of the ten cases showed LEP2 with negative with the high frequency component picked up from the
polarity (except in three rats) 3 h after PB injection. The cortical stainless steel screw electrode. LEP1 and LEP2
negative LEP2 was totally restored by 4 h after PB were clearly recorded either with or without TF in wakeful
injection. condition (Fig. 5A). The latency of LEP2 lagged to that of
Three rats, which had a positive LEP2 3 h after PB the TF, and the magnitude of LEP2 increased when the rat
injection (encircled open triangles in the upper panel of presented TF behavior (Fig. 5A). Interestingly, similar TF
Fig. 4B), demonstrated a stronger influence by PB anes- reflex were observed while LEP2 polarity reversed during
thesia. To reduce the possibility that a variance in physio- PB anesthesia, especially 2 h after PB injection (Fig. 5B).
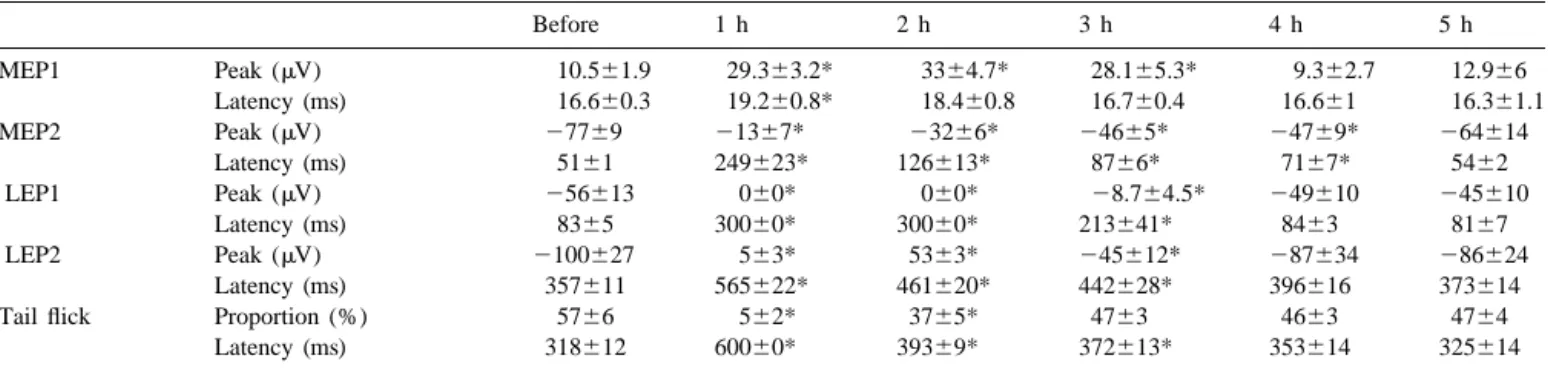
Table 1
Amplitude and latency of mechanical (n513) and laser (n57) evoked potentials and tail flick response to laser stimulation before and after sodium pentobarbital (50 mg / kg, i.p.) Before 1 h 2 h 3 h 4 h 5 h MEP1 Peak (mV) 10.561.9 29.363.2* 3364.7* 28.165.3* 9.362.7 12.966 Latency (ms) 16.660.3 19.260.8* 18.460.8 16.760.4 16.661 16.361.1 MEP2 Peak (mV) 27769 21367* 23266* 24665* 24769* 264614 Latency (ms) 5161 249623* 126613* 8766* 7167* 5462 LEP1 Peak (mV) 256613 060* 060* 28.764.5* 249610 245610 Latency (ms) 8365 30060* 30060* 213641* 8463 8167 LEP2 Peak (mV) 2100627 563* 5363* 245612* 287634 286624 Latency (ms) 357611 565622* 461620* 442628* 396616 373614
Tail flick Proportion (%) 5766 562* 3765* 4763 4663 4764
Latency (ms) 318612 60060* 39369* 372613* 353614 325614
MEP1: mechanical positive peak; MEP2: mechanical negative peak; LEP1: 1st negative laser-evoked peak; LEP2: 2nd negative laser-evoked peak. If the peak could not be identified, the ceiling latencies of MEP2, LEP1, and LEP2 were set to 300, 300, and 600 ms, respectively. Data are mean6S.E. * Indicates value significantly different from control (before) value.
Fig. 4. Changes in the amplitude and latency of LEP1 (A) and LEP2 (B) before and after PB administration. LEP1 was totally abolished 1 h after PB administration, and then gradually returned. The response of LEP1 shows a monophasic change. LEP2 was reversed and peaked in a positive direction 2 h after PB administration in all cases. LEP2 gradually re-established a negative peak. The response of LEP2 shows a biphasic change. Three rats showed a positive polarity 3 h after PB administration (^). Their data were not included in the statistical analysis. Lines connect averaged values (d) from the individual data shown with open circles. Error bars are the S.E. of the mean. *** P,0.001; ** P,0.01; * P,0.05.
Over 50% (5766%) of laser stimulation was accompanied MEP and LEP as well as in behaviors and EEG before and
by a TF response before PB injection. A dramatic decrease after PB treatment are summarized in Table 2.
in TF was observed 1 h (562%) after PB injection (P,0.001). Ratio of TF response restored to normal 3 h after PB injection (Table 1). We selected 20
high-fre-quency muscle responses randomly for the calculation of 4. Discussion
averaged latency to laser stimulation before, during and
after PB administration. The latency of TF reflex during We describe herein dynamic and differential changes of
the wakeful condition by laser stimulation was 318612 mechanical and laser heat evoked potentials recorded over
ms. TF latency increased significantly 1, 2, and 3 h after the cortical area of the SI representing the tail following
PB injection. It returned to comparable control values 4 h pentobarbital administration. These components returned
after. Detailed values of averaged proportion and latency with different time courses, and interesting correlations
of TF to laser stimulation before and after PB administra- were found with respect to the behavior of the rat (Table
Fig. 5. Laser heat-evoked potential and reflexive muscle activity. (A) LEP and muscle activity with / without tail flick (TF) in the wakeful condition. Note that LEP1 and LEP2 are consistently recorded, with or without TF response. The average number of LEP in upper and lower panels is about 50 and 30, respectively. The muscle activity traces are randomly selected single trials. (B) Averaged LEP and reflexive muscle activities before and after PB anesthesia. Note LEP2 latency closely correlated TF latency.
4.1. Mechanical evoked potential
In our previous investigation [30], we suggested that MEP1 is mediated by Ab afferent fibers, MEP2 and LEP1
Table 2
by Ad afferent fibers, and LEP2 by C fibers. Our present
Comparison of MEP, LEP, spontaneous behavior, tail flick response, and
results demonstrate that the Ab-fiber-related MEP1
com-EEG before and after sodium pentobarbital injection (50 mg / kg, i.p.)
ponent maintained a positive polarity, and that the
mag-Before 1 h 2 h 3 h 4 h 5 h
nitude of MEP1 was enhanced during light anesthesia.
MEP1 P P P P P P These results are consistent with those published in other
MEP2 N NP N N N N
studies [1,4,15,16,30]. The exact mechanism by which
LEP1 N NP NP NP N N
barbiturates potentiate MEP1 is unclear. It is well known
LEP2 N NP P N N N
that barbiturates positively modulate the effects of the
Behavior 11 A 1 11 11 11
Tail flick Yes NP SS SS Yes Yes inhibitory transmitter, GABA [41], which is abundant EEG Normal BS BD BD Normal Normal within the cerebral cortex. This will attenuate the sponta-MEP1: mechanical positive peak; MEP2: mechanical negative peak; neous activity of cortical neurons; thereby enhance the
LEP1: 1st negative laser-evoked peak; LEP2: 2nd negative laser-evoked signal to noise ratio of MEP1. Alternatively, barbiturates peak; P: positive polarity; N: negative polarity; NP: not present; A: may block the ascending inhibitory components from the anesthetized; 1: movement not well coordinated; 11: well-coordinated
reticular formation and the end result is an enhanced
movement and behavior (move and stand up easily without handicap);
evoked response during light PB anesthesia condition
SS: significantly suppressed comparing with the awake condition; BS:
In this study, we observed that MEP2 disappeared as LEP2 had been reported previously [30,31]. We present in
rats became anesthetized (1 h after PB injection). MEP2 this report a quantitative analysis of this phenomenon (Fig.
returned with a time course similar to the outward behavior 4B) and its relationship with the reflexive muscle activities
of the rat, such that at 2 h when the rat moved about (Fig. 5). In contrast to the very sensitive LEP1, LEP2 can
staggeringly, traces of MEP2 was observed; and at 3 h be recorded under light anesthesia [22]. Anesthesia,
how-when the rat regained its pose, MEP2 could be consistently ever, causes a longer-lasting change of the LEP2 than
recorded. Several reports also indicate that a long latency previously known. Thus, LEP2 showed a reversed polarity
negative component (comparable to the MEP2 here) eli- under light anesthesia (1 h after), when the rat was able to
cited by innocuous mechanical stimulation can be clearly walk about (2 h after), and also in a few rats with
recorded in wakeful humans [39], monkeys [12,27], and well-coordinated behavior 3 h after (encircled three rats in
rats [30]. In addition, this negative component is Fig. 4B). It was 4 h after a single PB injection that the
abolished / attenuated during sleep in humans [39] and LEP2 returned to its control level.
monkeys [12]. These observations are consistent with the Three hours after a single dose of PB, there remained in
hypothesis that MEP2 is a behaviorally related cortical the central nervous system significant drug effect even the
component [11]. rat showed no apparent behavior handicap. This longer
than expected PB effect has an immediate practical
conse-4.2. Laser heat evoked potential quence. Many behavioral and neurophysiological studies
use chronically instrumented rats. If the tettered recording
Our recent study [30] has shown that MEP2 and LEP1 line should be connected with the aid of a premedication,
have similar waveforms with negative polarity that are then there should be an ample waiting period for the drug
probably mediated by Ad afferent fibers. However, there effect (especially anesthetics) to wear off completely.
are several interesting differences. First, the latencies of Results of this report indicate that an hour more than the
MEP2 and LEP1 during the wakeful condition differ, return of the apparent normal gaits and locomotion will be
being 5161 and 8365 ms, respectively. Thermal conduc- wise. Also, there seems to be a curious dissociation of
tive time from surface to receptor level of the skin by laser behavior and central nociceptive processing such that at 3
stimuli has been estimated to be 30–60 ms [7,17]. This h after PB injection, the rats had regained coordinated
might account for the latency difference. Another possi- behavior but the EPs and tail flick response were still
bility is that MEP2 represents polysynaptic activation of abnormal. The remaining central drug effect is evident
Ab fiber from the mid-tail, thereby arriving the SI earlier only with the aid of EP and muscle activity monitoring.
than LEP1. Second, over the cortical surface, the MEP2 Therefore, it seems likely that if more refined motor tasks
component is concentrated in the SI [30] and is primarily were used, some handicaps might have been detected.
associated with superficial neuronal activity [12,27,30]. In In other reports related to C-fiber-related cortical
re-contrast, LEP1 is small and confined to the SI in its initial sponses, Kalliomaki et al. [22] also described a positive
positive phase, but becomes more widespread within the polarity C-fiber component evoked by laser heat
stimula-sensory-motor region during the larger negative phase tion in halothane anesthetized rats. This reversal of polarity
[30]. Also, LEP1 is associated with multi-layer cortical has also been observed by Shyu et al. [34]. This group
activity [30]. The multi-layered distribution of intra-corti- found that the superficial cortical evoked potential
re-cal neuronal activity as well as the more diffusely distrib- sponded to central lateral nucleus stimulation changes from
uted topographic mapping of LEP1 resembles activity negative to positive polarity after PB administration. Thus,
observed following tooth-pulp stimulation, which primarily it seems that during the wakeful condition, C fiber
activates nociceptive Ad afferent inputs [14,28]. Lastly, we activation evokes a widespread, superficial layer dominant
further demonstrate in this study that both MEP2 and component in the cerebral cortex. This superficial cortical
LEP1 are profoundly affected by PB anesthesia but with component is strongly affected by anesthetics [11,37,38],
different time courses of recovery. Among these cortical and is thereby differentially suppressed under light
anes-EPs, LEP1 is most sensitive to anesthesia. 2 h after PB thesia. LEP2 changes to positive because at this point,
injection, LEP1 could be detected in one of seven rats. neurons in the deeper cortical layers are still activated [22].
Even 3 h after, LEP1 was only barely detectable in most of Short-pulse noxious CO -laser radiation has been dem-2
the rats tested (Fig. 4A). In contrast, MEP2 had begun to onstrated to be capable of activating both Ad and C
return an hour previously (Fig. 2A). The return time course nociceptive afferent fibers in rats [17,18] and humans [7].
of the LEP1 paralleled that of the tail flick response more Both Ad and C fiber-related cortical components can be
closely than MEP2. Based on these observations, we elicited by laser stimulation in awake rats. Cortical
re-postulate that LEP1 has more functional characteristics sponses to laser stimulation in conscious humans differ
than does MEP2. Like MEP2, LEP1 may be related to from those recorded in awake rats. Although CO2 laser
consciousness, but it may play a further role in processing stimulus is able to activate two different kinds of
nocicep-the nociceptive inflow. tive peripheral fibers, only the Ad fiber-related component
fiber-related cortical component can be demonstrated in details are known, it may be possible to use LEPs as
healthy subjects with special treatment, such as pressure indices of central pain processing.
block process [9], minute localized skin stimulation [5], In this study, we used two specific stimuli to evaluate
specially designed temperature stimulation [25], or in functional changes in brain activity influenced by PB. The
patients with neurological disorders [6,36]. Even under first was an innocuous mechanical stimulus and the second
these situations, only one cortical response, either Ad or C, was a noxious thermal stimulus. We described dynamic
could be evoked by laser stimulation in humans. The changes of tactile- and thermal nociceptive-evoked
po-mechanism for these differential laser-evoked cortical tentials in rat cortex during barbiturate anesthesia. Subtle
responses between humans and rats is unclear. It may correlations exist between these changes and reflexive and
originate from a dissimilar modulation in spino-thalamo- spontaneous behaviors of the rat. We conclude that PB
cortical pathways. The rat may provide a model system to strongly modifies various components of MEP and LEP.
study the cortical function from both Ad and C nociceptive Changes in these components may provide a good model
inputs at the same time. The dissociation of MEPs and system for the study of the neural basis of tactile and pain
LEPs during anesthesia indicates that separate central sensations.
pathways might be subserving the processing of mechani-cal Ad, thermal heat Ad, and thermal heat C inputs in the rat.
Acknowledgements
We thank Professor R.C.S. Lin and Dr K.M. Simpson, 4.3. Tail flick and LEP
University of Mississippi Medical Center, USA, for their helpful comments. The present study was supported by a The high frequency component (200–1000 Hz) of the
Cognitive Center grant from the Academia Sinica and electrical signal recorded from the cortical electrode (a
grants 2314-B320-008-M08 to FZS and NSC89-stainless steel screw 1 mm in diameter) was used to
2311-B002-039 to CTY from the National Science Council represent the jerky reflexive muscle activities evoked by
of Republic of China. laser irradiation. From our experience, this is a good index
of the tail flick of the rat. Because with the moderate laser intensity used (10 ms, 12 W), tail flicks were elicited about
References
50% of the time (Table 1). All rats had been tamed to the procedure. Under this condition, tail flick was usually the
[1] T. Allison, A.L. Hume, A comparative analysis of short-latency
only observable movement. The large high frequency
somatosensory evoked potentials in man, monkey, cat, and rat, Exp.
signals recorded (such as illustrated in Fig. 5) were
Neurol. 72 (1981) 592–611.
unlikely to be originated inside the cortex because in no
[2] P. Andersen, S.A. Andersson, Physiological Basis of the Alpha
case was the dura penetrated (see Section 2). Rhythm, Appleton-Century-Crofts, New York, 1968.
Based on the assumption that these high frequency [3] L. Arendt-Nielsen, Characteristics, detection, and modulation of
laser-evoked vertex potentials, Acta Anaesthesiol. Scand. 38 (Suppl.
spikes were originated from the tail flick muscles, another
98) (1994) 1–44.
question arises. Since LEP2 latency, amplitude and
dura-[4] J.C. Arezzo, H.G. Vaughan Jr., A.D. Legatt, Topography and
tion related closely to tail flick responses (Fig. 5, Table 1),
intracranial source of somatosensory evoked potentials in the
could it be that LEP2 might have been a far-field potential monkey. II. Cortical components, Electroencephalogr. Clin.
Neuro-originated from distant muscles? We think this is not the physiol. 28 (1981) 1–18.
case and LEP2 has a near-field cortical origin based on the [5] D. Bragard, A.C.N. Chen, L. Plaghki, Direct isolation of ultra-late (C-fibre) evoked brain potentials by CO laser stimulation of tiny
following evidences. First, with or without tail flick, LEP2 2
cutaneous surface areas in man, Neurosci. Lett. 209 (1996) 81–84.
could be recorded (Fig. 5A). Second, if LEP2 is indeed a
[6] B. Bromm, J. Lorenz, Neurophysiological evaluation of pain,
far-field potential, it should not change its polarity under Electroencephalogr. Clin. Neurophysiol. 107 (1998) 227–253. anesthesia since the same tail was flicking. Third, in a [7] B. Bromm, R.-D. Treede, Nerve fibre discharges, cerebral potentials
previous report [30], we made multi-channel intra-cortical and sensations induced by CO laser stimulation, Hum. Neurobiol. 32
(1984) 33–40.
recording in several cortical laminae. Clear neuronal
[8] B. Bromm, R.-D. Treede, Pain related cerebral potentials: late and
responses were observed at LEP2 latency after laser heat
ultralate components, Int. J. Neurosci. 33 (1987) 15–23.
stimulation of the mid-tail. Similar experiment was per- [9] B. Bromm, H. Neitzel, A. Tecklenburg, R.-D. Treede, Evoked
formed by Kalliomaki et al. [22]. They reached the same cerebral potential correlates of C fibre activity in man, Neurosci.
conclusion that C-fiber related LEP was cortical in origin. Lett. 43 (1983) 109–114.
[10] K.L. Casey, Forebrain mechanisms of nociception and pain: analysis
Tail flick response, including its latency and amplitude,
through imaging, Proc. Natl. Acad. Sci. USA 96 (1999) 7668–7674.
has been used routinely as an index of pain sensitivity.
[11] L.J. Cauller, Layer I of primary sensory neocortex: where top-down
Considering pain sensitivity changes dynamically, it is converges upon bottom-up, Behav. Brain Res. 71 (1995) 163–170.
reasonable that LEP2 latency and amplitude should corre- [12] L.J. Cauller, A.T. Kulics, A comparison of awake and sleeping
postcentral area 1 in rhesus monkey, Exp. Brain Res. 72 (1988) neous activity and response to cutaneous innocuous and noxious
584–592. stimulations, Pain 60 (1995) 303–310.
[13] J.K. Chapin, D.J. Waterhouse, D.J. Woodward, Differences in [27] N.N. Peterson, C.E. Schroeder, J.C. Arezzo, Neural generators of cutaneous sensory response properties of single somatosensory early cortical somatosensory evoked potentials in the awake mon-cortical neurons in awake and halothane anesthetized rats, Brain key, Electroencephalogr. Clin. Neurophysiol. 96 (1995) 248–260. Res. Bull. 6 (1981) 63–70. [28] A. Roos, B. Rydenhag, S.A. Andersson, Cortical responses evoked [14] E.H. Chudler, W.K. Dong, Y. Kawakami, Tooth pulp-evoked po- by tooth pulp stimulation in the cat. Surface and intracortical
tentials in the monkey: cortical surface and intracortical distribution, responses, Pain 14 (1982) 247–265.
Pain 22 (1985) 221–233. [29] P.S. Sebel, C.P. Heneghan, D.A. Ingram, Evoked responses — a [15] D.L. Clark, B.S. Rosner, Neurophysiological effects of general neurophysiological indicator of depth of anesthesia?, Br. J. Anaesth.
anesthetics. I. The electroencephalogram and sensory evoked re- 57 (1985) 841–842.
sponses in man, Anesthesiology 38 (1973) 564–582. [30] F.-Z. Shaw, R.-F. Chen, H.-W. Tsao, C.-T. Yen, Comparison of [16] N. Dafny, Neurophysiological approach as a tool to study the effects touch- and laser heat-evoked cortical field potentials in conscious
of drugs on the central nervous system: dose effect of pentobarbital, rats, Brain Res. 824 (1999) 183–196.
Exp. Neurol. 59 (1978) 263–274. [31] F.-Z. Shaw, R.-F. Chen, H.-W. Tsao, C.-T. Yen, A multichannel [17] P.J. Danneman, J.A. Kiritsy-Roy, T.J. Morrow, K.L. Casey, Central system for recording and analysis of cortical field potentials in freely
delay of the laser-activated rat tail-flick reflex, Pain 58 (1994) moving rats, J. Neurosci. Methods 88 (1999) 33–43.
39–44. [32] Y. Shigenaga, R. Inoki, Effects of morphine and barbiturate on the [18] M. Devor, A. Carmon, R. Frostig, Primary afferent and spinal SI and SII potentials evoked by tooth pulp stimulation of rats, Eur. J.
sensory neurons that respond to brief pulses of intense infrared laser Pharmacol. 36 (1976) 347–353.
radiation: a preliminary survey in rats, Exp. Neurol. 76 (1982) [33] M. Steriade, E.G. Jones, D.A. McCormick, Thalamus, Organization
483–494. and Function, Vol. 1, Elsevier, New York, 1997.
[19] H. Head, G. Holms, Sensory disturbances from cerebral lesions, [34] B.C. Shyu, B. Olausson, B. Rydenhag, Field potential analysis of the Brain 34 (1911) 102–254. cortical projection of the central lateral nucleus in the cat, Acta [20] M. Ingvar, J.-C. Hsieh, The image of pain, in: R.D. Wall, R. Welzack Physiol. Scand. 137 (1989) 503–512.
(Eds.), Textbook of Pain, Churchill Livingstone, New York, 1999, [35] R.-D. Treede, D.R. Kenshalo, R.H. Gracely, A.K.P. Jones, The pp. 215–233. cortical representation of pain, Pain 79 (1999) 105–111.
[21] R. Kakigi, C. Endo, R. Neshige, Y. Kuroda, H. Shibasaki, Estimation [36] R.-D. Treede, J. Lankers, A. Frieling, W.H. Zangemeister, K. Kunze, of conduction velocity of Ad fibers in humans, Muscle Nerve 14 B. Bromm, Cerebral potentials evoked by painful laser stimuli in (1991) 1193–1196. patients with syringomyelia, Brain 114 (1991) 1595–1607. [22] J. Kalliomaki, H.-R. Weng, H.-J. Nilsson, J. Schouenborg, Nocicep- [37] B.A. Vogt, The role of layer I in cortical function, in: A. Peter, E.G.
tive C fiber input to the primary somatosensory cortex (SI). A field Jones (Eds.), Cerebral Cortex, Normal and Alerted States of potential study in the rat, Brain Res. 622 (1993) 262–270. Function, Vol. 9, Plenum Press, New York, 1991, pp. 49–80. [23] D.R. Kenshalo, W.D. Willis, The role of cerebral cortex in pain [38] W.D. Willis, The Pain System, Karger, New York, 1985.
system, in: A. Peter, E.G. Jones (Eds.), Cerebral Cortex: Normal and [39] T. Yamada, S. Kameyama, Y. Fuchigami, Y. Nakazumi, Q.S. Altered States of Function, Vol. 9, Plenum Press, New York, 1991, Dickins, J. Kimura, Changes of short latency latency somatosensory pp. 153–212. evoked potential in sleep, Electroencephalogr. Clin. Neurophysiol. [24] E. Kochs, R.-D. Treede, J. Schulte am Esch, B. Bromm, Modulation 70 (1988) 126–136.
of pain-related somatosensory evoked potentials by general anes- [40] C.-T. Yen, C.-H. Huang, S.-E. Fu, Surface temperature change, thesia, Anesth. Analg. 71 (1990) 225–230. cortical evoked potential and pain behavior elicited by CO lasers,2
[25] W. Magerl, Z. Ali, J. Ellrich, R.A. Meyer, R.-D. Treede, C- and Chin. J. Physiol. 37 (1994) 193–199.
Ad-fiber components of heat-evoked cerebral potentials in healthy [41] S.A. Zimmerman, M.V. Jones, N.L. Harrison, Potentiation of g-2
human subjects, Pain 82 (1999) 127–137. aminobutyric acidA receptor Cl current correlates with in vivo [26] J. Montagne-Clavel, J.-L. Oliveras, G. Martin, Single-unit record- anesthetic potency, J. Pharmacol. Exp. Ther. 270 (1994) 987–991.