© 1993 Elsevier Science Publishers B.V. All rights reserved 0165-0270/93/$06.00
NSM 01447
Effect of conduction distance on amplitude and area
of compound action potentials of A fiber and C fiber
F.-S. J a w 1, H . - W . T s a o 2, H.J. Y u 2 a n d C.-T. Y e n 3
Center for Biomedical Engineering, 2 Department of Electrical Engineering and 3 Department of Zoology, National Taiwan Unit,ersity, Taipei 10764 (Taiwan)
(Received 24 February 1992) (Revised version received 17 August 1992)
(Accepted 7 October 1992)
Key words: Compound action potential; A fiber; C fiber; Dorsal root; (Rat)
We used 24 sacral dorsal roots of the rat to analyze amplitude and area changes of biphasic and monophasic compound action potentials (CAPs) at 4 conduction distances. Both the CAPs of the A-fiber and C-fiber were analyzed. The changes were examined with the paired t test and linear regression. All the variables decreased linearly with increasing conduction distance except area of monophasic CAP, which remained constant throughout. CAP data were also compared between the S1 and $2 roots by using the pooled t test. Only area of monophasic CAP showed good correspondence with the anatomical data. Therefore, area of monophasic CAP is suggested as the best parameter for representing the functional state of a nerve.
Introduction
Since the works of Erlanger and Gasser (1924, 1927, 1930), the recording of compound action potential (CAP) has played an important role in the diagnosis of peripheral neuropathies (Favaro et al., 1988) in the correlative studies with the fiber spectrum of a nerve (Landau et al., 1968), in the experiments of anodal block (Casey and Blick, 1969; Jaw et al., 1991a), and in the studies of neuronal activity (Schouenborg and Dickenson, 1988) and field potential (Dong et al., 1982) in the central nervous system. However, the best characteristic parameter of CAP for representing the morphological (or functional) characteristics of a nerve remains uncertain. It is essential to
Correspondence: Dr. Chen-Tung Yen, Department of Zool- ogy, National Taiwan University, Taipei, Taiwan 10764. Tel.: (02) 363-0231, ext. 3322; FAX: (02) 363-6837.
find out the characteristic parameter of CAP before analyzing CAP quantitatively.
For convenience, peak amplitude of CAP is usually used for analysis. Peak amplitude of CAP, however, changes as conduction distance changes (Olney et al., 1987). Furthermore, the peak am- plitude of the CAP of the A fiber (ACAP) is almost a hundred times larger than that of the C fiber in the sensory nerves of the vertebrate (Erlanger and Gasser, 1930) although there are more C fibers in these nerves (Langford and Coggeshall, 1979). Hence, to quantify CAP, we need to select a characteristic parameter that is independent of conduction distance and can re- flect the morphological characteristics of a nerve. In this investigation, isolated sacral dorsal roots of the rat were used because they have little connective tissue. Moreover, there is no taper in these roots (Langford and Coggeshall, 1979), i.e., the diameter of the individual axon remains con- stant throughout the length, a prerequisite of the study. Four kinds of variables of CAP were ana-
lyzed to select the characteristic parameter. Both CAPs of A fiber and of C fiber (CCAPs) were analyzed. Area of monophasic CAP was con- cluded as the characteristic parameter.
Materials and methods
Ten adult Wistar rats were used. The animal preparation and the recording setup were the same as our previous paper (Jaw et al., 1991b).
Electrodes
An isolated piece of the dorsal roots of the sacral cord was mounted on a multilead hook electrode made from stainless steel (Fig. 1). Two leads of the electrode were used for stimulation, a lead was connected to the ground, and 4 pairs of leads (the R1, R2, R3 and R4) were used for recording. To use the paired t test, we matched all the variables at the R1 and R4 electrodes (the same distance between the active and reference electrodes and the same recording system).
CAP recording
To obtain the CAPs at different conduction distances, the recording amplifier was connected first to the R4, next to R3, third to R2 and last to Rt. For the recording of monophasic CAP, the roots were crushed between the recording leads after all the biphasic CAPs had been recorded. A total of 12 dorsal roots (4 S1, 4 $2, 2 $3 and 2 $4) were used for the recording of the ACAPs and other 12 dorsal roots (4 S1, 3 $2, 3 $3 and 1 $4) for the CCAPs.
Stimulation
Usually, a single 200/~s constant current pulse with an intensity range from 100 to 150 # A was used for the elicitation of the maximal CCAP and an intensity of about 50 tzA for the CAP of threshold stimulation for C fiber. T h e stimulation for the maximal ACAP was a 20/~s current pulse with an intensity of about 5 IzA.
Data processing
The baselines of the CCAPs are usually curvy and wandering due to either the much larger
R4 Its R2 R1 /
S
_ _ 1 6.9ram 12.4 7.8 3.7fsT
I/
./
,./
./
j t
./ / .
_L
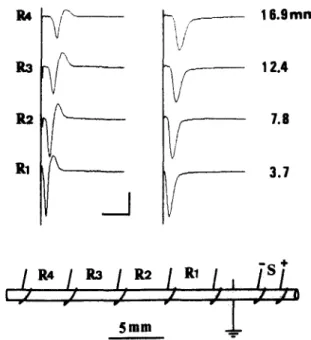
5 a m . -Fig. 1. This is a representative recording of t h e A C A P s . T h e
multi-lead hook electrode (shown in the lower portion) was calibrated u n d e r the microscope at a magnification of 6. T h e symbol S represents the stimulation electrode and R I to R4 the recording electrodes. T h e conduction distances of the C A P s were m e a s u r e d from the negative stimulation lead to the positive recording leads that were at the proximal ends of the R I , R2, R3 and R4 electrodes with respect to the stimula- tion electrode. T h e biphasic (left) and monophasic (right) A C A P s of a SI dorsal root are shown with their recording electrodes on the far left and their conduction distances on the far right. All traces are lined up with the o n s e t of stimulation (the vertical lines). Calibration bars: vertical 21
mV; horizontal 1.9 ms.
ACAPs or the stimulation artifact. T o correct this artifact, we subtracted the threshold CCAP from the supramaximal CCAP (Jaw et al., 1991b).
The amplitude and integrated area of the ACAPs and CCAPs at the R1, R2, R3 and R4 were calculated after recording by utilizing a pro- gram (Jaw et al., 1991b). T h e peak,to-peak ampli- tude of the biphasic CAPs and the peak-to-base- line amplitude of monophasic CAP were used. The area of the biphasic CAPs was obtained by adding the area of the positive and negative phases.
Since the absolute values of the amplitude and area of the CAPs of different roots vary, to avoid bias toward roots with larger amplitude or area in
statistical analysis, the amplitude and area of a root were normalized to its maximal value among the R1, R2, R3, and R4 recordings.
Statistical analysis
The variables between the longest and shortest conduction distances were examined by using the paired t test. For those variables that were af- fected by conduction distance, regression lines were calculated. The slopes of the regression lines of the A C A P s were compared, by visual inspection, with those of the CCAPs to see which group of fibers was more affected by the conduc- tion distance. Finally, the amplitude and area of the CAPs of the S1 roots were compared with those of the $2 by using the pooled t test. The results of the test were compared with the anatomical results of the S1 and $2 roots of the rat.
Results
Recording examples
A representative recording of A C A P s is shown in Fig. 1. The longer the conduction distance the smaller the peak amplitude and the wider the duration became. Fig. 2 shows the CCAPs of another S1 root. Likewise, the amplitude of the
P ~
R1 I/N~
_..]
b
~ ' ~ ! 6.gram
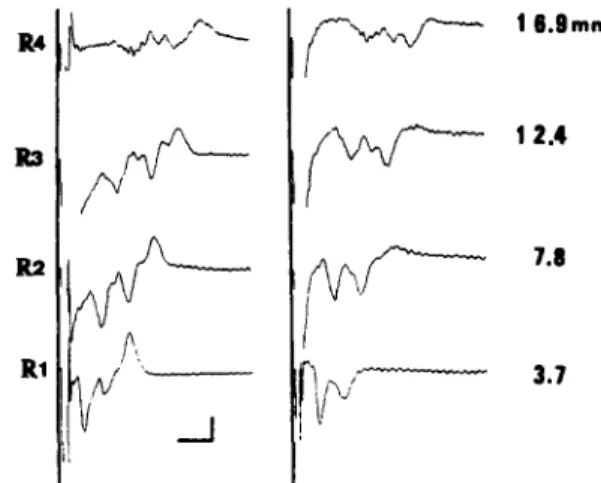
Fig. 2. The monophasic and biphasic CCAPs of another S1 dorsal root. All conventions are the same as in Fig. 1. Calibra- tion: the vertical bar represents 0.2 mV and the horizontal
bar 8 ms.
CCAPs gradually decreased and the duration in- creased with increasing conduction distance. In these examples, the amplitude of the monophasic A C A P s at the R3 recording was 140 times larger than the corresponding CCAPs; the area of the monophasic ACAPs, however, was only 5 times larger than that of the CCAPs.
Changes of the variables
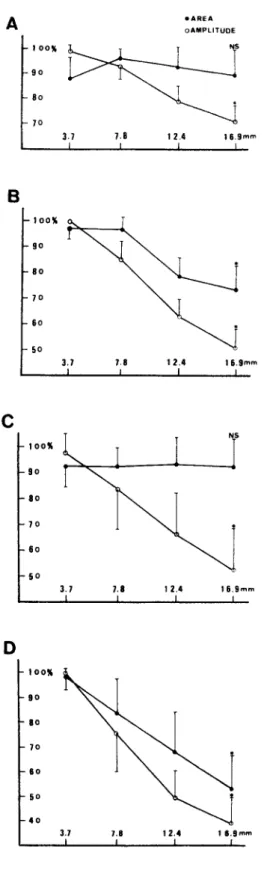
In Fig. 3, the means and standard deviations of the normalized amplitude and area of the A C A P s from 12 roots and those of the CCAPs from other 12 roots are plotted against conduction distance. The area of the monophasic A C A P s and that of the CCAPs showed no significant difference be- tween the R1 and R4 recordings. On the other hand, all the other variables decreased monotoni- cally with increased conduction distance.
Regression lines of the variables
The data plotted in Fig. 3 showed a linear relationship between the means of the variables and the conduction distance. Therefore, linear regression of the variables that changed with con- duction distance was calculated:
amplitude of monophasic ACAPs: Y = 1[)7.7- 2.2 *X area of biphasic ACAPs: Y = 106.7-2.0*X amplitude of biphasic ACAPs: Y = 113.7- 3.8 * X amplitude of monophasic CCAPs: Y - 11().1-3.4"X area of biphasic CCAPs: Y = 110.7-3.4"X amplitude of biphasic CCAPs: Y 113.7 4.7"X where Y is the normalized amplitude or area of the A C A P s or CCAPs and X is the conduction distance.
Comparison between the S1 and $2 roots
To correlate our electrophysiological data with the anatomical results, all the variables of the SI roots were compared with the corresponding vari- ables of the $2 roots. From the R 1 - R 4 elec- trodes, there was no significant difference be- tween all the variables of the A C A P s of the S1 roots and those of the $2 roots. In comparison, the area of the monophasic CCAPs of the S1 roots was significantly larger than that of the $2 roots at all conduction distances ( P < 0.01). The monophasic and biphasic amplitude of the CCAPs showed significant difference ( P < 0.01) only at the R1 recording (the shortest conduction dis-
A
• A R E A oAMPLITUDE I o o % 9 0 - 8 0 7o 3.7 7.8 12.4 1§.gmm I i I IB
loo% 90 8 0 - 7 0 - 6 0 - 5 0 3.7 7.8 I 2.4 I §.9ram i l i iC
1 oo~ _~ 90[
- 8 0 - 7 0 - 6 0 - 5 0 3.7 7.8 I 2.4 1 6 . 9 r a m I I J ID
I o o % 90 80 70 6 0 5o 4 0 3.7 7.8 12.4 1 6.gram i i I Itance). The biphasic area of the CCAPs showed no significant difference at all the recordings.
Discussion
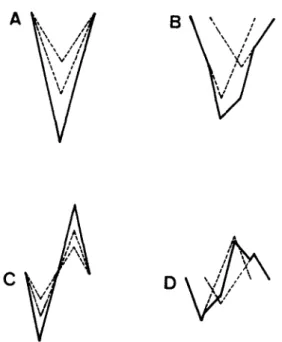
To explain these findings, simulated CAPs composed of only 2 action potentials are shown in Fig. 4. For simplicity, triangular waves are used to represent the action potentials. Both action po- tentials have the same duration (Gasser and Er- langer, 1927) and start at the negative lead of the stimulation electrode as shown in Fig. 4A and C. As these 2 action potentials propagate, they begin to separate (Fig. 4B and D). From this model, the area of monophasic CAP does not change with conduction distance; the decrease in amplitude of monophasic CAP is due to temporal dispersion of the peaks of the individual action potential whereas the decrease in area of biphasic CAP is caused by phase cancellation between these 2 action potentials (Olney et al., 1987); amplitude change of biphasic CAP is the combination of these two factors. Our data agree very well with all these predications.
Phase cancellation and temporal dispersion of CAP depend on the variation (instead of the range) in conduction velocities of the constituent fibers. The slopes of these regression lines should reflect these variations. From our data, the C fiber of the sacral dorsal roots might have a larger variation in conduction velocity than the A fiber.
Langford and Coggeshall (1979) show that the number of the C fiber in the S1 dorsal root is larger than the $2; in contrast, there is no signifi- cant difference in the number of the A fiber between the S1 and $2 roots. Our data showed that only area of monophasic CAP agreed to this result.
Fig. 3. The means of the normalized amplitude (open circles) and area (dots) of the CAPs are plotted against conduction distance. The vertical bars represent standard deviations. A: monophasic ACAPs. B: biphasic ACAPs: C: monophasic CCAPs. D: biphasic CCAPs. The sample size is 12. The
V
C , ,
A
D ' / , "
Fig. 4. Simulated CAPs compose of action potentials from 2 axons with different conduction velocities. (A) and (C) are the monophasic and biphasic recordings at the position of stimu- lation, respectively. (B) and (D) are the monophasic and biphasic recordings some distance away. Dotted lines are the 2 individual action potentials and the thick lines are the CAP.
The main purpose of the present study was to select a characteristic parameter of CAP that is independent of the recording position and can be used to represent the functional state of a nerve. We concluded that area of the monophasic CAPs (of A fiber and of C fiber) should be the best parameter for quantitative purpose.
Acknowledgements
This work was supported by grants NSC81- 0404-E002-13 and NSC81-0211-B002-16 from the National Science Council of the Republic of China.
References
Casey, K.L.and Blick, M. (1969) Observations on anodal po- larization of cutaneous nerve, Brain Res., 13: 155-167. Dong, W.K., Harkins, S.W. and Ashleman, B.T. (1082) Ori-
gins of cat somatosensory far-field and early near-field evoked potentials, Electroenceph. clin. Neurophysiol., 53:
143-165.
Erlanger, J. and Gasser, H.S. (1924) The compound nature of the action current of nerve as disclosed by the cathode ray oscillograph, Am. J. Physiol., 70: 624-666.
Erlanger, J. and Gasser, H.S. (1930) The action potential in fibers of slow conduction in spinal roots and somatic nerves, Am. J. Physiol., 92: 43-82.
Favaro, G., Gregorio, F.D., Panozzo, C. and Fiori, M.G. (1988) Ganglioside treatment of vincristine-induced neu- ropathy: an electrophysiologic study, Toxicology, 49: 325- 329.
Gasser, H.S. and Erlanger, J. (1927) The role played by the sizes of the constituent fibers of a nerve trunk in determin- ing the form of its action potential wave, Am. J. Physiol., 80: 522-547.
Jaw, F.-S., Yen, C.T., Tsao, H.W. and Yu, H.J. (1991a) A modified 'triangular pulse' stimulator for C fiber stimula- tion, J. Neurosci. Methods, 37: 169-172.
Jaw, F.-S., Yu, S.-N., Lee, J.-C., Tsao, H.-W., Yu, H.J. and Yen, C.-T. (1991b) Interactive program for spectral and area analysis of compound action potentials of A fiber and C fiber, J. Neurosci. Methods, 40: 121-126.
Landau, W.M., Clare, M.H. and Bishop, G.H. (1968) Recon- struction of Myelinated nerve tract action potentials: an arithmetic method, Exp. Neurol., 22: 480-490.
Langford, L.A. and Coggeshall, R.E. (1979) Branching of sensory axons in the dorsal root and evidence for the absence of dorsal root efferent fibers, J. Comp. Neurol.. 184: 193-204.
Olney, R.K., Budingen, H.J. and Miller, R.G. (1987) The effect of temporal dispersion on compound action poten- tial area in human peripheral nerve, Muscle Nerve, 10: 728-733.
Schouenborg, J. and Dickenson, A. (1988) Long-lasting neu- ronal activity in rat dorsal horn evoked by impulses in cutaneous C fibres during noxious mechanical stimulation. Brain Res., 439: 56-63.