國 立 交 通 大 學
生 物 資 訊 研 究 所
碩士論文
自艾菲矩陣公司表現序列晶片計算信息核糖核酸同
型體的表現量的新方法
A new method for determining isoform expression of the Affymetrix
GeneChip®Exon Array
研 究 生:邢恆嘉
自艾菲矩陣公司表現序列晶片計算信息核糖核酸同型體的
表現量的新方法
A new method for determining isoform expression of the
Affymetrix GeneChip®Exon Array
研 究 生:邢恆嘉 Student:Heng-Chia Hsin 指導教授:黃憲達 博士 Advisor:Dr. Hsien-Da Huang
國立交通大學 生物資訊研究所
碩士論文
A Thesis
Submitted to Institute of Bioinformatics College of Biological Science and Technology
National Chiao Tung University in partial Fulfillment of the Requirements
for the Degree of Master
in Bioinformatics
July 2007
自艾菲矩陣公司表現序列晶片計算信息核糖核
酸同型體的表現量的新方法
學生: 邢恆嘉 指導教授 : 黃憲達 博士
國立交通大學生物資訊研究所碩士班
中文摘要
選擇性剪接(alternative splicing)是一種核糖核酸進程(RNA process),用以使 同一基因產生多樣不同的轉錄產物(transcripts)。此一機制發生於真核生物與病 毒。人類的基因中,超過 50%的轉錄產物進行選擇性剪接,而這機制和疾病發生、 治療方法有高度的相關性。不同的信息核糖核酸同型體(mRNA isoform)表現量可 能影響不同的蛋白質同型體表現量。 如何利用表現序列晶片分析信息核糖核酸同型體的表現量,是相當重要的。 特別是現今艾菲矩陣公司表現序列晶片已被廣為使用,可以偵測基因和表現序列 的表現量。 本論文提出一種方法,能自艾菲矩陣公司表現序列晶片計算信息核糖核酸同 型體的表現量。該方法使用三個矩陣 P、E、I,以 P、E 矩陣經由 OSA 計算出 IE 矩陣。結果顯示,我們的計算和逆轉錄連鎖反應實驗(RT-PCR)驗證的結果符合。
A new method for determining isoform expression
of the Affymetrix GeneChip®Exon Array
Student: Heng-Chia Hsin Advisor : Dr. Hsien-Da Huang
Institute of Bioinformatics, National Chiao Tung University
Abstract
Alternative splicing is a RNA process generating multiple different transcripts from the same gene. It occurs in eukaryotes and viruses. Alternative splicing is generally believed to occur more than 50% of actively transcribed human genes and thus is highly relevant to disease and therapy. Different mRNA isoforms expression might cause different protein isoforms expression.
How to use high throughput exon array to analysis different mRNA isoforms expression is very important. Recently, Affymetrix GeneChip®Exon Array has become one of the most popular technologies for profiling gene expression and exon expression.
This thesis proposes and implements a method to determine different isoform expression of the exon array. Our method uses matrix P (Probeset expression data) and matrix E (Exon profile) to compute matrix I (Isoform expression) by Orthogonal Simulated Annealing algorithm (OSA), and our calculated results agree approximately with RT-PCR validation.
誌 謝
首先,我要感謝指導教授黃憲達博士在這兩年的日子裡
對於我的細心指導,使我得以在生物資訊這個領域裡慢慢地
從無到有,一點一滴地累積成長。並且也在生物資訊相關知
識和學術研究上有顯著的進步。另外,我也要感謝教授何信
瑩博士、高雄醫學大學的張建國醫師在研究過程中的指導,
讓我能沒有偏差地進行研究。
實驗室的學長姊們,謝謝你們對學弟的細心指導;實驗
室的同學們,謝謝大家在這兩年的互相幫忙及鼓勵,和大家
一起討論的日子,是我成長的動力,實驗室內的點點滴滴更
是美好的回憶。
最後,我要特別感謝我的家人給予我的支持,讓我能在
研究上全力以赴、完成學業。能夠完成碩士論文,是大家的
指導、支持、與鼓勵,誠心的感謝大家,將這份成果與關心
我的所有一同分享。
Table of Contents
中文摘要...i
Abstract ...ii
誌 謝... iii
Table of Contents ...iv
List of Figures ...vi
List of Tables...vii
List of Tables...vii
Chapter 1 Introduction ...1
1.1 Background ...1
1.1.1 The Central Dogma...1
1.1.2 Pre-mRNA splicing...2
1.1.3 Alternative splicing ...3
1.2 Affymetrix GeneChip®Exon Array ...9
1.3 Motivation...12
1.4 Goal...12
Chapter 2 Related Works ...13
2.1 Related Biological Databases ...13
2.1.1 GenBank ...13
2.1.2 UniGene ...13
2.2 Related Software...14
2.2.1 Blast ...14
2.2.2 OSA...15
2.3 NetAffx™ Analysis Center ...16
2.4 Related Alternative Splicing Databases ...16
2.4.1 ProSplicer...16 2.4.2 SpliceInfo ...18 2.4.3 ASD...19 2.4.4 ASAP...20 2.4.5 ASDB ...21 2.4.6 SpliceDB ...21 2.4.7 ASGS...22 2.4.8 HOLLYWOOD ...22
2.4.9 ASPIC ...23
2.5 Affymetrix GeneChip Exon Array Studies ...23
2.5.1 X:MAP and exonmap...23
2.5.2 Exon array assessment of gene expression ...24
2.5.3 Probe Selection and Expression Index Computation of Affymetrix Exon Arrays ...24
2.5.4 Alternative splicing and differential gene expression in colon cancer detected by a whole genome exon array ...25
Chapter 3 Materials and Methods ...26
3.1 Overview...26 3.2 Materials ...28 3.2.1 Matrix P ...28 3.2.2 Matrix E ...29 3.3 Methods...33 3.3.1 OSA...33 3.3.2 Matrix I ...34 Chapter 4 Results ...36 4.1 Case studies...36 4.1.1 BCL2L1 ...36 4.1.2 HIPK3 ...40 4.1.3 MST1R...43 4.2 Experimentally Confirmation ...45 4.2.1 RT-PCR validation ...45 4.2.2 BCL2L1 ...47 4.2.3 HIPK3 ...48 4.2.4 MST1R...50 Chapter 5 Discussion ...53
5.1 Limitations of our method ...53
5.2 Future Works...53
Chapter 6 Conclusions ...55
List of Figures
Figure 1.1 The Central Dogma ...2
Figure 1.2 The spliceosome assembly cycle ...3
Figure 1.3 Alternative splicing...4
Figure 1.4 Alternative splicing modes ...5
Figure 1.5 Overview of the Affymetrix GeneChip experiment ...9
Figure 1.6 A sample gene of interest with three exons[8] ...10
Figure 1.7 Array PSR (probe selection region)[7] ... 11
Figure 2.1 Flowchart of OSA[14, 15] ...15
Figure 2.2 System flow of ProSplicer ...18
Figure 3.1 Computing isoform expression...27
Figure 3.2 System flow ...27
Figure 3.3 Generating matrix P...29
Figure 3.4 Clustering gene, isoform and probeset ...30
Figure 3.5 Generating matrix E...31
Figure 3.6 Generating matrix P and matrix E ...32
Figure 3.7 Flowchart of proposed OSA algorithm...34
Figure 3.8 An example of our method ...35
Figure 4.1 The matrix P of BCL2L1 ...37
Figure 4.2 The isoforms of BCL2L1 ...37
Figure 4.3 The matrix E of BCL2L1...38
Figure 4.4 The matrix I of BCL2L1...39
Figure 4.5 The isoforms of HIPK3 ...41
Figure 4.6 The matrix P, E and I of HIPK3...42
Figure 4.7 The isoforms of MST1R...44
Figure 4.8 The matrix P, E and I of MST1R ...45
Figure 4.9 RT-PCR validation...46
Figure 4.10 RT-PCR validation of BCL2L1 ...47
Figure 4.11 RT-PCR validation of HIPK3 ...49
List of Tables
Table 1.1 Splicing trans-acting factors associated with human disease[5] ...8
Table 3.1 Data source ...28
Table 4.1 BCL2L1[34] ...36
Table 4.2 Isoform expression of BCL2L1...39
Table 4.3 HIPK3[34] ...41
Table 4.4 Isoform expression of HIPK3...42
Table 4.5 MST1R[34]...43
Table 4.6 Isoform expression of MST1R ...45
Chapter 1 Introduction
1.1
Background
1.1.1
The Central Dogma
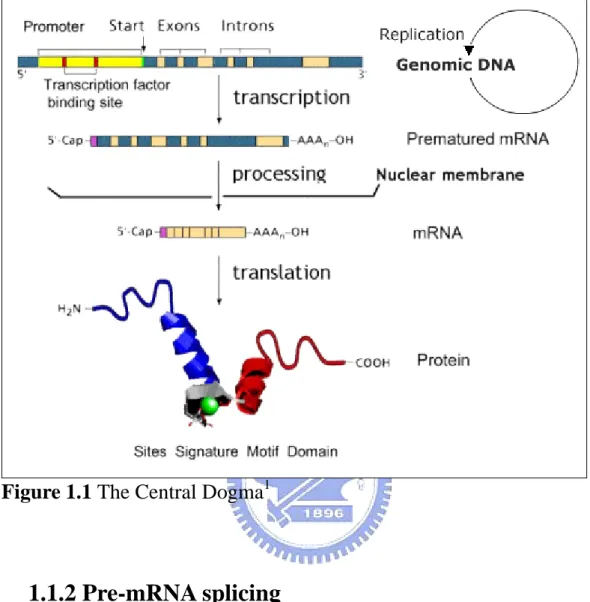
As shown in Fig. 1.1, in eukaryotic cells, the central dogma consists of three parts: transcription, processing and translation. During transcription, an RNA molecule is transcribed from a DNA template. Three major kinds of RNA are called Messenger RNAs (mRNAs), Transfer RNAs (tRNAs), and Ribosomal RNAs (rRNAs). The mRNA is processed and migrates from the nucleus to the cytoplasm. The most important stage in mRNA processing is splicing. Translation is RNA to protein. In the cytoplasm, mRNA carries coded information to ribosomes and ribosomes use it for protein synthesis. Gene expression is the process by which a gene's DNA is converted into functional proteins. The amount of gene expression is regulated by some of control mechanisms such as alternative splicing, frameshifting, RNA editing, and so on. The process of transcription is more complicated in eukaryotes, especially in higher organisms.
Figure 1.1 The Central Dogma1
1.1.2 Pre-mRNA splicing
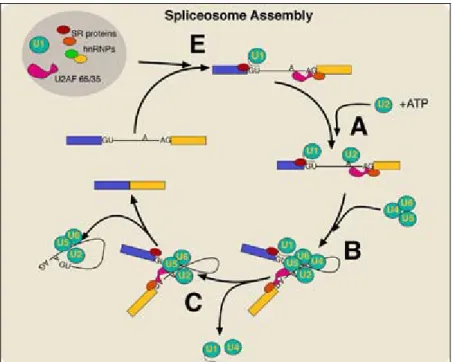
Most eukaryotic pre-mRNA consists of exons and introns. While pre-mRNA is splicing, splicesome is important complex that involving in splicing. The splicesome is composed of five small nuclear ribonucleoproteins, U1, U2, U4, U5, and U6. As shown in Fig. 1.2,
Figure 1.2 The spliceosome assembly cycle2
1.1.3 Alternative splicing
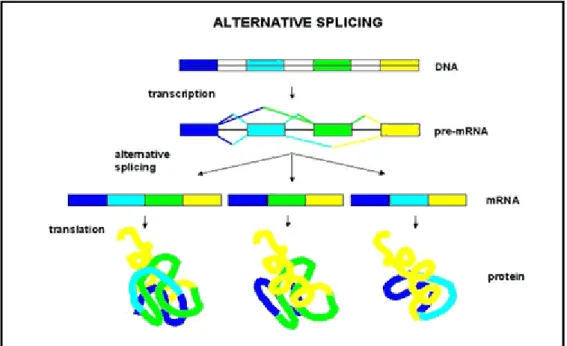
Alternative splicing is the variety of the splicing process in which the exons of the pre-mRNA. Pre-mRNAs which have been transcribed from the same gene are alternative splicing in different ways to produce various mature mRNAs and then mature mRNAs are translated into different proteins (Fig. 1.3).
2
Figure 1.3 Alternative splicing3
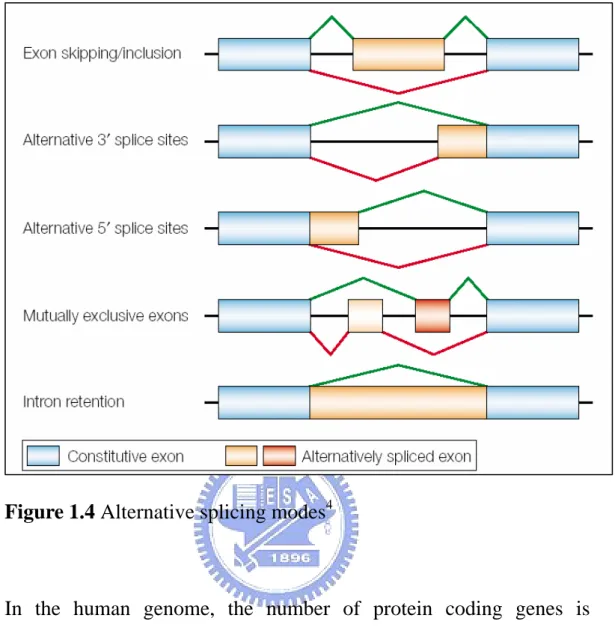
The alternative splicing modes have been categorized into several models to reveal the alternative splicing mechanisms. In Fig. 1.4, exons are represented by boxes and introns by lines. There are five classical modes of alternative splicing modes such as exon skipping, alternative 3’ splice sites, alternative 5’ splice sites, mutually exclusive exons and intron retention.
Figure 1.4 Alternative splicing modes4
In the human genome, the number of protein coding genes is estimated to 20,000–25,000[1],, which is much less than the previous estimates based on analysis of expressed sequence tags (ESTs, 100,000 to 150,000 genes)[2, 3]. The mechanism of alternative splicing explains the difference between two kinds of estimations of gene numbers. Alternative splicing is a RNA process generating multiple different transcripts from the same gene. It occurs in eukaryotes and viruses.
Alternative splicing is generally believed to occur more than 50% of
4
actively transcribed human genes[4] and thus is highly relevant to disease and therapy (Table 1.1)[5]
.
Splicing factora OMIM numberb Disease ssociationc Comments CUG triplet repeat,
RNA-binding protein 1; CUGBP1 (CUGBP; NAB50; BRUNOL2)
601074 Myotonic dystrophy (DM)
CUG-binding proteins may be affected in DM.
CUG triplet repeat, RNA-binding protein 2; CUGBP2 (ETR3)
602538 Myotonic dystrophy (DM)
CUG-binding proteins may be affected in DM. FUS-interacting protein 1; FUSIP1 (TASR(1 or 2); SRp38; SRRp40; NSSR) 605221 Leukemias and sarcomas
FUSIP1 interacts with the C-terminal region of TLS and this interaction and perhaps the function of FUSIP1 is
disrupted by the TLS-ERG fusion found in some leukemias and sarcomas fusion protein.
Fusion, derived from 12–16 translocation, malignant liposarcoma; FUS (TLS) 137070 Liposarcomas, acute myeloid leukemia (AML)
The FUS gene is translocated in leukemias and sarcomas. Glycogen synthase kinase 3-BETA; GSK3B (GSK-3β) 605004 Alzheimer disease (AD)
Inhibition of GSK3B led to an increase in the inclusion of tau exon 10, possibly mediated by SC35. This recent finding should be carefully examined.
Hydroxymethylglutaryl coenzyme A1a
(HMGA1a) (HMG-I)
600701 Alzheimer disease (AD)
Overexpression of HMGA1a was found to cause aberrant splicing of presenilin-2 transcripts, which is a feature of sporadic Alzheimer disease (AD). Brains from AD patients show significant increases in
Muscleblind-like protein 2; MBNL2 (MBLL) 607327 Myotonic dystrophy (DM) See MBNL1 above. Muscleblind-like protein 3; MBNL3 (MBXL) 300413 Myotonic dystrophy (DM) See MBNL1 above. Neurooncologic ventral
antigen 1; NOVA1 (Ri Ag)
602157 Paraneoplastic syndrome
Autoantibodies to NOVA1 seen in patients with paraneoplastic syndrome.
Precursor
mRNA-processing factor 3, Saccharomyces cerevisiae, homolog of PRPF3 (PRP3; HPRP3)
607301 Retinitis pigmentosa Mutations in the PRPF3 gene cause retinitis pigmentosas (RP) in some families.
Precursor mRNA-processing factor 31, S. cerevisiae, homolog of PRPF31 (PRP31) 606419 Retinitis pigmentosa
Mutations in the gene encoding PRPF31 cause retinitis pigmentosas in some families. Precursor mRNA-processing factor 8, S. cerevisiae, homolog of PRPF8 (PRP8 PRPC8 U5 snRNP-specific protein, 220-K; p220)
607300 Retinitis pigmentosa Mutations in the PRPF8 gene cause retinitis pigmentosas in some families.
RNA-binding motif protein, Y chromosome family 1, member A1; RBMY1A1 (RBMY; RBM1; RBM2; YRRM1; YRRM2)
400006 Azospermia
Deletions of the RBMY coding gene(s) have been associated 180,181 with azospermia.
Splicing factor HCC1
(HCC1.3; HCC1.4) 604739
Hepatocellular carcinoma
Autoantibodies to HCC1 seen in patients with hepatocellular carcinoma but pathophysiological consequences are not evident.
Splicing factor, proline- and glutamine-rich SFPQ (PSF)
605199 Papillary renal cell carcinoma
SFPQ was fused with the TFE3 gene product as a result of a 183 translocation in papillary renal cell carcinomas
Survival of motor neuron 1, telomeric: SMN1 (SMN; SMNT; T-BCD541)
600354 Spinal muscular
atrophy SMN1 mutations cause SMA.
Survival of motor neuron 2, centromeric, SMN2 (SMNC; C-BCD541)
601627 Spinal muscular
atrophy Deletion of SMN2 can also cause SMA.
Tumor protein p73-like:
TP73L p(63) 603273 Hay-Wells syndrome
Mutations in the alpha isoform of TP73L protein are associated with altered FGFR2 splicing and developmental abnormalities in Hay-Wells syndrome.
1.2 Affymetrix GeneChip®Exon Array
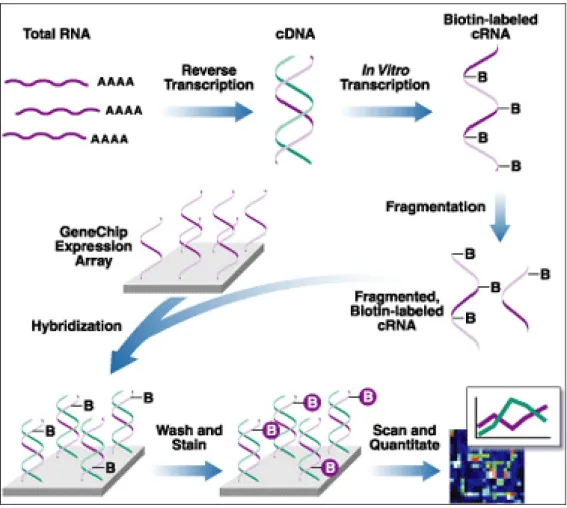
Microarray technology, a high-throughput tool, is one of the most important tools for measuring gene expression[6]. Expression microarrays use probes targeting specific genes based on nucleotide sequence complementarily to measure gene expression (Fig. 1.5).
Figure 1.5 Overview of the Affymetrix GeneChip experiment5
In just a few years, Affymetrix released a new platform, exon array, designed to measure exon-level expression. The Affymetrix GeneChip®
5
Exon Arrays are the first experimental tools available to survey both gene expression and alternative splicing patterns on the whole-genome scale on a single array[7] (Fig. 1.6).
Figure 1.6 A sample gene of interest with three exons[8]
In Fig. 1.7, most of the exons over 25 bp in length, along the whole transcript, are represented on the array with at least one probe set. The majority of the probe sets are comprised of four PM-probes(Perfect Match) for each probe set to provide robust results [7].
1.3 Motivation
Affymetrix GeneChip®Exon Array has become one of the most popular technologies for profiling gene expression and exon expression.
Different mRNA isoforms expression might cause different protein isoforms expression. These mRNA might contain important protein domain function. How to use high throughput exon array to analysis different mRNA isoforms expression is very important.
1.4 Goal
Use a model to determine different isoform expression of the exon array.
Previous study reveals that alternative splicing is importance of disease and therapy. To further the research of the regulatory mechanisms involved in alternative splicing, a
method for determining isoform
expression
is neededChapter 2 Related Works
2.1
Related Biological Databases
2.1.1
GenBank
GenBank [9] is a database of nucleotid sequences from > 130,000 organisms. Records that are annotated with coding region (CDS) features also include amino acid translations. GenBank belongs to an international collaboration of sequence databases, which also includes EMBL [10] and DDBJ [11].
2.1.2
UniGene
Unigene [12] is an experimental system for automatically partitioning GenBank sequences into a non-redundant set of gene-oriented clusters. ESTs and full-length mRNA sequences organized into clusters that each represents a unique known or putative gene within the organism from which the sequences were obtained. Each UniGene cluster contains sequences that represent a unique gene, as well as related information such as the tissue types in which the gene has been expressed and map
location. UniGene clusters are annotated with mapping and expression information when possible, and include cross-references to other resources.
Currently in UniGene, sequences from the animals human, rat, mouse, cow, zebrafish, clawed frog, fruit fly and mosquito have been processed. Plant organisms are wheat, rice, barley, maize and cress. These species were chosen because they have the greatest amounts of EST data available and represent a variety of species. Additional organisms may be added in the future.
2.2
Related Software
2.2.1
Blast
The Basic Local Alignment Search Tool (BLAST) [13] finds regions of local similarity between sequences. The program compares nucleotide or protein sequences to sequence databases and calculates the statistical significance of matches. BLAST can be used to infer functional and
2.2.2 OSA
OSA (Orthogonal simulated annealing algorithm) is improved from simulated annealing. This algorithm use an intelligent generation mechanism based on orthogonal experimental design (OED) to replace the perturbation scheme runs from original SA. Fig.2.1 is the flow for proposed OSA.
An initial solution\
Final solution
Orthogonal Simulated Annealing
Objective function evaluation
Solution accepted Update the current
solution Change temperature Decrease temperature Stop the algorithm Intelligent Generation Mechanism : OED Yes No Yes No
2.3 NetAffx™ Analysis Center
The NetAffx™ Analysis Center (www.affymetrix.com/analysis/), an integrated, online resource created by Affymetrix. This resource enables researchers to correlate their GeneChip® array results with array design and annotation information. Using this web-based tool, researchers with unprecedented access to array content information, including probe sequences and gene annotations[16].
2.4 Related Alternative Splicing Databases
2.4.1 ProSplicer
ProSplicer [17] extracts the alternative splicing forms by computational alignment methods like BLAST [13] and SIM4[18]. The nucleotide sequences, mRNA and EST, provide gene expression evidences to reveal the gene alternative splicing modes, as well as the protein sequences are theoretically translated to nucleotides in six reading
provides the boundary information of alignment result. The boundaries information can be used as the splicing sites, donor sites or acceptor sites, if considering the alternative splicing issues.
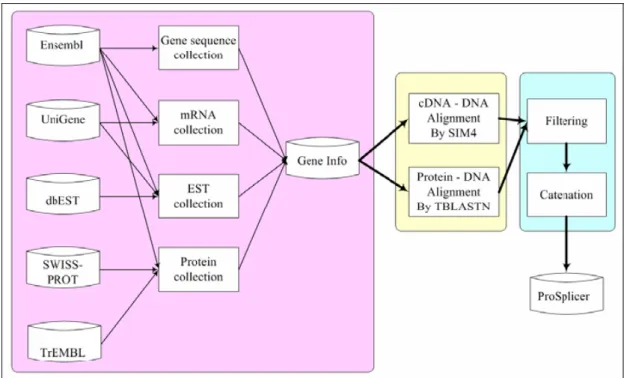
The prediction approach of alternative splicing consists of three main phases and the system flow is shown in Figure 2.1 [17]. The three phases are the preprocessing phase, the alignment phase, and the filtering phase. In the preprocessing phase, the gene genomic sequences, EST, mRNA sequences and protein sequences, which are stored in different biological databases, are collected, converted, and integrated into a single database, namely GeneInfo. All the sequences are maintained and prepared for the analysis of the alignment phase. In the alignment phase, the protein sequences are aligned to the gene genomic sequences by TBLASTN [13], as well as the mRNA and EST sequences are aligned by the alignment tool, SIM4. The exon candidates are generated by both the alignment tools. In the filtering phase, we filter the noise of the exon candidates, and connect the exon candidates as reasonable transcripts form of each EST, mRNA and protein sequences by considering their sequential order of matching blocks. Finally, the exon candidates of the alternative splicing forms are provided in the database of ProSplicer.
Figure 2.2 System flow of ProSplicer
2.4.2 SpliceInfo
SpliceInfo[19] is an information repository for mRNA alternative splicing in human genome. We have developed an information repository named SpliceInfo to collect the occurrences of the four major alternative-splicing (AS) modes in human genome; these include exon skipping, 5'-alternative splicing, 3'-alternative splicing and intron retention. The dataset is derived by comparing the nucleotide and protein sequences available for a given gene for evidence of AS. Additional
exonic region that is alternatively spliced. Motivated by a previous investigation of AS-related motifs such as exonic splicing enhancer and exonic splicing silencer, this resource also provides a means of identifying motifs candidates and this should help to identify potential regulatory mechanisms within a particular exonic sequence set and its two flanking intronic sequence sets. This is carried out using motif discovery tools to identify motif candidates related to alternative splicing regulation and together with a secondary structure prediction tool, will help in the identification of the structural properties of such regulatory motifs.
2.4.3 ASD
ASD [20] is developed to understand the mechanism of alternative splicing on a genome-wide scale. They have two products, first is a database of computationally delineated alternative splice modes as seen in alignments of EST/cDNA sequence with genome sequences, and second is a database of alternatively spliced exons collected from literatures. Most difference between these two products is their content, one is computationally predicted data and the other is experimentally determined data. Databases from ASD are AEDB, AltExtron, and AltSplice. AEDB is a manually curated database, AltExtron, and
AltSplice are two computer-generated databases which used computational pipeline to generate alternative splice data and annotation.
2.4.4 ASAP
The previous research of ASAP [21] is HASDB [22]. ASAP is an online database for biologists to access and mine the enormous wealth of alternative splicing information coming from genomics and proteomics. Based on genome-wide analyses of alternative splicing in human from detailed alignment of expressed sequences onto the genomic sequences, they provided precise gene exon-intron structure, alternative splicing, tissue specificity of alternative splice forms, and protein isoform sequences resulting from alternative splicing. Further more, they can help biologists design probe sequence for distinguishing specific mRNA isoforms. They also developed an automated method for discovering human tissue-specific regulation of alternative splicing through a genome-wide analysis of expressed sequence tags (ESTs), which involves classifying human EST libraries according to tissue categories and Bayesian statistical analysis in a related research.
2.4.5 ASDB
The Alternative Splicing DB (ASDB) [23, 24] has been established with the intention of assembling in a central, publicly accessible site information about alternatively spliced genes, their products and expression patterns. There are two divisions of ASDB, one is ASDB (proteins) division that use Swiss-Prot as data source and use CLUSTALW to process data. This processing covers the cases when alternatively spliced variants are described in separate SWISS-PROT entries. The other one is ASDB (nucleotides) division that use GenBank as data source by collecting all GenBank entries containing the words "alternative splicing" and further selection of those entries that contain complete gene sequences.
2.4.6 SpliceDB
SpliceDB [25] is a database of known mammalian splice site sequences. They focused on canonical and non-canonical splice site sequences in mammalian genes. A set of 43337 splice junction pairs was extracted from mammalian GenBank annotated genes. 22489 of them are supported by EST sequences. 98.71% of those contain canonical di-nucleotides GT and AG for donor and acceptor sites, respectively.
0.56% hold non-canonical GC-AG splice site pairs. The reminder 0.73% occurs in a lot of small groups (with maximum size of 0.05%).
2.4.7 ASGS
The Alternative Splicing Graph Server (ASGS) [26] is a web service facilitating the systematic study of alternatively spliced genes of higher eukaryotes by generating splicing graphs for the compact visual representation of transcript diversity from a single gene. Taking a set of transcripts in General Feature Format as input, ASGS identifies distinct reference and variable exons, generates a transcript splicing graph, an exon summary, splicing events classification and a single line graph to facilitate experimental analysis.
2.4.8 HOLLYWOOD
The 2.4.8 HOLLYWOOD [27] was built upon genomic annotation of splicing patterns of known genes derived from spliced alignment of complementary DNAs (cDNAs) and expressed sequence tags, and links
2.4.9 ASPIC
ASPIC[28] is a web resource for alternative splicing prediction and transcript isoforms characterization and uses a novel method to predict the exon-intron structure of a gene that is optimally compatible to a set of transcript sequences[29]. ASPIC is a web-based tool to detect the exon-intron structure of a gene by comparing its genomic sequence to the related cluster of ESTs. ASPic predicts constitutive and alternative splice sites through a novel methodology that uses a combined analysis of all EST alignments to make them most compatible to a common exon-intron structure of the gene considered.
2.5 Affymetrix GeneChip Exon Array Studies
2.5.1 X:MAP and exonmap
X:MAP [30] http://xmap.picr.man.ac.uk, an annotation database, and exonmap [30] http://www.bioconductor.org/packages/2.0/bioc/html/exonmap.html, a BioConductor/R package, are designed to support fine-grained analysis of exon array data. The system supports the application of standard statistical techniques, prior to the use of genome scale annotation to
provide gene, transcript and exon level summaries and visualization tools.
2.5.2 Exon array assessment of gene expression
Kapur et al. [31] develop a strategy for estimating gene expression on Affymetrix Exon arrays. The method includes a probe-specific background correction and a probe selection strategy in which a subset of probes with highly correlated intensities across multiple samples are chosen to summarize gene expression. Their results demonstrate that the proposed background model offers improvements over the default Affymetrix background correction and that Exon arrays may provide more accurate measurements of gene expression than traditional 3' arrays.
2.5.3 Probe Selection and Expression Index Computation
of Affymetrix Exon Arrays
indexes using the selected probes.
2.5.4 Alternative splicing and differential gene expression
in colon cancer detected by a whole genome exon array
Gardina et al.[33] analyzed 20 paired tumor-normal colon cancer samples using a microarray designed to detect over one million putative exons that can be virtually assembled into potential gene-level transcripts according to various levels of prior supporting evidence. Analysis of high confidence (empirically supported) transcripts identified 160 differentially expressed genes, with 42 genes occupying a network impacting cell proliferation and another twenty nine genes with unknown functions. A more speculative analysis, including transcripts based solely on computational prediction, produced another 160 differentially expressed genes, three-fourths of which have no previous annotation.
Chapter 3
Materials and Methods
3.1
Overview
Fig.3.1 shows our method how to compute isoform expression. The matrix P is Probeset expression data of the gene from Affymetrix GeneChip®Exon Array experiment data. The matrix E is Exon profile of the gene from our prepossessing database collecting isoform from GenBank and UniGene. Then we use matrix P and E to compute matrix I. The matrix I is Isoform expression calculated by OSA-method. OSA-method can calculate optimal solution for matrix I. The system flow of the proposed method is shown in Fig. 3.2.
P
1P
2P
3 : :P
kI
1I
2I
3 : :I
n = × n k P:Probe set expression E:Exon profileI :Isoform expression
P
known=
E
known×
I
unknown111101 … 1
110110 1
001100 1
: :110011 1
Is of or m 1 Is of or m 2 Is of or m 3 Is of or m n probeset value from exon arrayeach isoform expression probeset 1 probeset 2 probeset 3 probeset k
Figure 3.1 Computing isoform expression
UniGene UniGene GenBank GenBank NetAffx NetAffx External databases
Using UniGene, GeneBank and Netaffx information
to group gene, mRNA and probeset Preprocessing probeset gene, mRNA All mRNA isoform ExonDB All exon sequence Gene group : : 3902524 : 3902493 gi17939633 3902492 gi30583254 3902491 gi113713536 Probesets: Isoform sequences: Gene group Gene ID: 598(BCL2L1) Mapping gene probe set
Exon expression data:
Affymetrix GeneChip® Exon Array
Blast alignment
probe set isoform
Blast alignment probe set isoform
Generating matrix P Generating matrix P 5.1 2.7 6.3 Generating matrix E Generating matrix E 111101 110110 001100 Calculate optimal solution for isoform expression OSA (Orthogonal simulated annealing algorithm) RT-PCR
validation data Results of isoformexpression
(produce matrix I) Results of isoform expression (produce matrix I) Experimentally Confirmation
3.2
Materials
The data source using in this work are given in Table 3.1.
Table 3.1 Data source
Genomics Sequences GenBank UniGene Species Version No. of genes No. of unique gene
clusters No. of mRNA sequences Homo sapiens (human) 36.2 28,288 85,590 172,266
3.2.1 Matrix P
First step, we map how many probeset in each gene. Probeset mappings over NCBI Entrez Gene generated at NetAffx Annotation Files.
Second Step, the probeset expression data of each gene are from Affymetrix GeneChip®Exon Array experiment data.
As one can see from Fig.3.2, there are nine probesets like A, B, C, …, I in seven exon cluster.
– the exon expression value might be like • probeset A : 4.5 • probeset B : 6.1 • probeset C: 3.2 • … etc. A B C D E F G H I P matrix 4.5 6.1 3.2 …
Figure 3.3 Generating matrix P
3.2.2
Matrix E
We collect isoforms(mRNA) sequences and information from GenBank. Then we cluster isoform sequences to different clusters by the gene group information which comes from UniGene (Fig.3.3) .
Probeset sequences are downloaded from the NetAffx. Probeset mappings over NCBI Entrez Gene generated at NetAffx Annotation Files.
For each gene, we use Blast to align probeset(1,2,3…k) and isoform(1,2,3…n) sequence. If probeset targets isoform, set the element to 1. It can be seen from Fig.3.4 and Fig. 3.5.
Gene group
UniGene
UniGene GenBankGenBank
NetAffx
NetAffx
Using UniGene,GeneBank and Netaffx information
to group gene, mRNA and probeset : : : : : : 3902526 : 3902525 : 3902524 : 3902523 : 3902522 gi20336333 3902509 gi20336334 3902493 gi17939633 3902492 gi30583254 3902491 gi113713536 Probesets: Isoform sequences: Gene group Gene ID: 598(BCL2L1)
1 1 1 1 1 11 1 1 1 1 1 1 1 1 1 1 11 1 1 1 1 1 1 1 1 1 11 1 1 1 1 1 1 1 1 1 1 11 1 1 1 1 0 0 0 0 0 00 0 0 0 0 0 0 1 0 0 0 00 0 0 1 1 0 0 0 0 0 00 0 0 0 0 0 0 1 0 0 0 00 0 0 0 0 0 0 0 0 0 00 0 0 0 0 0 0 1 0 0 0 00 0 0 1 1 0 0 0 0 0 00 0 0 0 0 0 0 0 0 0 0 00 0 0 1 1 0 0 0 0 0 00 0 0 0 0 0 0 0 0 0 0 00 0 0 1 1 rotate 1 1 1 1 1 1 1 1 1 1 1 1 1 1 1 1 1 1 1 1 1 1 1 1 1 1 1 1 1 1 1 1 1 1 1 1 1 1 1 1 1 1 1 1 1 1 0 0 0 0 0 0 0 0 0 0 0 0 0 1 0 0 0 0 0 0 0 1 1 0 0 0 0 0 0 0 0 0 0 0 0 0 1 0 0 0 0 0 0 0 0 0 0 0 0 0 0 0 0 0 0 0 0 0 0 1 0 0 0 0 0 0 0 1 1 0 0 0 0 0 0 0 0 0 0 0 0 0 0 0 0 0 0 0 0 0 1 1 0 0 0 0 0 0 0 0 0 0 0 0 0 0 0 0 0 0 0 0 0 1 1 probeset … … E matrix
probeset Isoform 1 Isoform 2 Isoform 3 A B C D E 0 1 1 1 1 1 1 1 1 1 1 0 0 0 0 rotate 1 1 1 0 1 1 1 0 1 1 1 0 0 0 1 Is ofor m 1 Isof or m 2 Isoform 3 probeset E probeset D probeset C probeset B probeset A matrix E 4.3 5.1 2.3 6.2 6.1 matrix P probeset expression value from exon array
Isoform and probeset mapping
3.3 Methods
The following assumptions have been made in working out the model to determine isoform expression of the exon array.
1. Each exon of one isoform has the same expression.
2. Our database collects nearly all isoforms of the gene. If the gene has unknown isoform sequences, our method can not calculate the effect of unknown isoforms.
3.3.1 OSA
In order to solve this equation, we use a tool called OSA. OSA can calculate optimal solution for matrix I. As follows:
Minimum | | E × I | - P |
OSA changes the elements of matrix I and then calculates solution for the equation. We limit the value of the elements of matrix I should be between -5 and 5. Finally, OSA make the value of the equation be minimum. Flowchart of proposed OSA algorithm is shown in Fig.3.7.
Figure 3.7 Flowchart of proposed OSA algorithm
Least square error (LSE) is defined as equation:
[ ] [ ][ ]
P E I LSE N n n∑
= − = 03.3.2 Matrix I
The matrix I is Isoform expression calculated by OSA-method. For instance, let us assume a gene shown in Fig.3.6. We can use known
Chapter 4
Results
4.1 Case studies
In this section, to clarify the description, a few examples are given. We analyzed one paired amiloride-control samples (Huh7 Human
Hepatoma cell line) using Affymetrix GeneChip®Exon Array. Amiloride samples add 0.5mM amiloride for 24 hours.
4.1.1 BCL2L1
The summary of the gene named BCL2L1 is shown in Table 4.1.
array experiment data. In matrix P, each element represents the log2(intensity/ mean of intensity of the gene) (Fig. 4.1).
probe set ID H u Ex _H uh7_ C ontrol H u Ex _H uh7_ Amil orid e 3902526 3902525 3902524 3902523 3902522 3902509 3902493 3902492 3902491 980792 980791 980791 980791 980791 980783 980767 980767 980767 Exon_ID -0.59564 -0.33962 -0.39421 -0.35257 -1.67118 -1.79773 -1.13303 -1.4825 1.50668 1.35812 -5.06443 -4.67944 0.33278 0.697515 0.487176 0.627547 0.350287 0.017049 matrix P
Figure 4.1 The matrix P of BCL2L1
The isoforms of the gene are shown in Fig. 4.2. BCL2L1 has 11 isoforms.
We use our method to generate matrix E (Fig. 4.3).In probeset level, 11 isoforms are clustered to 7 groups. After generating matrix P and matrix E, we compute each isoform expression (matrix I) (Fig. 4.4). The results can be seen from Table 4.2. It clearly shows each isoform expression. Least square error is 2.011581.
m RNA ID 1 1 1 0 1 1 0 1 1 0 0 1 1 1 1 1 0 0 1 1 1 1 1 0 0 1 1 1 0 1 0 0 0 1 1 0 0 0 1 0 0 0 1 1 0 0 1 1 0 1 1 0 0 1 1 0 0 0 0 0 1 1 0 matrix E 11371 353 6;30 583 254 17939 633; 203 363 34 20336 333 21595 608 30349 280; 303 492 82;3 0349 284 51090 0 62323 6
=
×
1137 135 36; 30 58325 4 1793 963 3;2 03 36334 2033 633 3 2159 560 8 3034 928 0;3 03 49282 ;3034 928 4 5109 00 6232 36 m R N A ID probe set ID H uEx _Huh7_ Control H uEx _Huh7_ Amil orid e 3902526 3902525 3902524 3902523 3902522 3902509 3902493 3902492 3902491 1 1 1 0 1 1 0 1 1 0 0 1 1 1 1 1 0 0 1 1 1 1 1 0 0 1 1 1 0 1 0 0 0 1 1 0 0 0 1 0 0 0 1 1 0 0 1 1 0 1 1 0 0 1 1 0 0 0 0 0 1 1 0 980792 980791 980791 980791 980791 980783 980767 980767 980767 Exon_ID HuEx _H uh 7_ Co n tr o l HuEx _H uh 7_ Amil orid e -0.59564 -0.33962 -0.39421 -0.35257 -1.67118 -1.79773 -1.13303 -1.4825 1.50668 1.35812 -5.06443 -4.67944 0.33278 0.697515 0.487176 0.627547 0.350287 0.017049 -0.38587 -0.6469 0.439461 1.30314 -1.00004 -1.01366 -4.92485 -4.69582 -2.18694 -1.91781 2.53611 1.93635 -1.46499 -1.88889 623236 510900 30349280;30349282;30349284 21595608 20336333 17939633;20336334 113713536;30583254 matrix E matrix P matrix IFigure 4.4 The matrix I of BCL2L1
Table 4.2 Isoform expression of BCL2L1
Isoform ID Control isoform expression Amiloride isoform expression 113713536;30583254 -1.88889 -1.46499 17939633;20336334 1.93635 2.53611 20336333 -1.91781 -2.18694 21595608 -4.69582 -4.92485 30349280;30349282;30349284 -1.01366 -1.00004 510900 1.30314 0.439461 623236 -0.6469 -0.38587
Isoform ID 113713536;30583254 17939633;20336334 20336333 21595608 30349280;30349282;30349284 510900 623236 Isoform ID 113713536;30583254 17939633;20336334 20336333 21595608 30349280;30349282;30349284 510900 623236
4.1.2 HIPK3
Table 4.3 HIPK3[34]
The matrix P (probeset expression data) of each gene are from exon array experiment data. In matrix P, each element represents the log2(intensity/ mean of intensity of the gene) (Fig. 4.6).
The isoforms of the gene are shown in Fig. 4.5. HIPK3 has 5 isoforms.
Figure 4.5 The isoforms of HIPK3
We use our method to generate matrix E (Fig. 4.6). After generating matrix P and matrix E, we compute each isoform expression (matrix I) (Fig. 4.6). The results can be seen from Table 4.4. It clearly shows each isoform expression. Least square error is 123.7336.
=
×
1 0998 781 1 1479 6623 1 1479 6629 2 6273 30 3 8017 110 mR N A I D 3325910 3325911 3325912 3325924 3325929 3325930 3325935 3325936 3325937 3325938 3325939 3325940 3325941 3325944 3325945 3325946 3325947 3325948 3325949 3325950 3325951 3325953 3325954 3325956 3325957 3325958 3325959 0 0 1 1 0 0 0 1 1 0 0 0 1 1 0 0 0 1 1 1 0 1 1 1 1 0 1 1 1 1 1 0 0 0 0 1 1 1 1 1 1 1 1 1 1 0 1 1 1 1 0 1 1 1 1 0 1 1 1 1 0 1 1 1 1 0 1 1 1 1 0 1 1 1 1 0 1 1 1 1 0 1 1 1 1 0 1 0 1 0 0 1 1 1 1 0 1 1 1 1 0 1 1 1 1 0 1 1 1 1 0 1 1 1 1 0 1 1 1 0 0 0 1 1 1 0 0 1 1 1 0 0 1 1 1 probe set ID Hu Ex _H uh7 _C Hu Ex _H uh7 _A 630190 630190 630190 630201 630206 630206 630209 630210 630211 630211 630212 630213 630214 630217 630218 630218 630219 630220 630221 630221 630222 630224 630225 630227 630228 630229 630229 Exon_ID H uE x _H uh 7_C H uE x _H uh 7_A -2.06042 -1.28797 -0.04534 3.18667 -2.30869 -0.69237 1.89762 1.58485 -0.25007 -3.14236 0.865316 0.721087 -6.72894 -4.21869 -0.85519 -1.32581 0.28488 -0.19078 0.376701 0.18872 0.967621 -0.00154 -1.24171 -4.14097 -0.585 -1.21281 -0.39982 -1.47455 -1.33163 -1.28951 -1.25597 -2.10656 0.265904 0.503262 -2.9089 -0.56769 -0.50733 -2.1191 0.311306 -0.18075 -0.40262 -1.93251 0.608805 0.501447 0.86602 0.504132 0.658697 -1.79186 -0.28518 -2.10233 0.046853 -1.96302 -0.54273 -3.83988 -2.60148 -1.28782 0.316934 0.202517 2.20781 0.557292 -3.22413 -0.75383 0.951356 -0.94172 10998781 114796623 114796629 2627330 38017110Figure 4.6 The matrix P, E and I of HIPK3
Table 4.4 Isoform expression of HIPK3
Isoform ID Control isoform expression Amiloride isoform expression 10998781 -0.94172 0.951356 114796623 -0.75383 -3.22413 114796629 0.557292 2.20781
Isoform ID 10998781 114796623 114796629 2627330 38017110 Isoform ID 10998781 114796623 114796629 2627330 38017110
4.1.3 MST1R
The summary of the gene named MST1R is shown in Table 4.5.
Table 4.5 MST1R[34]
The matrix P (probeset expression data) of each gene are from exon array experiment data. In matrix P, each element represents the
log2(intensity/ mean of intensity of the gene) (Fig. 4.8).
The isoforms of the gene are shown in Fig. 4.7. MST1R has 2 isoforms.
Figure 4.7 The isoforms of MST1R
We use our method to generate matrix E (Fig. 4.8). In probeset level, 2 isoforms are clustered to 1 group. After generating matrix P and matrix E, we compute each isoform expression (matrix I) (Fig. 4.8). The results can be seen from Table 4.6. It clearly shows each isoform expression. Least square error is 85.573.
=
×
36 10 9;4 50 52 64 mRNA I D probe set ID H uE x _H uh 7_ C H uE x _H uh 7_ A 2674958 2674957 2674956 2674955 2674954 2674953 2674952 2674951 2674950 2674949 2674948 2674947 2674946 2674945 2674943 2674941 2674939 2674938 2674934 2674933 2674931 2674930 2674929 2674928 2674927 2674925 1 1 1 1 1 1 1 1 1 1 1 1 1 1 1 1 1 1 1 1 1 1 1 1 1 1 223945 223944 223944 223943 223942 223941 223940 223939 223938 223937 223936 223936 223936 223935 223934 223934 223933 223933 223931 223930 223928 223927 223926 223926 223926 223926 Exon_ID HuE x _H uh 7_ C HuE x _H uh 7_ A -0.23866 -0.1534 1.22553 1.30288 0.019286 -0.07115 -0.14227 -0.40531 0.941227 -0.75568 0.810144 0.643763 -0.1956 -0.35538 -0.69905 -0.35459 -1.07866 -2.1019 -2.81946 -2.08217 1.01519 -0.13757 0.58675 1.16443 -1.45415 -2.86797 0.839422 1.40163 1.11446 0.911959 -0.63474 -1.63112 -1.30345 -1.09445 -0.34878 -1.55134 -2.11589 -2.38175 -1.0695 -1.27167 -0.44403 -1.54298 -0.66126 0.067933 -1.4469 -2.04921 0.352437 1.13915 0.695923 1.69815 -3.29809 -3.19321 -0.44306 -0.63941Figure 4.8 The matrix P, E and I of MST1R
Table 4.6 Isoform expression of MST1R
Isoform ID Control
isoform expression
Amiloride isoform expression
36109;4505264 -0.63941 -0.44306
(log2(intensity/ mean of intensity of the gene))
4.2 Experimentally Confirmation
4.2.1 RT-PCR validation
expression. Description of used primers is shown in Table 4.7. The results can be seen from Fig. 4.9. The X-axis shows the ratio of the long isoform expression to the short isoform expression.
Table 4.7 Description of used primers
Gene Primers Temperature(℃)
BCL2L1 bcl-x-5' gaggcaggcgacgagtttgaa bcl-x-3' tgggagggtagagtggatggt
56 HIPK3 U- EXON-5' AGCCTGCCACTACCAAGAAA
U- EXON-3' CAGCAATTTCTTGCCTCTCC
58 MST1R Ron-2507-5' cctgaatatgtggtccgagacccccag
Ron-2991-3' ctagctgcttcctccgccaccagta
4.2.2 BCL2L1
The relationships between RT-PCR validation and our computed results are depicted in Fig. 4.10.
=
×
1 1371 35 36 ;3 0 583 25 4 1 7939 63 3; 20 3 363 34 2 0336 33 3 2 1595 60 8 3 0349 28 0; 30 3 492 82 ;303 4 9 284 5 1090 0 6 2323 6 mR N A I D probe set ID H u Ex _Huh7_ Control H u Ex _Huh7_ A m ilorid e 3902526 3902525 3902524 3902523 3902522 3902509 3902493 3902492 3902491 1 1 1 0 1 1 0 1 1 0 0 1 1 1 1 1 0 0 1 1 1 1 1 0 0 1 1 1 0 1 0 0 0 1 1 0 0 0 1 0 0 0 1 1 0 0 1 1 0 1 1 0 0 1 1 0 0 0 0 0 1 1 0 980792 980791 980791 980791 980791 980783 980767 980767 980767 Exon_ID HuEx _H uh7_ C ontrol HuEx _H uh7_ A mil orid e -0.59564 -0.33962 -0.39421 -0.35257 -1.67118 -1.79773 -1.13303 -1.4825 1.50668 1.35812 -5.06443 -4.67944 0.33278 0.697515 0.487176 0.627547 0.350287 0.017049 -0.38587 -0.6469 0.439461 1.30314 -1.00004 -1.01366 -4.92485 -4.69582 -2.18694 -1.91781 2.53611 1.93635 -1.46499 -1.88889 623236 510900 30349280;30349282;30349284 21595608 20336333 17939633;20336334 113713536;30583254 matrix E matrix P matrix I bcl-x-5' bcl-x-3' primer 2 1 Control Amiloride Figure 4.10 RT-PCR validation of BCL2L1Compare the experimental RT-PCR results with our calculated results. In control sample, RT-PCR products show that the long isoform expression is higher than the short isoform expression. In our calculated results, the long isoform expression is 3.23949 (1.93635+ 1.30314) and
the short isoform expression is -2.56471 (-1.91781+ -0.6469). Our calculated results agree approximately with RT-PCR validation.
In amiloride sample, RT-PCR products show that the long isoform expression is higher than the short isoform expression. In our calculated results, the long isoform expression is 2.975571 (2.53611+0.439461) and the short isoform expression is -2.57281 (-2.18694+ -0.38587). Our calculated results agree approximately with RT-PCR validation.
Compare the control sample with amiloride sample. In our calculated results, the difference value of the two isoform of control sample ( |3.23949--2.56471|=5.8042 ) is larger than amiloride sample ( |2.975571 - -2.57281 |=5.548381 ).
4.2.3 HIPK3
The relationships between RT-PCR validation and our computed results are depicted in Fig. 4.11.
=
×
10 99 87 81 11 47 96 62 3 11 47 96 62 9 26 27 33 0 38 01 71 10 m R N A ID 3325910 3325911 3325912 3325924 3325929 3325930 3325935 3325936 3325937 3325938 3325939 3325940 3325941 3325944 3325945 3325946 3325947 3325948 3325949 3325950 3325951 3325953 3325954 3325956 3325957 3325958 3325959 0 0 1 1 0 0 0 1 1 0 0 0 1 1 0 0 0 1 1 1 0 1 1 1 1 0 1 1 1 1 1 0 0 0 0 1 1 1 1 1 1 1 1 1 1 0 1 1 1 1 0 1 1 1 1 0 1 1 1 1 0 1 1 1 1 0 1 1 1 1 0 1 1 1 1 0 1 1 1 1 0 1 1 1 1 0 1 0 1 0 0 1 1 1 1 0 1 1 1 1 0 1 1 1 1 0 1 1 1 1 0 1 1 1 1 0 1 1 1 0 0 0 1 1 1 0 0 1 1 1 0 0 1 1 1 probe set ID HuEx _ H uh 7_ C HuE x _ H uh 7_ A 630190 630190 630190 630201 630206 630206 630209 630210 630211 630211 630212 630213 630214 630217 630218 630218 630219 630220 630221 630221 630222 630224 630225 630227 630228 630229 630229 Exon_ID 11 10 12 H u Ex_H uh 7_ Co nt ro l H uEx_H uh 7_ A m il o ri d e -2.06042 -1.28797 -0.04534 3.18667 -2.30869 -0.69237 1.89762 1.58485 -0.25007 -3.14236 0.865316 0.721087 -6.72894 -4.21869 -0.85519 -1.32581 0.28488 -0.19078 0.376701 0.18872 0.967621 -0.00154 -1.24171 -4.14097 -0.585 -1.21281 -0.39982 -1.47455 -1.33163 -1.28951 -1.25597 -2.10656 0.265904 0.503262 -2.9089 -0.56769 -0.50733 -2.1191 0.311306 -0.18075 -0.40262 -1.93251 0.608805 0.501447 0.86602 0.504132 0.658697 -1.79186 -0.28518 -2.10233 0.046853 -1.96302 -0.54273 -3.83988 -2.60148 -1.28782 0.316934 0.202517 2.20781 0.557292 -3.22413 -0.75383 0.951356 -0.94172 10998781 114796623 114796629 2627330 38017110 U- EXON-5' U- EXON-3' primer Control Amiloride
Figure 4.11 RT-PCR validation of HIPK3
Compare the experimental RT-PCR results with our calculated results. In control sample, RT-PCR products show that the short isoform expression is higher than the long isoform expression. In our calculated results, the short isoform expression is -0.384428(-0.94172+0.557292) and the long isoform expression is -0.551313(-0.75383+0.202517). Our calculated results agree approximately with RT-PCR validation.
In amiloride sample, RT-PCR products show that the short isoform expression is higher than the long isoform expression. In our calculated
results, the short isoform expression is 3.159166(0.951356+2.20781) and the long isoform expression is -2.907196(-3.22413+0.316934). Our calculated results agree approximately with RT-PCR validation.
Compare the control sample with amiloride sample. In our calculated results, the difference value of the two isoform of amiloride sample ( |-2.907196 - 3.159166 |=6.066362 ) is larger than control sample ( | -0.551313--0.384428|=0.166885).
4.2.4 MST1R
The relationships between RT-PCR validation and our computed results are depicted in Fig. 4.12. Because of the short isoform may be a new isoform, we make an assumed isoform skipped exon 11. Least square error is 79.7171.
A literature survey was carried out on the short isoform concerning. There are some related studies about
MST1R isoform
. Collesi, Santoro et al. [35] reported aMST1R
transcript missing a 147-bp cassette exon.=
×
36 109 ;4 505 26 4 ass um ed i s o fo rm mR N A I D probe set ID Hu E x _ H uh 7_C Hu E x _ H uh 7_A 2674958 2674957 2674956 2674955 2674954 2674953 2674952 2674951 2674950 2674949 2674948 2674947 2674946 2674945 2674943 2674941 2674939 2674938 2674934 2674933 2674931 2674930 2674929 2674928 2674927 2674925 1 1 1 1 1 1 1 1 1 1 1 1 1 1 1 1 1 1 1 1 1 1 1 1 1 1 223945 223944 223944 223943 223942 223941 223940 223939 223938 223937 223936 223936 223936 223935 223934 223934 223933 223933 223931 223930 223928 223927 223926 223926 223926 223926 Exon_ID HuEx _ H uh 7_Co nt ro l HuEx _ H uh 7_A m il o ri de -0.23866 -0.1534 1.22553 1.30288 0.019286 -0.07115 -0.14227 -0.40531 0.941227 -0.75568 0.810144 0.643763 -0.1956 -0.35538 -0.69905 -0.35459 -1.07866 -2.1019 -2.81946 -2.08217 1.01519 -0.13757 0.58675 1.16443 -1.45415 -2.86797 0.839422 1.40163 1.11446 0.911959 -0.63474 -1.63112 -1.30345 -1.09445 -0.34878 -1.55134 -2.11589 -2.38175 -1.0695 -1.27167 -0.44403 -1.54298 -0.66126 0.067933 -1.4469 -2.04921 0.352437 1.13915 0.695923 1.69815 -3.29809 -3.19321 -1.27268 -2.13325 0.825711 1.44854 1 1 1 1 1 1 1 1 1 1 1 1 1 0 1 1 1 1 1 1 1 1 1 1 1 1 11 10 12 Ron-2507-5' Ron-2991-3' primer 36109;4505264 assumed isoform Control Amiloride Figure 4.12 RT-PCR validation of MST1RCompare the experimental RT-PCR results with our calculated results. In control sample, RT-PCR products show that the long isoform expression is higher than the short isoform expression. In our calculated results, the long isoform expression is 1.44854 and the short isoform expression is -2.13325. Our calculated results agree approximately with RT-PCR validation.
In amiloride sample, RT-PCR products show that the long isoform expression is higher than the short isoform expression. In our calculated
results, the long isoform expression is 0.825711 and the short isoform expression is -1.27268. Our calculated results agree approximately with RT-PCR validation.
Compare the control sample with amiloride sample. In our calculated results, the difference value of the two isoform of control sample ( | 1.44854--1.44854|=2.89708 ) is larger than amiloride sample ( |0.825711 - -1.27268 |=2.098391 ).
Chapter 5 Discussion
5.1 Limitations of our method
Our method is limited by known isoform sequences collected by database. We use known isoform sequences to generate matrix E. If a gene has unknown isoform sequences, our method can not calculate the effect of unknown isoforms.
5.2 Future Works
There are several extensions of our method. We can select skipped exon and back to exon sequence or sequences flanking it to find the regulatory elements like some motifs in advance. Alternative 3’ splice sites, alternative 5’ splice sites, mutually exclusive exons and intron retention also can be analyzed, and found motifs.
Improve our prepossessing database, such as ample isoforms collecting.
Furthermore, we plan to integrate our method and ExonDB into an alternative splicing study system. The system can provide automatic information about exons of the isoforms, and calculated isoform expression. Based on our method, maybe we can develop a new method
Chapter 6 Conclusions
We propose and implement a method to determine different isoform expression of the exon array. We use matrix P (Probeset expression data) and matrix E (Exon profile) to compute matrix I (Isoform expression) by OSA. After several case studies for experimenting our method, all of calculated results agree approximately with RT-PCR validation. In summary, the main contribution of this thesis is to provide a model to calculate isoform expression of the exon array.
References
1. International_Human_Genome_Sequencing_Consortium, Finishing the euchromatic sequence of the human genome. Nature, 2004. 431(7011): p.
931-45.
2. Lander, E.S., et al., Initial sequencing and analysis of the human genome. Nature, 2001. 409(6822): p. 860-921.
3. Venter, J.C., et al., The sequence of the human genome. Science, 2001.
291(5507): p. 1304-51.
4. Modrek, B. and C. Lee, A genomic view of alternative splicing. Nat Genet, 2002. 30(1): p. 13-9.
5. Garcia-Blanco, M.A., A.P. Baraniak, and E.L. Lasda, Alternative splicing in
disease and therapy. Nat Biotechnol, 2004. 22(5): p. 535-46.
6. Allison, D.B., et al., Microarray data analysis: from disarray to consolidation
and consensus. Nat Rev Genet, 2006. 7(1): p. 55-65.
7. Affymetrix:, Affymetrix. Exon Array design datasheet. [http://www.affymetrix.com/support/technical/datasheets/exon_arraydesign_d atasheet.pdf], 2005.
8. Edwards, J.G.a.D.J., Use of an Exon Software Package to Identify Global Gene Splicing and Gene Expression Regulation. AMERICAN
BIOTECHNOLOGY LABORATORY, 2007.
9. Benson, D.A., et al., GenBank. Nucleic Acids Res, 2007. 35(Database issue): p. D21-5.
10. Kulikova, T., et al., The EMBL Nucleotide Sequence Database. Nucleic Acids Res, 2004. 32(Database issue): p. D27-30.
11. Shin'i, T. and T. Gojobori, [DDBJ database and genetic information analysis
softwares]. Tanpakushitsu Kakusan Koso, 1994. 39(11): p. 1927-43.
12. Wheeler, D.L., et al., Database resources of the National Center for
15. S.-Y. Ho, T.-K.C., and S.-J. Ho, Design of High Performance Fuzzy
Controllers Using Flexible Parameterized Membership Functions and Intelligent Genetic Algorithms. Proceedings of Congress on Evolutionary
Computation, 2002: p. 1378-1383.
16. Affymetrix:, NetAffx™ Analysis Center.
[http://www.affymetrix.com/support/technical/datasheets/netaffx_datasheet.pd f], 2002.
17. Huang, H.D., et al., ProSplicer: a database of putative alternative splicing
information derived from protein, mRNA and expressed sequence tag sequence data. Genome Biol, 2003. 4(4): p. R29.
18. Florea, L., et al., A computer program for aligning a cDNA sequence with a
genomic DNA sequence. Genome Res, 1998. 8(9): p. 967-74.
19. Huang, H.D., et al., SpliceInfo: an information repository for mRNA
alternative splicing in human genome. Nucleic Acids Res, 2005. 33(Database
issue): p. D80-5.
20. Thanaraj, T.A., et al., ASD: the Alternative Splicing Database. Nucleic Acids Res, 2004. 32(Database issue): p. D64-9.
21. Lee, C., et al., ASAP: the Alternative Splicing Annotation Project. Nucleic Acids Res, 2003. 31(1): p. 101-5.
22. Modrek, B., et al., Genome-wide detection of alternative splicing in expressed
sequences of human genes. Nucleic Acids Res, 2001. 29(13): p. 2850-9.
23. Gelfand, M.S., et al., ASDB: database of alternatively spliced genes. Nucleic Acids Res, 1999. 27(1): p. 301-2.
24. Dralyuk, I., et al., ASDB: database of alternatively spliced genes. Nucleic Acids Res, 2000. 28(1): p. 296-7.
25. Burset, M., I.A. Seledtsov, and V.V. Solovyev, SpliceDB: database of
canonical and non-canonical mammalian splice sites. Nucleic Acids Res,
2001. 29(1): p. 255-9.
26. Bollina, D., et al., ASGS: an alternative splicing graph web service. Nucleic Acids Res, 2006. 34(Web Server issue): p. W444-7.
27. Holste, D., et al., HOLLYWOOD: a comparative relational database of
alternative splicing. Nucleic Acids Res, 2006. 34(Database issue): p. D56-62.
28. Castrignano, T., et al., ASPIC: a web resource for alternative splicing
prediction and transcript isoforms characterization. Nucleic Acids Res, 2006.
34(Web Server issue): p. W440-3.
29. Bonizzoni, P., R. Rizzi, and G. Pesole, Computational methods for alternative
splicing prediction. Brief Funct Genomic Proteomic, 2006. 5(1): p. 46-51.
interpretation of Affymetrix exon array data. Genome Biol, 2007. 8(5): p. R79.
31. Kapur, K., et al., Exon array assessment of gene expression. Genome Biol, 2007. 8(5): p. R82.
32. Xing, Y., K. Kapur, and W.H. Wong, Probe selection and expression index
computation of affymetrix exon arrays. PLoS ONE, 2006. 1: p. e88.
33. Gardina, P.J., et al., Alternative splicing and differential gene expression in
colon cancer detected by a whole genome exon array. BMC Genomics, 2006.
7: p. 325.
34. Maglott, D., et al., Entrez Gene: gene-centered information at NCBI. Nucleic Acids Res, 2007. 35(Database issue): p. D26-31.
35. Collesi, C., et al., A splicing variant of the RON transcript induces constitutive
tyrosine kinase activity and an invasive phenotype. Mol Cell Biol, 1996.
![Table 1.1 Splicing trans-acting factors associated with human disease[5]](https://thumb-ap.123doks.com/thumbv2/9libinfo/8701689.199278/17.892.90.846.107.433/table-splicing-trans-acting-factors-associated-human-disease.webp)
![Figure 1.6 A sample gene of interest with three exons[8]](https://thumb-ap.123doks.com/thumbv2/9libinfo/8701689.199278/19.892.168.704.292.719/figure-sample-gene-exons.webp)
![Figure 1.7 Array PSR (probe selection region)[7]](https://thumb-ap.123doks.com/thumbv2/9libinfo/8701689.199278/20.892.170.782.110.328/figure-array-psr-probe-selection-region.webp)
![Figure 2.1 Flowchart of OSA[14, 15]](https://thumb-ap.123doks.com/thumbv2/9libinfo/8701689.199278/24.892.137.761.445.962/figure-flowchart-of-osa.webp)