A method for measuring the concentration of a solution
Der-Chin Su*, Kun-Huang Chen, and Cheng-Chih Hsu
Institute ofElectro-Optical Engineering, National Chiao Tung University,
ABSTRACT
When a linearly polarized light beam enters a surface-plasmon-resonanse (SPR) apparatus and is incident on the boundary surface with tested solution at the resonant angle, the phase difference between s- and p- polarizations is changed with the concentration of the solution. And the phase difference can be measured accurately by the heterodyne interferometry. Based on these effects, a method for measuring the concentration of a solution is presented.
Keywords: Surface-plasmon reson ance, Heterodyne interferometry, Concentration.
SUMMARY
A schematic diagram of our method is designed and shown in Fig. 1. The heterodyne light source1 consists of a linearly polarized laser, a half-wave plate H, and an electro-optical modulator EU driven by a function generator FG. The angular frequency difference between s- and p- polarizations is co. A light beam coming from this heterodyne light source enters the SPR apparatus2 being an isosceles right-angle prism with a thin metal film deposited on the hypotenuse surface being contacted with the test solution. Ifthe light beam is incident at the resonant angle O on this boundary surface, then the reflection coefficients r and r, ofp- and s- polarizations ofthe reflected light can be derived from the Aiiy's formulas3,
and can be written as .k
r0+re2d
i
(1)JJ = q i2kd e
q
(q s),
r011 2e
wherer01andr12arethe reflection coefficients ofprism-metal boundary and metal-solution boundary. respectively, d is the
thickness of metal film, k is the wave vector in metal, q, and arethe phases of s- and p- polarizations of the reflected light., and q$ is the phase difference between s- and p- polarizations, respectively.
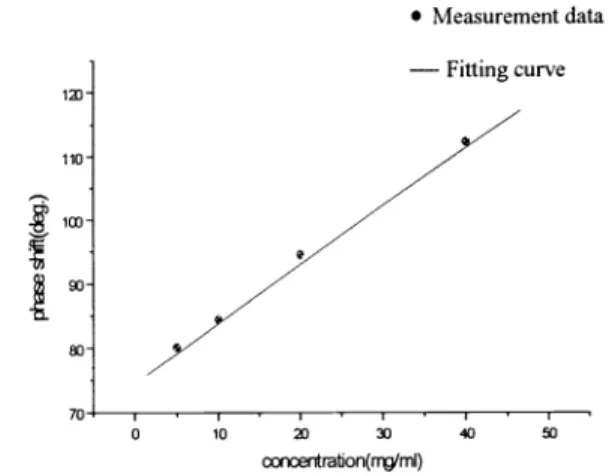
From these equations, it is clear that q5 is dependent on the refractive index of the tested solution and the refractive index is related to its concentration4. Consequently it can be seen that q$ is dependent on the concentration. Next the reflected light passes an analyzer AN with the transmission axis at a to the horizontal axis and is detected by a photodetector D. Then the intensity measured by D is the test signal and can be derived as
=1E11 = cos2a + 2 sin2 a +2rr cosasinacos(cot + q5)J (2)
On the other hand, the electrical signal generated by the function generator FG is filtered and becomes the reference signal. It has the form as
*[email protected], phone +886-3-573-1951; fax +886-3-571-6631; National Chiao Tung Univ., 1001 Ta-Hsueh Rd., Hsin-Chu 300, Taiwan, R.O.C.
19th Congress of the International Commission for Optics: Optics for the Quality of Life, Giancarlo C. Righini, Anna Consortini, Editors, SPIE Vol. 4829 (2003) © 2003 SPIE · 0277-786X/03/$15.00 872
I, =