The Potential of Using Inter-Vehicle
Communication to Extend the Coverage Area of
Roadside Wireless Access Points on Highways
S.Y. Wang
shieyuan@cs.nctu.edu.tw
Department of Computer Science
National Chiao Tung University
Hsinchu, Taiwan
Abstract—Intelligent Transportation Systems (ITS) is an
im-portant research topic. One goal of ITS is to provide Internet access services for vehicle drivers and passengers. Deploying many roadside wireless access points along a highway may be able to provide such a service on the highway. However, due to the short transmission range of these wireless access points, such an approach may incur much deployment cost. This paper investigates the potential of using inter-vehicle communication to extend the coverage area of roadside access points on highways.
I. INTRODUCTION
One important function of Intelligent Transportation Sys-tems (ITS) is to provide a cost-effective Internet access service for vehicle drivers and passengers. Such a service may be provided by using different wireless network technologies. For example, wide-area GPRS/3G cellular networks or local-area wireless LAN networks may be used. Each kind of the two approaches has its own advantages and disadvantages. This paper focuses on the local-area wireless LAN networks approach. In such an approach, a large number of IEEE 802.11(a/b/g) wireless access points are deployed along the highway to provide Internet access services.
Recently, inter-vehicle communications (IVC) has attracted the interests of many automobile manufacturers and re-searchers. In such a scheme, each vehicle is equipped with a wireless radio. A vehicle can use the radio to send its messages, receive messages from other vehicles, or forwards messages of other vehicles. The vehicles on the roads dynam-ically form a mobile ad hoc network (MANET) at any time. Information can be distributed, acquired, or exchanged on top of this network. Such an information network is a type of MANET. In the following of this paper, for brevity, we will simply call such a vehicle-formed MANET an IVC network. Since IVC can be used to forward messages among vehicles, it can assist roadside access points in relaying packets to vehicles. In this scheme, if an access point would like to forward a packet to its destination vehicle, the access point can transmit the packet to any vehicle within its wireless transmission range. This nearby vehicle then uses IVC to forward the packet to another vehicle closer to the destination vehicle. This forwarding process repeats until the packet
finally reaches its destination vehicle. Several routing protocols have been proposed (e.g., [1] ) to effectively forward packets among vehicles.
This paper investigates the potential of using IVC to extend the coverage area of roadside access points. The study is focused on whether IVC can allow us to increase the distance between two neighboring access points without significantly shortening the lifetime of connections set up between a vehicle and an Internet server. If this approach is feasible, the cost for installing many access points can be reduced. In addition, the cost incurred in providing power to access points, connecting them to the Internet, maintaining them, etc. can also be reduced.
In this paper, we make the following contributions. We use a more realistic vehicle mobility trace generated by the VISSIM [2] microscopic traffic generator to conduct simula-tion studies and provide quantitative performance results. Our simulation results show that, when the radio penetration rate is high enough, using IVC can extend the coverage area of wireless access points without significantly degrading network performances.
The rest of the paper is organized as follows. Section II surveys related work. Section III describes the simulation environment and settings. Section IV explains the performance metrics used in this study and presents the results. Finally, we conclude the paper in Section V.
II. RELATED WORK
In the literature, several papers have discussed and studied the applications of MANET to IVC networks. Due to paper length limit, we can only briefly describe them here.
In [3], the authors presented the framework and components of their “Fleetnet” project, which aims to efficiently exchange information among vehicles. In [4], the authors proposed a GPS-based message broadcasting method for inter-vehicle communication. In [5], the authors proposed a GPS-based unicast routing scheme for cars using a scalable location service.
In [6], the authors showed that messages can be delivered more successfully, provided that messages can be stored
temporarily at moving vehicles while waiting for opportunities to be forwarded further. In [7], [8], the authors studied how effectively a vehicle accident notification message can be distributed to vehicles inside a relevant zone. In [9] , the authors studied the lifetime of routes in ad hoc networks assuming that node mobility can be described by a mathematic model.
In [10], the authors compared the packet delivery ratio of a location-based routing protocol with that of a topology-based routing protocol on a simulated IVC network. In [11], the authors proposed a position-based routing protocol for IVC networks in city environments. In [12], the author studied the effectiveness of distributing information on an IVC network.
Most of the above work focus on setting up and maintaining a routing path between two vehicles in an IVC network. In contrast, this paper differs from these work in that it investigates the potential of using IVC to extend the coverage area of roadside wireless access points.
Recently, in [13] the authors studied the strategy used to deploy wireless access points for outdoor wireless local area networks. Although they also studied the effects of AP (access point) distance on the performance of an outdoor wireless local area network, there are some important differences between the two papers. First, the approach taken in their paper (analytical) is different from that taken in this paper (trace-based simulation). Second, the performance metrics studied in their paper (throughput, link utilization) are also different from those studied in this paper (connection setup blocking probability, connection lifetime, connection hop count).
Recently, some location-aware routing protocols (e.g., [14]) have been proposed to use mobile nodes’ location information to greedily route packets toward their destination nodes. This type of routing protocols do not need to install states in mobile nodes to find a path, set up a path, and maintain a path as traditional routing protocols do (e.g., [15] and [16]). Although location-aware routing protocols are different from traditional routing protocols, using which specific routing protocol is irrelevant to the results reported in this paper. This is because in this paper we assume that an ideal routing protocol is used, which can immediately detect routing path breakage and set up a new routing path between any two nodes.
III. SIMULATIONSETTINGS
A. Traffic Simulator
The microscopic traffic simulator that we used to generate mobility traces of vehicles is VISSIM 3.60, which is a commercial software developed by PTV Planung Transport Verkehr AG company, located in Germany. VISSIM uses the psycho-physical driver behavior models developed by Wiede-mann [17], [18] to model vehicles moving on the highways. This includes acceleration/deceleration, car-following, lane-changing, and other driver behaviors. Stochastic distributions of speed and spacing thresholds can be set for individual driver behavior. According to the user manual, the models have been calibrated through multiple field measurements at the Technical University of Karlsruhe, Germany. In addition,
field measurements are periodically performed to make sure that updates of model parameters reflect recent driver behavior and vehicle improvements.
B. Highways System
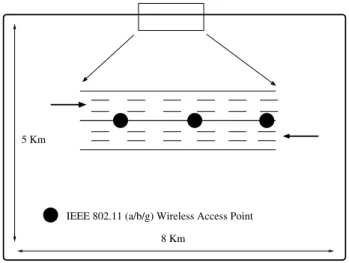
The topology of the highway used in this study is depicted in Figure 1. It is a rectangular closed system with 4 circular corners and has 3 lanes in each direction. Its length and width are 8 Km and 5 Km, respectively. The width of each lane is 3 meters. There are no entrances and exits on this highway system.
Although the chosen highway topology may not be very realistic compared to highways in the real world, we think that their difference is irrelevant from the viewpoint of DSRC (Dedicated Short Range Communication) [19], [20] wireless transmission. It is true that a real-world highway may not look like a rectangle and instead may have several curves. However, for the safety of high-speed driving, the radii of these curves usually are very large (e.g., a few kilometers). This property makes these curves effectively equivalent to straight lines when the 100-meter DSRC wireless transmission range is used.
Vehicles are injected into this system in both directions at the top-left corner. The injection rate is 1,000 vehicles per simulated hour in each direction. After all vehicles have entered the system, they move freely in the highway system according to their own desired speeds, vehicle characteristics, and driving behavior.
Since vehicles are assigned different desired speeds and different thresholds for changing lanes for achieving their desired speeds, a vehicle may thus (1) move at its desired speed when there is no slower vehicle ahead of it, (2) follow the lead vehicle patiently, which may happen when the lead vehicle is slower but the difference between the lead vehicle’s speed and its own desired speed is still tolerable, or (3) decide to change lanes to pass the lead vehicle if the speed difference is intolerable.
The vehicle mobility traces are taken after all vehicles have entered the highway system and have been moving for at least one simulated hour. Ten traces are taken and each one lasts for 300 seconds. In this paper, the reported performance results are averaged results from these traces. We have also computed the standard deviation of a performance metric from these traces. These standard deviations usually are less than 5% of their corresponding averages. To make performance curves easy to read rather than being cluttered up with standard deviation points, in the presented performance plots, only average points are plotted and standard deviation points are omitted.
Note that in this highway system, vehicles in different directions do not interact with each other. This is because in this topology a vehicle cannot leave the highway in one direction and then enter the highway in the opposite direction. C. Wireless Radio
The transmission range of the wireless radios used in both vehicles and roadside access points is chosen to be 100 meters.
IEEE 802.11 (a/b/g) Wireless Access Point 8 Km
5 Km
Fig. 1. The topology of the highway used in this study.
It is a reasonable setting for the DSRC standards proposed for ITS applications.
To determine the connectivity among vehicles and roadside access points, we took the following approach to determine whether or not two nodes can successfully exchange their messages. As long as two nodes are within each other’s wireless transmission range, it is considered that there is a wireless link between them and their packet exchanges can succeed. Otherwise, their packet exchanges will fail. This scheme is similar to that used in the ns-2 simulator [21], except that 250 meters is used as the transmission range of IEEE 802.11(b) wireless interfaces in ns-2.
D. Roadside Wireless Access Points
Along the highway, roadside wireless access points are de-ployed along the central divider of the highway (see Figure 1). We assume in this study that there is an Internet server and each deployed access point has a direct link connecting itself to this server.
Because the radio range is 100 meters, if the distance between two neighboring access points is less than 200 meters (2 * radio range), these access points will provide 100% coverage for vehicles. This will allow every vehicle to connect to the Internet server at any time, resulting in 0% connection setup blocking probability. Since this result is intuitive and uninteresting, the separation distances studied in this paper are all greater than 200 meters and they are 500, 1000, 1500, and 2000 meters, respectively.
E. Vehicle Traffic
In this study, the total number of vehicles moving on the highway is set to be 2,000 and a half of them move in each direction. The average distance between a vehicle and the vehicle immediately following it on the same lane can be calculated. It is (26 Km/lane * 3 lanes/direction)/ (1,000 vehicles/direction) = 78 meters. This car-following distance is typical of a highway in which many vehicles use the highway but they move smoothly without congestion.
The desired speeds chosen for these vehicles determine the absolute speeds of these vehicles and the relative speeds among them. The distribution of these desired speeds is set to be [20%: 100 - 110 Km/hr, 40%: 90 - 100 Km/hr, 20%: 80 - 90 Km/hr, 20%: 70 - 80 Km/hr], which means that 20% of the vehicles are moving at their desired speeds uniformly distributed between 100 Km/hr and 110 Km/hr, 40% of the vehicles are moving at their desired speeds between 90 Km/hr and 100 Km/hr, etc. We think that this distribution is typical of a highway in which various types of vehicles exist. F. Radio Penetration Rate
Radio penetration rate means the percentage of vehicles that are equipped with a wireless radio and participate in the IVC network. Because it is unrealistic to expect that on one day suddenly all vehicles on the roads will be equipped with a wireless radio to participate in the IVC network, we varied this parameter to see its effect. Seven different values were tested and they are 40%, 50%, 60%, 70%, 80%, 90%, and 100%, respectively.
For each radio penetration rate, a certain number of vehicles are randomly chosen to participate in the IVC network. For example, if the total number of vehicles on the highway is 2,000 and the radio penetration rate is 50%, we randomly chose 1,000 vehicles to participate in the IVC network. G. Inter-Vehicle Communication Function
The main goal of this paper is to see when wireless access points are separated far away and thus cannot provide an always-connected Internet access service for vehicles, how effectively IVC can increase the connection setup probability and connection lifetime as compared to the case without using IVC. Therefore, in our study sometimes we disabled or enabled the function of IVC to see its effects.
IV. PERFORMANCEMETRICS ANDRESULTS
A. Connection Setup Blocking Probability
In each second of a 300-second trace, each vehicle that participates in the IVC network will attempt to set up a connection with the Internet server via a roadside access point. If the IVC function is disabled, such a vehicle can exchange its packets with an access point only when it is within the wireless transmission range of that access point. In contrast, when the IVC function is enabled, even though such a vehicle is not within the wireless transmission range of an access point, it may still be able to exchange packets with that access point over an IVC path. In the IVC-disabled case, a connection setup request is considered blocked (failed) if there is no direct path between the vehicle and an access point. On the other hand, in the IVC-enabled case, a connection setup request is considered blocked if neither a direct path nor an IVC path exists between the vehicle and an access point.
For a specific radio penetration rate R, since there are (2,000 * R) vehicles participating in the IVC network, the total number of connection setup requests initiated during a 300-second trace is (300 * 2,000 * R) = (600,000 * R).
0 0.2 0.4 0.6 0.8 1 1.2 1.4 0 500 1000 1500 2000
Connection Setup Blocking Probability
Neighboring AP Distance
IVC function disabled
RPR = 100% RPR = 90% RPR = 80% RPR = 70% RPR = 60% RPR = 50% RPR = 40%
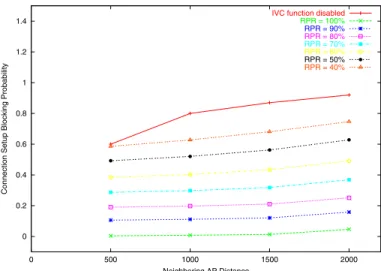
Fig. 2. Connection setup blocking probability under different radio penetra-tion rates and AP distances
The Connection Setup Blocking Probability (CSBP) of a trace is calculated as the number of blocked connection requests divided by (600,000 * R). The CSBP performance reflects the level of difficulty of connecting to the Internet while a vehicle is moving on the highway.
Figure 2 shows the CSBP performances under different radio penetration rates and AP distances. One sees that when the IVC function is disabled, the CSBP is quite high when neighboring access points are separated by a distance larger than the wireless transmission range (which is 100 meters). Theoretically, when the IVC function is disabled and the neighboring access point distance is X meters, on average 1 − (2 ∗ 100/X) percentage of the total vehicles are not within the radio range of any access point. As such, when the neighboring access point distance are 500, 1000, 1500, and 2000 meters, the corresponding CSBP should be 60%, 80%, 87%, and 90%, respectively. One sees that the simulation results match the theoretical results accurately.
When the radio penetration rate is 100% and the IVC function is enabled, the CSBP drops significantly to only 0.3%, 0.7%, 1.3%, and 4.6% when the neighboring access point distance are 500, 1000, 1500, and 2000 meters, respectively. This shows that using IVC can extend the coverage area of roadside access points. As expected, when the radio penetra-tion rate decreases, the effectiveness of IVC decreases. The CSBP curves of different radio penetration rates clearly show this trend.
B. Connection Lifetime
The second performance metric is the average lifetime of all connections that can be set up during a 300-second trace. When the IVC function is disabled, the lifetime of a connec-tion between a vehicle and the Internet server starts/ends when the vehicle moves into/out of the radio range of a roadside access point. This is because the studied AP distances are all greater than the radio range and thus access points do not provide 100% coverage. On the other hand, when the IVC
function is enabled, we define the lifetime of a connection between a vehicle and the Internet server as the duration in which there exists an IVC path between them. That is, during this period these two nodes can find an IVC path to exchange their messages, even though this IVC path may need to be changed during this period. Note that such a path can be as simple as a direct link between the vehicle and a roadside access point.
Because every vehicle that participates in the IVC network attempts to set up a connection in every second of a 300-second trace, if the integrated “IVC + roadside access points” network can enable all such vehicles to connect to the Internet at all time during the trace period, the connections set up in the i’th second of the trace will have a lifetime of (300-i) seconds. This means that the average lifetime of all connections in such an ideal case is 150 seconds. We will use this number (150 seconds) as the base when evaluating the potential of IVC to extend connection lifetime.
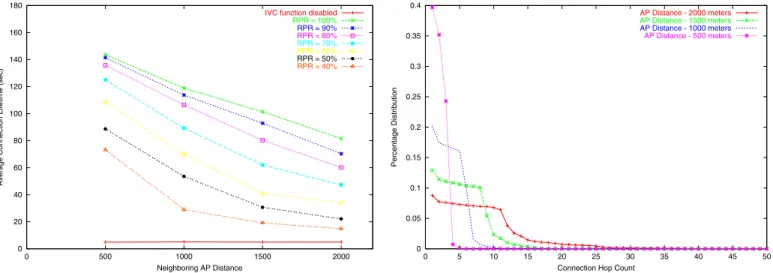
Figure 3 shows the average connection lifetime under dif-ferent radio penetration rates and AP distances. One sees that without the assistance of IVC, the average connection lifetimes are very short. Actually, they are only 4.95, 5.13, 4.96, and 5.01 seconds when the AP distances are 500, 1000, 1500, and 2000 meters, respectively. These numbers are close to theoretical results and we explain the reasons below.
Since the radio range of an access point is only 100 meters, the maximum duration that a vehicle can continuously connect to an access point is only (200 meters / its moving speed). According to the vehicle desired speed distribution presented in Section III-E, the average speed of a vehicle on the studied highway is (0.2 * 105 + 0.4 * 95 + 0.2 * 85 + 0.2 * 75) = 91 Km/hr and this speed corresponds to 25.28 meter/sec. Based on this speed, the maximum connection lifetime without using IVC is only 7.91 seconds. Because the time granularity of our simulation is 1 second, the beginning of a connection lifetime may not be detected immediately and thus the maximum vehicle location error in 1 second can be up to 25.28 meters. Accounting for this fact, these IVC-disabled connection lifetimes are close to theoretical results. (They do not exactly match because the average speed used here is just a ballpark estimation.)
In contrast, when the IVC function is enabled and the radio penetration rate is 100%, the average connection lifetime increases significantly. Specifically, for the case of AP distance being 500 meters and the radio penetration rate being 100%, the average connection lifetime under such conditions ap-proaches 150 seconds, which is the theoretical maximum when there is 100% wireless coverage on the highway (we have explained the reason before). This case shows the potential of IVC to extend connection lifetime. As expected, when the radio penetration rate decreases, the effectiveness of IVC on extending connection lifetime gradually diminishes.
C. Connection Hop Count Percentage Distribution
Once a connection between a vehicle and the Internet server is set up, their messages can start to be exchanged over the
0 20 40 60 80 100 120 140 160 180 0 500 1000 1500 2000
Average Connection Lifetime (sec)
Neighboring AP Distance
IVC function disabled
RPR = 100% RPR = 90% RPR = 80% RPR = 70% RPR = 60% RPR = 50% RPR = 40%
Fig. 3. Connection lifetime under different radio penetration rates and AP distances
connection. This performance metric concerns the average number of hops that a vehicle’s message needs to traverse on the IVC network to reach any access point. If on average a message needs to traverse a large number of hops to reach an access point (or from an access point to reach the vehicle in the other direction), several problems may result. First, the message may be delayed by a large amount of time and this is bad for real-time applications such as using Skype to make an Internet phone call. Second, since each message needs to be rebroadcast many times on the IVC network, much network bandwidth will be wasted. Therefore, the average connection hop count should be as small as possible.
The hop count of a connection between a vehicle and the Internet server is defined to be the minimum number of hops that the vehicle’s message needs to traverse to reach any access point. It is the length of the shortest path from that vehicle to any access point. During the lifetime of a connection, its hop count may change due to the changes of the IVC network topology. Here we take the initial connection hop count as the hop count of a connection.
Figure 4 shows the percentage distribution of the connec-tion hop count under different AP distances when the radio penetration rate is 100%. This figure clearly shows that the average connection hop count under a specific AP distance is roughly equal to(AP distance/2)/100, where 100 is the radio range in meters. For example, when the AP distance is 1500 meters, most vehicles can use less than 8 hops to reach its nearest access point to send/receive a message. This trend is evidenced by the fact that the percentages of connection hop counts higher than 8 diminish very rapidly. One interesting finding is that the percentages of connection hop counts below this “threshold” are about the same. This means that below this “threshold,” the chance of using a certain number of hops to reach an access point is about the same for different number of hops. We note that the chance of a vehicle using a hop count larger than this threshold still exists, although it is small. The two access points closest to a vehicle are the one ahead of
0 0.05 0.1 0.15 0.2 0.25 0.3 0.35 0.4 0 5 10 15 20 25 30 35 40 45 50 Percentage Distribution
Connection Hop Count
AP Distance - 2000 meters
AP Distance - 1500 meters
AP Distance - 1000 meters
AP Distance - 500 meters
Fig. 4. The connection hop count percentage distribution under different AP distances (the radio penetration rate is 100%)
it and the one behind it. We call the one with the minimum distance to the vehicle the “near” access point and the other one the “far” access point for that vehicle. It is possible that a vehicle, although physically closer to its near access point, has no IVC path to connect to that access point but instead has a longer IVC path to connect to its far access point. D. Connection Lifetime v.s. Connection Hop Count
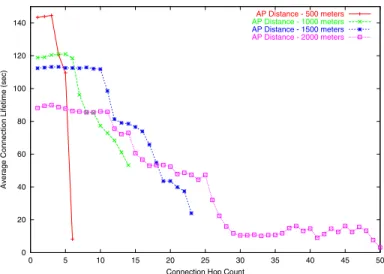
Figure 5 shows the relationship between connection life-time and their hop counts. As expected, when the connec-tion hop count increases, because a longer IVC path has a higher chance of path breakage, the corresponding connection lifetime decreases. As discussed before, mostly a vehicle should be able to connect to its near access point in about (AP distance/2)/100 hops, where 100 is the radio range in meters. From this figure, we see that there are connections whose hop counts are larger than this “threshold.” The reason has been explained before – sometimes a vehicle may have to connect to its far access point rather than to its near access point. This figure also shows that there are connections whose hop counts are larger than (AP distance/100) hops, which is the required hop count for a vehicle to connect to its far access point. To explain this, we note that the above equation gives the minimum number of hops for a vehicle to reach its far access point under the ideal condition. This is because in such a condition, every vehicle on an IVC path must be placed at a location such that their separation distances are exactly the radio range. In the real life, however, this phenomenon is very unlikely to occur because neighboring vehicles on an IVC path will likely be separated by a distance less than the radio range.
One interesting finding is that if the hop count of a con-nection is less than (AP distance/2)/100 hops (that is, a vehicle can connect to its near access point), the lifetime of connections with different hop counts are about the same. This finding parallels the previous finding that when the hop count of a connection is less than (AP distance/2)/100 hops, the
0 20 40 60 80 100 120 140 0 5 10 15 20 25 30 35 40 45 50
Average Connection Lifetime (sec)
Connection Hop Count
AP Distance - 500 meters
AP Distance - 1000 meters
AP Distance - 1500 meters
AP Distance - 2000 meters
Fig. 5. The relationship between connection lifetime and their hop counts under different AP distances (the radio penetration rate is 100%)
percentages of connections with different hop counts are about the same. Combining both findings, one sees that if a vehicle can use IVC to reach its near access point to make an Internet connection, despite the required number of hops to reach that access point, the chance of successfully establishing the connection and the lifetime of the established connection will be about the same.
V. CONCLUSIONS
In this paper, we investigate the potential of using inter-vehicle communication (IVC) to extend the coverage area of roadside wireless access points. We used a more realistic vehicle mobility trace generated by the VISSIM microscopic traffic simulator to conduct simulation studies. The system parameters studied include the radio penetration rate and the distance between neighboring access points.
Our quantitative results show that, if the radio penetration rate is high enough, one need not deploy a large number of roadside access points to provide 100% coverage. Instead, some of them may be saved with the assistance of IVC without significantly degrading network performances.
ACKNOWLEDGMENTS
This research was supported in part by MOE Program for promoting Academic Excellence of Universities under the grant number 94-E-FA06-4-4 and NSC under the grant number 95-2221-E-009-027.
REFERENCES
[1] S.Y. Wang, C.C. Lin, Y.W. Hwang, K.C. Tao, and C.L. Chou, “A Practical Routing Protocol for Vehicle-Formed Mobile Ad Hoc Networks on the Roads,” IEEE ITSC 2005 (International Conference on Intelligent Transportation Systems), September 13-16 2005, Vienna, Austria. [2] VISSIM 3.60 User Manual, PTV Planung Transport Verkehr AG
com-pany.
[3] Walter J. Franz, Hannes Hartenstein, Brend Bochow, “Internet on the Road via Inter-Vehicle Communications,” Workshop der Informatik 2001: Mobile Communications over Wireless LAN: Research and Appli-cations, Gemeinsame Jahrestagung der GI und OCG, 26-29 September 2001, Wien.
[4] Min-Te Sun, Wu-Chi Feng, Ten-Hwang Lai, Kentaro Yamada, Hiromi Okada, and Kikuo Fujimura, “GPS-Based Message Broadcasting for Inter-Vehicle Communication,” 2000 International Conference on Paral-lel Processing, pp. 279-287.
[5] Robert Morris, John Jannotti, Frans Kaashoek, Jinyang Li, and Douglas S. J. De Couto, “Carnet: A Scalable Ad Hoc Wireless Network System,” 9th ACM SIGOPS European workshop: Beyond the PC: New Challenges for the Operating System, Kolding, Denmark, September 2000. [6] Zong Da Chen, H.T. Kung, and Dario Vlah, “Ad Hoc Relay Wireless
Networks over Moving Vehicles on Highways,” The ACM Symposium on Mobile Ad Hoc Networking and Computing (MobiHoc 2001) Poster Paper, October 2001.
[7] Linda Briesemeister, Lorenz Schafers, and Gunter Hormmel, “Dissemi-nating Messages among Highly Mobile Hosts based on Inter-Vehicle Communication,” IEEE Intelligent Vehicle Symposium, pp. 522-527, October 2000.
[8] Linda Briesemeister and Gunter Hormmel, “Role-based Multicast in Highly Mobile but Sparsely Connected Ad Hoc Networks,” The First Annual Workshop on Mobile Ad Hoc Networking and Computing (MobiHoc 2000), August 2000.
[9] Damla Turgut, Sajal K. Das, and Mainak Chatterjee, “Loggevity of Routes in Mobile Ad Hoc Networks,” IEEE Vehicular Technology Conference Spring 2001, pp.2833-2837, May 6-9, 2001. Greece. [10] Holger Fuessler, Martin Mauve, Hannes Hartenstein, Michael
Kaese-mann, Dieter Vollmer, “MobiCom Poster: Location-Based Routing for Vehicular Ad-hoc Networks,” ACM SIGMOBILE Mobile Computing and Communications Review (MC2R) 7 (1), pp. 47-49, January 2003. [11] Christian Lochert, Hannes Hartenstein, Jing Tian, Holger Fuessler,
Dagmar Herrmann, Martin Mauve, “A Routing Strategy for Vehicular Ad Hoc Networks in City Environments,” IEEE Intelligent Vehicles Symposium (IV2003), pp. 156-161, Columbus, OH, June 2003. [12] S.Y. Wang, “On the Effectiveness of Distributing Information among
Vehicles Using Inter-Vehicle Communication”, IEEE ITSC’03 (Interna-tional Conference on Intelligent Transportation Systems), October 12-15, 2003, ShangHai, China.
[13] Jane-Hwa Huang, Li-Chun Wang and Chung-Ju Chang, “Deployment strategies of access points for outdoor wireless local area networks,” IEEE VTC Spring, Stockholm, May, 2005.
[14] Brad Karp and H.T. Kung, “Greedy Perimeter Stateless Routing for Wireless Networks,” ACM MobiCom 2000, Boston, MA, USA, August, 2000.
[15] Charles Perkins and Elizabeth Royer, “Ad Hoc On Demand Distance Vector Routing,” Second IEEE Workshop on Mobile Computing Sys-tems and Applications, February 1999.
[16] David B. Johoson and David A. Maltz, “Dynamic Source Routing in Ad Hoc Wireless Networks,” Mobile Computing, edited by Tomasz Imielinski and Hank Korth, Chapter 5, pp. 153-181, Kluwer Academic Publishers, 1996.
[17] Wiedemann, “Simulation des Strabenverkehrsflusses,” Schriftenreihe des Instituts fur Verkehrswesen der Universitat Karlsruhe, Heft 8, 1974. [18] Wiedemann, “Modeling of RTI-Elements on Multi-Lane Roads,” In:
Advanced Telematics in Road Transport, edited by the Comission of the European Community, DG XIII, Brussels, 1991.
[19] “EN 12253:2004, Dedicated Short-Range Communication - Physical layer using microwave at 5.8 GHZ,” European Standardization Orga-nization.
[20] “EN 12795:2002, Dedicated Short-Range Communication - DSRC Data link layer: Medium access and logical link control,” European Standard-ization OrganStandard-ization.
[21] The Network Simulator - ns-2, available at http://www.isi.edu/nsnam/ns. [22] Gavin Holland and Nitin Vaidya, Analysis of TCP Performance over Mobile Ad Hoc Networks, ACM MOBICOM’99, Seattle, Washington, USA, August 1999.
[23] J. Moy, “OSPF Version 2,” IETF RFC 2328, April 1998. [24] “IEEE 802.1D,” ANSI/IEEE Std 802.1D, 1998 Edition.