摻雜氧化鋅奈米微晶之表面穩定強誘電性液晶元件的分子排列與電性研究
90
0
0
全文
(2) 摻雜氧化鋅奈米微晶之表面穩定強誘電性液晶元件 的分子排列與電性研究 The Study of Molecular Alignment and Electrical Properties of Surface-Stabilized Ferroelectic Liquid Crystal with and without Doping of ZnO Nanocrystals. 研究生:李柳萱. Student:Liu-Shiaun Li. 指導教授:黃中垚. Advisors:Professor Jung Y. Huang. 國立交通大學電機資訊學院 光電工程研究所 碩士論文. A Thesis Submitted to Department of Photonics and Institute of Electro-optical Engineering College of Electrical Engineer and Computer Science National Chiao Tung University in Partitial Fulfillment of the Requirements for the Degree of Master in Electro-optical Engineering June 2006 Hsinchu, Taiwan, Republic of China. 中華民國九十五年六月.
(3) 摻雜氧化鋅奈米微晶之表面穩定強誘電性液晶元件的 分子排列與電性研究 研究生:李柳萱. 指導教授:黃中垚 教授 國立交通大學 光電工程研究所. 摘要 在液晶物理的研究上及與液晶元件的發展上,時常藉著摻雜奈米結構 粒子來改善液晶的分子排列與響應速度。本論文以摻雜氧化鋅奈米微 晶之表面穩定強誘電性液晶(或稱鐵電相液晶)元件為研究樣本,利用 影像式偏光量測系統、電容-電壓曲線、時析電光響應與時析偏振傅 立葉轉換紅外光譜等量測方法,針對分子排列、光學特性、電性及外 加驅動電壓下之動態響應,將摻雜氧化鋅奈米微晶之鐵電相液晶與未 摻雜之鐵電相液晶相互對照。我們發現摻雜氧化鋅奈米微晶後之表面 穩定鐵電相液晶,其整體液晶分子有較好的排列分布,且在無外加電 場下可提升其光穿透率達 2.27 倍;此外,摻雜氧化鋅奈米晶體後之 鐵電相液晶在外加相同驅動電場下,比未摻雜之強誘電性液晶元件反 應速度快 2 倍。對於動態電光時析響應、二維相關光譜分析與鐵電相 液晶的分子官能基排列與動態行為間的關係有深入的研究與討論。. i.
(4) The Study of Molecular Alignment and Electrical Properties of Surface-Stabilized Ferroelectic Liquid Crystal with and without Doping of ZnO Nanocrystals Student:Liu-Shiaun Li. Advisors:Professor Jung Y. Huang. Department of Photonics and Institute of Electro-optical Engineering, National Chiao Tung University. Abstract In order to improve the electro-optical properties and response time of FLC material, doping with nanostructured materials is a newly developed technique to achieve the goal. In this thesis, we compare electrical properties and electro-optical dynamics of the surface-stabilized ferroelectric liquid crystal (SSFLC) with doping of ZnO nanocrystals (nc-ZnO) and without doping. We use several kinds of techniques, including imaging polarimetry, C-V hysteretic characterization, time-resolved electro-optical response and time-resolved FTIR, to analyze the above mentioned properties. We find that the nc-ZnO doping can improve the azimuthal and the polar alignments of FLC by reducing the full-width-and-half-maximum (FWHM) width. The approach readily improves the optical transmission property of FLC by 2.27 times at no applied field and reduces the switching time of the electro-optical response by a factor of 0.5. By using 2D IR correlation, we discovered that ZnO nanocrystals produce a novel binding effect on sub molecular fragments of FLC molecules, which lead to an improved LC alignment quality in both steady-state and dynamic processes. ii.
(5) 誌謝. 這個研究能夠順利的完成,首先要感謝我的指導教授黃中垚老 師,在老師的悉心指導下,使我了解到做研究的精神是需要以嚴謹的 態度及細膩的觀察來完成,雖然實驗室的人數並不多,卻也藉此讓我 有更多學習的機會,最重要的是使我學會如何一個人去面對與解決問 題。感謝實驗室的文慈學姊、明彰學長以及立志學長平時對我的協 助,讓我在遇到問題時能夠有對象可以討論,也感謝雲漢、秉寬,跟 大家一起相處、成長的日子雖然很辛苦但也真的很開心有豐碩的果實 可以採收。. 感謝材料所黃華宗老師提供實驗室讓我使用,感謝洪金賢學長在 我遇到合成問題時不吝惜的教導我,感謝黃華宗老師實驗室所有學長 姐、同學以及學弟妹對我的配合。感謝顯示所陳皇銘老師提供儀器協 助我完成實驗方面的量測。感謝奇美電子以及 TTLA,在材料方面的 提供。. 最後要感謝我的爸媽、家人及緯仁,在我遭遇挫折時給予精神上 的鼓勵與支持,希望這份成果與你們共享。. iii.
(6) Contents Abstract (in Chinese). i. Abstract (in English). ii. Acknowledgement (in Chinese). iii. Contents. iv. List of Tables. vi. List of Figures. vii. 1. Introduction 1 1.1 The overview of LC Mesophases………………………………1 1.2 The overview of LC Optics…………………………………….4 1.3 The overview of SSFLC Devices………………………………6 1.4 Modification of an Existing FLC Material with Nanostructured Dopant………………………………………………………….8. 2. Sample Preparation and Electrical Characterization of SSFLC with and without nc-ZnO doping 10 2.1 Material Preparation and Optical Properties of nc-ZnO……...10 2.2 Preparation of SSFLC Cells with and without nc-ZnO Doping………………………………………………………...14 2.3 Alignment Quality Examination of SSFLC Cell with Imaging Polarimetry……………………………………………………17 2.4 Preisach Model and Equivalent Electronic Circuit of SSFLC Cell….………………………………………………………...25 2.5 Electrical Properties of SSFLC with and without nc-ZnO Doping………………………………………………………...31 iv.
(7) 3. Electro-Optical Switching Dynamics of SSFLC Cells with and without nc-ZnO doping 43 3.1 Model of Electro-Optical Response of a SSFLC Cell………..43 3.2 Time-Resolved Electro-Optical Response of SSFLC Cell.…..46 3.2.1 SSFLC cell with a driving voltage of 10V……………46 3.2.2 SSFLC cell with a driving voltage of 5V…………..…49 3.3 Time-Resolved Electro-Optical Response of SSFLC Cell with nc-ZnO Doping………………………………………………51 3.3.1 nc-ZnO doped SSFLC cell with a driving voltage of 10V…………………………………………………..….51 3.3.2 nc-ZnO doped SSFLC cell with a driving voltage of 5V…………………………………………………..….54. 4. Time-Resolved FTIR Spectroscopy of SSFLC with and without nc-ZnO Doping 57 4.1 Principle of FTIR……………………………………………..57 4.2 2D IR correlation technique……………………..……………61 4.3 FTIR Spectroscopy of SSFLC with and without nc-ZnO doping…………………………………………………………63 4.4 trFTIR of SSFLC with and without nc-ZnO doping………….69. 5. Conclusions and Future Prospect. References. 74 76. v.
(8) List of Tables 2-1 2-2 4-1. The fitting parameters of the pure SSFLC cell to Eq. (2-14) at different frequencies……...…………………………………………………………….36 The fitting parameters of the SSFLC cell with nc-ZnO doping to Eq. (2-14) at different frequencies………………………………………………………….38 Comparison of the spontaneous polarization and viscosity of the pure FLC , FLC with ethanol residue (add a few drops of ethanol and then dried in vacuum for 8 hours, middle) and FLC doped with 1.28% nc-ZnO (add a few drops of nc-ZnO ethanol solution and then dried in vacuum for 8 hours, left)…………………………………………………………………………70. vi.
(9) List of Figures 1-1 1-2 1-3 1-4 1-5 1-6 2-1 2-2 2-3 2-4 2-5 2-6. The molecular arrangement in the SmC, SmA, and nematic phases………….2 Twist of the molecules in the ordinary nematic and chiral nematic phases…...3 Twist of the molecules and the director in the SmC* phase. The chiral molecules rotate around the cone……………………………………………...4 An illustration of the LC cell inserted between a pair of crossed polarizers…..6 The basic geometry of a bookshelf SSFLC cell structure and its electro optic switch behavior between crossed-polarizers…………………………………..7 The two kind geometries of a chevron SSFLC cell structure applied with external electric fields…………………………………………………………7 UV-visible absorption spectra of TPM-caped ZnO nanoparticles in ethanol...12 The energy gap of the TPM-caped ZnO nanoparticle colloid was deduced from UV-visible absorption spectra in ethanol…………………………………….13 Photoluminescence spectrum of TPM-caped ZnO nanoparticles in ethanol…13 Schematic of an imaging polarimetric apparatus used in this study………….17 Determination of β and d from optical intensity pattern measured on a birefringent film……………………………………………………………...20 The geometry of an incident optical beam on a uniaxial crystal film…….…21. 2-7. The distribution of the azimuthal angle β of the SSFLC with (dash line) and without (solid line) nc-ZnO doping…………………………………………..23. 2-8. The 2D distributions of the azimuthal angle β of (a) the SSFLC, (b) nc-ZnO-doped SSFLC cells…………………………………………………..23 The measured images of the SSFLC test cells with and without nc-ZnO doping at five different orientations of the analyzer.…………………………………23 The distribution of the pretilt angle γ = π 2 − α of the SSFLC test cells with. 2-9 2-10 2-11 2-12 2-13 2-14. 2-15. (dashed line) and without (solid line) nc-ZnO doping………………………24 The measured images of the SSFLC with and without nc-ZnO doping at five different incident angles to deduce polar angle………………………………25 The equivalent electronic circuit model of a SSFLC cell…………………….26 The capacitance-voltage (C-V) curves of (a) the empty cell, (b) the cell filled with FLC at four different frequencies……………………………………….26 The measured current-voltage (I-V) curves of the empty cell (circle-symbol) and the filled SSFLC cell (square-symbol) plotted as a function of applied voltage………………………………………………………………………28 Hysteresis of macroscopic polarization P(E) (top) and dielectric susceptibility χ(E) = ∂ P/ ∂ E (bottom) for an FLC cell………………………………..…….29. vii.
(10) 2-16 2-17 2-18 2-19. 2-20 2-21 2-22. 2-23. 3-1 3-2 3-3. 3-4. 3-5. 3-6. 3-7. The capacitance (CLC) versus the applied voltage on the pure SSFLC cell without doping at four different frequencies…………………………………32 The capacitance (CLC) versus the applied voltage on the nc-ZnO doped SSFLC cell at four different frequencies……………………………………………...33 The experimental C-V curves (open symbols) and the fitting curves (solid lines) of the SSFLC test cells without and with nc-ZnO doping cells at 100Hz……34 The fitting results of the measured data of (a) the SSFLC cell, and (b) the SSFLC cell with nc-ZnO doping at 100Hz. The solid lines are the fitting curve and the symbols are the measured data………………………………………35 The experimental C-V curves (empty symbols) and their fitting results (solid lines) of the SSFLC cells without and with nc-ZnO doping at 1 kHz………..39 The fitting curves to Eq. (2-14) of (a) the SSFLC cell and (b) the SSFLC cell with nc-ZnO doping at 1 kHz. The symbols are the measured data……….....39 The experimental C-V curves (open symbols) and the fitting curves (solid lines) of the SSFLC cells without (square) and with (triangle) nc-ZnO doping at 10 kHz……………………………………………………………………………40 The experimental C-V curves (open symbols) and the fitting curves (solid lines) of the SSFLC cells without (square) and with (triangle) nc-ZnO doping at 100 kHz……………………………………………………………………………41 Schematic diagram showing the time-resolved electro-optical characterizing apparatus used in this study………………………………………………...43 Schematic diagram showing the orientational relationship between the molecular frame (ξ, η, ζ) and the sample frame (K, N, Z)……………………44 Time-resolved angular pattern (symbols) of optical transmission through a SSFLC cell with 10 V at 0 μsec and the corresponding fitting curve (solid line) to Eq. (3-4)……………………………………………………………………46 The transient electro-optical azimuthal patterns of a SSFLC cell recorded at five different delay times. The driving field is (a) +10V, (b) -10V square waveform with a field-on duration of 800μs…………………………………47 (a) Fitting parameters (symbols) of the time-resolved EO azimuthal patterns and the applied voltage (solid line) are plotted as a function of time. (b) The deduced orientation angle of the optic axis of FLC film is shown…………...48 The normalized transient electro-optical azimuthal patterns of a SSFLC cell at four different delay times. The driving field amplitude is (a) +5V, and (b) -5V. The rubbing direction of the FLC cell is set to at 0 degree…………………49 Comparison of the fitting parameters and deduced orientation angle at two different applied voltages. The curves with circles represent the data with ±10 V and the curves with star symbol are the data measured with ±5 V………50 viii.
(11) 3-8. 3-9. 3-10. 3-11. 3-12. 4-1 4-2 4-3. 4-4 4-5 4-6 4-7. 4-8. 4-9. The normalized transient electro-optical azimuthal patterns of the pure SSFLC (square symbol) and the SSFLC with nc-ZnO doping (circle symbol) cells aligned with RN1182 were presented at no driving field amplitude…………52 The normalized transient electro-optical azimuthal patterns of a SSFLC cell doped with nc-ZnO were presented at five different delay times. The driving field amplitude is (a) +10V, and (b) -10V………………………………….53 Comparing the parameters and deduced orientation angle of the optic axis of FLC film with two different cells at ±10 V, the square symbol was SSFLC and the triangle symbol was SSFLC with nc-ZnO doping………………………..54 The normalized transient electro-optical azimuthal patterns of a SSFLC with nc-ZnO doping cell are presented at four different delay times. The driving field amplitude is (a) +5V, and (b) -5V………………………………………55 Comparing the switching parameters and deduced orientation angle of nc-ZnO doped SSFLC cell with two different applied voltages. The curve with circle symbols is taken with ±10 V and the lines with star symbols is with ±5 V….56 The excitation of a vibrational state in the electronic ground state S0 by infrared absorption……………………………………………………………57 Schematic of a FTS system…………………………………………………...58 Typical setup for the asynchronous time-resolved FTIR. The signal-processing assembly for time-resolved measurement is shown on the middle, while the units constituting a conventional FTIR spectrometer are depicted in the boxes at the top and bottom…………………………………………………………59 (a) FTIR spectra and (b) autocorrelation plots of the SSFLC cells with and without nc-ZnO doping at 30oC……………………………………………....64 FTIR spectra and (b) autocorrelation plots of the SSFLC cells with and without nc-ZnO doping in the region of 1200 to 1650 cm-1 measured at 30oC……….65 FTIR spectra and (b) autocorrelation plots of the SSFLC cells with and without nc-ZnO doping in the region of 2800 to 3100 cm-1 measured at 30oC……….66 FTIR angular patterns of some IR active modes at (a) 1169 cm-1 (b)1250 cm-1 (c)1281 cm-1 (d)1391 cm-1 (e)1439 cm-1 (f) 1514 cm-1 (g) 1584 cm-1 (h) 1608 cm-1 measured on the SSFLC cells with and without nc-ZnO doping at 30oC…………………………………………………………………………..67 FTIR angular patterns of some IR active modes at (a) 2857 cm-1 (b)2931 cm-1 (c)2957 cm-1 measured on the SSFLC cells with and without nc-ZnO doping at 30oC…………………………………………………………………………..68 The dynamic curve of the averaged apparent angles of IR dipoles associated with the cores of the SSFLC cells with and without nc-ZnO doping measured at 30 o C. The waveform of the bipolar driving pulses is included for ix.
(12) 4-10. 4-11. comparison……………………………………………………………………70 The time courses of the synchronous correlation of the C-O-C stretch mode at 1252 cm-1 of the SSFLC with and without nc-ZnO (ZnO nanocystal solution) doping cells measured at 30oC. The waveform of the bipolar driving pulses is included for reference………………………………………………………...71 Time courses of 2D IR correlation phase angle generated from the time-resolved polarization-angle dependent spectrum of (a) SSFLC and (b) SSFLC with nc-ZnO doping cells measured at 30 °C………………………..73. x.
(13) Chapter 1 Introduction. 1.1 The Overview of LC Mesophases Liquid crystals (LC) are anisotropic fluids, with thermodynamically stable phases between the solid and the isotropic liquids. The LC phases can be classified with several kinds of sub phases with different molecular alignment orders. The typical LC molecules have the rod-like, discotic-like and the sanidic-like shapes. In this study, we focus on the rod-like molecules. The orientation of a rod-like molecule can be described by the two local axes, one parallel to the molecule noted as long axis, and the other perpendicular to it noted as short axis. Generally speaking, the LC molecules tend to align parallel to each other. There are two main LC phases: the nematic phase and the smectic phase. The former exhibits orientation order but no positional order, while the latter reveals both orientational and partial positional order [1-3]. In the nematic phase the molecular long axes are aligned, which result in an averaged direction n called the LC director. The orientation of the director represents the optic axis of the molecular thin film. The nematic phase is optical uniaxial because the two mutually independent directions perpendicular to the director are equivalent. The smectic phase can be further divided into smectic A and smectic C as shown in the Figure 1-1. In the smectic A phase (SmA), there exists the orientational order and positional order. The molecules are oriented parallel to each other and their position is ordered in layers with the layer spacing nearly equal to the molecular 1.
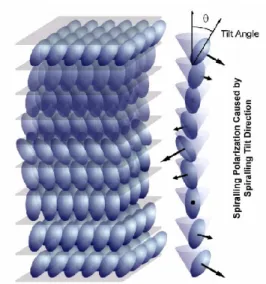
(14) length. The director n in this phase is parallel to the layer normal z and determines the optic axis of the system. The SmA phase is also optical uniaxial. The Smectic C phase (SmC) possesses both orientational and positional orders. The molecules in the SmC phase are arranged in layers but not free to rotate about their long axes. The molecular long axes are tilted in a direction respected to the layer normal. The angle between the director n and the layer normal z is defined as the tilt angle of the material θ. The director is confined to a conical surface with the conic axis along the layer normal. The movement of the director is confined on the smectic cone. The SmC phase is optical biaxial, but it may become uniaxial under specific circumstances. Many LC molecules usually have more than one kind of phase. Typically the phase sequence is a function of the temperature, as the following sequence: crystalline phase Cr-SmC-SmA-N-I isotropic phase (from low to high temperature).. Figure 1-1 The molecular arrangement in the SmC, SmA, and nematic phases. If the mirror symmetry elements are absent, the molecules would become chiral.. The chiral molecules and their mirror images cannot be superimposed by any translations or rotations. Doping chiral molecules into the achiral LC molecules in the nematic phase can form a so-called chiral nematic N* phase which possess twist structure as shown in the Figure 1-2. Chiral phases are usually labeled by an asterisk “*” following the phase symbol. The director in the N* phase, instead of being. 2.
(15) uniformly oriented, rotates in space about an axis perpendicular to n and forms a helical structure (helix). The distance, in which the director makes full 2π radians rotation along the helix axis, is called helical pitch p.. Figure 1-2 Twist of the molecules in the ordinary nematic and chiral nematic phases.. The ferroelectric SmC* phase can be obtained either by mixing chiral molecules with achiral LC molecules in SmC phase, or by synthesizing of a molecule with a chiral part including in the molecular structure. Molecules form a helicoidal structure similarly characterized by helical pitch and its sign. A spontaneous polarization Ps lying on the Smectic layer plane exhibits in the SmC* phase. The finding of Ps has been deduced from symmetry considerations [4]. In the SmC* phase, the molecules also tilt with respect to the layer normal when the helix axis is along the layer normal which is illustrated in Figure 1-3. The director slowly rotates around the smectic cone progressively from layer to layer. Since the helical pitch is in the order of micrometers, the director rotates around the full cone over several thousands smectic layers.. 3.
(16) Figure 1-3 Twist of the molecules and the director in the SmC* phase. The chiral molecules rotate around the cone.. 1.2 The Overview of LC Optics The essential properties of the LC are the optical, electric and magnetic anisotropy. Optical anisotropy means that the index of refraction of the material depends on the direction of light polarization. The LC (N or SmA) exhibits optical uniaxial symmetry with two principal refractive indices no and ne. The ordinary refractive index no is for light with electric field polarization perpendicular to the director and the extraordinary refractive index ne is for light with electric field polarization parallel to the director. The birefringence (optical anisotropy) is defined as Δn= ne-no. If Δn>0, the LC is said to be optically positive whereas if Δn<0, the LC is said to be optically negative. The biaxial material (SmC) exhibiting two optic axes can be characterized by three principle refractive indices: n1, n2 and n3. The difference δn = n2-n1 is called optical biaxiality. Since the biaxiality of LC is very small (n1~n2) and can be neglected in most cases [5]. A light beam entering the LC layer is split to two components: the ordinary and extraordinary rays which are so-called no and ne. Both rays propagate through the birefringent medium at different 4.
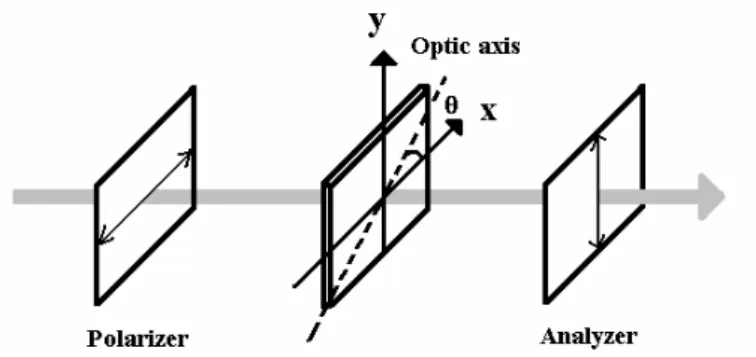
(17) velocities and then cause a phase retardance Γ at the output of a uniformly aligned LC layer. The phase difference is defined as:. Γ=. 2π. λ. Δn ⋅ d. (1.1). where λ is the wavelength of light in vacuum and d is the distance across the homogeneous LC layer which is equal to the cell gap as normal incidence. The optical transmission through a LC layer can be determined by the Jones matrix method. Assuming that the LC layer is inserted between a pair of crossed polarizers shown in the Figure 1-4, where the transmission axis of the polarizer is along the x-axis and the analyzer is along the y-axis, the angle between the polarizer and the optic axis of LC cell is θ, the resulting optical transmission can be calculated as: ⎛ 0 0 ⎞ ⎛ cos θ E =⎜ ⎟⎜ ⎝ 0 1 ⎠ ⎝ sin θ. ⎛ − Γ2 − sin θ ⎞ ⎜ e ⎟ cos θ ⎠ ⎜⎜ ⎝ 0. ⎞ 0 ⎟ ⎛ cos θ Γ ⎟⎜ ⎝ − sin θ e 2 ⎟⎠. sin θ ⎞ ⎛ 1 0 ⎞ ⎟⎜ ⎟ E0 cos θ ⎠ ⎝ 0 0 ⎠. (1.2). where E0 is the electric vector of the input linearly polarized beam, E is that of the optical field exiting from the analyzer, and Γ is the phase difference induced by LC cell. The transmitted intensity can then be written as: I = E * ⋅ E = I 0 sin 2 2θ sin 2. Γ 2. (1.3). where I0 is the intensity of the linearly polarized light. In this case with the 2×2 Jones matrix, we neglect the reflections and the interference effects of light. The more accurate solution can be derived by using 4×4 propagation matrix approaches, which can take into account the above-mentioned effects.. 5.
(18) Figure 1-4 An illustration of the LC cell inserted between a pair of crossed polarizers.. 1.3 The Overview of SSFLC Devices Surface-stabilized ferroelectric liquid crystal (SSFLC) device, which was first proposed by Clark and Lagerwall in 1980, had attracted significant interest. SSFLC can provide attractive features of microseconds response, bistability, and wide viewing angle [6, 7]. SSFLC uses a very thin cell with cell gap slightly smaller than the helical pitch to unwind the helical structure of LC. The cell gaps generally are of the order of couples micrometers. The simplest geometry of bookshelf SSFLC cell structure is shown in the Figure 1-5. Besides the bookshelf structure, geometry is chevron structure, in which the internal layers are folded as shown in the Figure 1-6. Assuming that the FLC molecules are sandwiched between two bounding plates and the smectic layers are normal to the plates. The boundary forces on the surface of the plates align n to lie on the plane. The boundary-induced preferred orientation, and the constraint of FLC which demands n on the tilt cone, result in two possible orientations of n at the intersections of the tilt cone with the surface of bounding plates. The spontaneous polarization Ps can adopt only down or up orientation (see Figure1-5). This leads to the appearance of spontaneous domain of uniform polarization, which renders this structure to be ferroelectric. In an ideal case there are two n orientations, which are symmetric with equal minimum free energy. When an electric field is applied along the surface normal, the spontaneous polarization will 6.
(19) align itself in the direction of the external field. Any deviation from these two directions produces a torque Γf = P×E. Because the spontaneous polarization is coupled to the director it will drag the director on the smectic cone to the other extreme state. When the field is turned off, the current state will be maintained. The FLC cannot switch when the applied field is lower than the threshold field. These properties result in a hysteretic behavior, which makes FLC very useful for a passive-matrix device.. Figure 1-5 The basic geometry of a bookshelf SSFLC cell structure and its electro. optic switch behavior between crossed-polarizers.. Figure 1-6 The two kind geometries of a chevron SSFLC cell structure applied with. external electric fields.. 7.
(20) 1.4 Modification of an Existing FLC Material with Nanostructured Dopant Modifications of the electro-optical properties of an existing FLC material by doping with appropriate impurities had recently attracted significant interest. Concerted efforts in nanostructured materials and LC technologies had been employed to demonstrate the potential to yield an improved LC alignment and EO properties. The developments had also revealed that the phase transition, elastic coupling, ionic effect, and dielectric anisotropy of LC materials are adjustable with doping of various nanomaterials, such as silica particles, LC-covered Pd particles, and ferroelectric nanoparticles, etc. The design parameters of the methodology include material, size and shape, doping concentration and surfactant properties of nanoparticles, which could open an effective and flexible way for generating promising new materials for the next generation LC flat panel display. Recently, Zinc oxide (ZnO) nanostructured materials had been widely studied for the potential applications with its optical, electrical and mechanical properties. Experimental and theoretical studies on ZnO crystals have revealed a presence of giant permanent dipole moment, which yield a significant piezoelectric effect, and therefore ZnO has been considered to be promising for micromechanical devices. Zinc oxide is a wide direct band-gap (3.4 eV) II-VI semiconductor with wurtzite structure and large exciton binding energy (60 meV). Therefore it has also been used in short wavelength electro-optical devices such as light emitting diodes and lasers. From the viewpoint of material synthesis, ZnO crystals offer further advantages of low cost and poison-free preparation procedure compared with other popular nano objects such as CdS, CdSe, and InP, etc. Since development of a new FLC material with attractive properties is an extremely time consuming effort, modification of an existing material to fit into a 8.
(21) specific application becomes an attractive tactic.. In this thesis, we explore the. possibility to enhance application properties of a FLC material by doping the FLC with ZnO nanoparticles. To our knowledge, modification of the electro-optical properties of a smectic liquid crystal with semiconductor nanocrystals has not yet been reported.. 9.
(22) Chapter 2 Sample Preparation and Electrical Characterization of SSFLC with and without nc-ZnO Doping 2.1 Material Preparation and Optical Properties of nc-ZnO Colloidal ZnO nanoparticles with an average diameter of 3.2 nm were prepared by following the procedure described in previous reports [8]. In a typical run, 3.29 g of zinc acetate dihydrate (Zn(Ac) 2.H 2O) (SHOWA, 99.0%) was dissolved in 150 ml boiling ethanol (Nasa, 99.5%) and refluxed the solution at about 80oC in a nitrogen atmosphere. The solution was held at 80oC for 3 hours with vigorous stirring. After this process, 90 ml of ethanol was removed from the solution by distillation and subsequently the same amount of fresh ethanol was added to the original volume. Then the solution was cooled to 0oC. 0.87 g lithium hydroxide monohydrate (LiOH.H2O) (TEDIA, 99.0%) was added into 90 ml ethanol under constant stirring for 2 hours. When needed, sonication was used to ensure complete dissolution of LiOH.H 2O in ethanol. Afterwards, the resulting ethanol solution of LiOH.H2O was added drop-by-drop into the above-mentioned zinc acetate solution which had been cooled to 0oC and was under constant stirring. The solution was warmed up to room temperature and continuously stirred for 2 hours until a transparent colloid solution of ZnO nanoparticles was formed. To. stabilize. the. ZnO. nanoparticles,. 0.3-g. 3-(Trimethoxysilyl). propyl. methacrylate (TPM) (Aldrich, 98.0%) was dissolved in 10 ml ethanol and then this solution was slowly injected into 240-ml as-prepared colloid solution of ZnO 10.
(23) nanoparticle over about 1 hour at 0 oC. The mixture was stirred at room temperature for 12 hours followed by filtration with a 0.45-μm glass fiber filter to remove any insoluble precipitates [9]. To purify nc-ZnO colloid solution and then collect ZnO nanopowder, the nc-ZnO colloid was precipitated by adding an excess of hexane or heptane into the ethanol solution with a volume ratio of heptane/ethanol >2 [10]. In a typical run, 20 ml colloid solution of ZnO nanoparticles was slowly poured into 60 ml heptane (Nasa, 96%) to produce nc-ZnO precipitation. The resulting precipitation was isolated by centrifugation. Dissolve the above precipitate in ethanol and rewash the solution with heptane several times to remove all residues. To obtain ZnO nanopowder, the final precipitate was isolated with centrifugation and dried by purging with pre-purified nitrogen gas. UV-visible absorption spectra were measured with an Agilent 8453 UV-Visible Spectroscopy using a 1-cm quartz cuvette at room temperature. The TPM-modified ZnO nanoparticle solution was diluted with fresh ethanol to appropriate optical density. Typical UV-Vis absorption spectrum of the ZnO nanoparticle solution is shown in Figure 2-1. The absorption peak and the shoulder (λ1/2) of the ZnO nanoparticle colloids were found to locate at 327 nm and 345.6 nm, respectively. The UV-Visible absorption spectrum is useful to characterize the particle growth process because the absorption is closely associated with particle size [10-12]. According to the experimental result reported by Meulenkamp [10], the particle sizes can be estimated from the measured λ1/2 by. 1240. λ1/ 2. = 3.301 +. 294.0 1.09 + D2 D. Based on the equation, we estimate that the diameter of our TPM-caped ZnO nanoparticles is about 3.4 nm.. 11. (2.1).
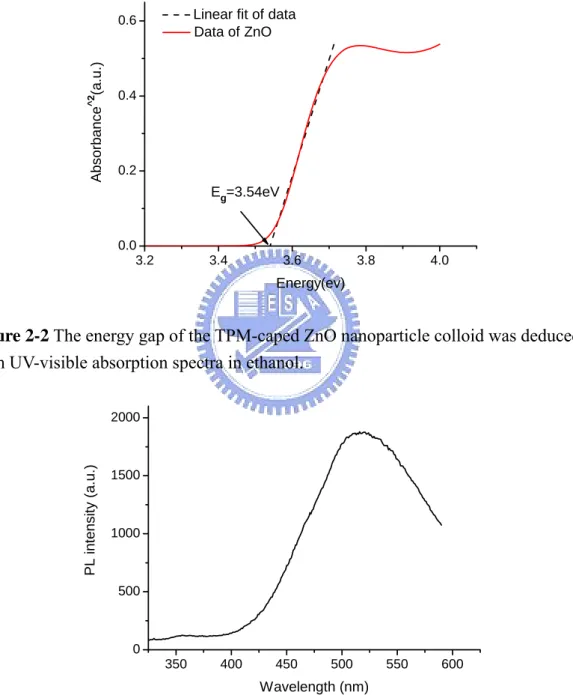
(24) peak= 327nm. Absorbance (a.u.). 0.75. 0.50 λ1/2= 345.6nm. 0.25. 0.00 300. 325. 350. 375. 400. 425. Wavelength (nm). Figure 2-1 UV-visible absorption spectra of TPM-caped ZnO nanoparticles in ethanol.. The bandgap of the TPM-caped ZnO nanoparticles can also be determined from the UV-Visible absorption spectrum [11, 12]. The transmitted and incident light intensities It and Io are related via the Beer’s law It = Ioexp(-αL), where α is the absorption coefficient and L the optical path length of the sample. ZnO is a direct-bandgap semiconductor with an absorption coefficient α relating to the optical excitation energy hν by α = A(hν−Eg)1/2 (for hν≧Eg), where Eg is the fundamental energy bandgap. Therefore, to retrieve the bandgap energy we plot [ln( I t I 0 )]2 versus. optical energy hν. Extrapolating the linear part until it intersects the x-axis, which yields Eg. Based on this method, the bandgap of the TPM-caped ZnO nanoparticle colloid was found to be about 3.54 eV, as shown in Figure 2-2. Similar to the UV-Vis absorption spectrum, photoluminescence spectrum of nc-ZnO colloid is also sensitive to the preparation procedure [12]. The photoluminescence properties of nc-ZnO solution were investigated with Hitachi F4500 Fluorescence Spectrometer. The sample is contained in a 1-cm quartz cuvette. 12.
(25) and excited by an optical beam with wavelength of 300 nm at room temperature. The photoluminescence spectrum of the TPM-caped colloidal ZnO nanoparticles with an averaged diameter of 3.4 nm is presented in Figure 2-3. The fluorescence from our TPM-caped nc-ZnO colloidal solution exhibits a green emission peak at 518 nm.. Linear fit of data Data of ZnO. Absorbance^2(a.u.). 0.6. 0.4. 0.2. Eg=3.54eV. 0.0 3.2. 3.4. 3.6. 3.8. 4.0. Energy(ev). Figure 2-2 The energy gap of the TPM-caped ZnO nanoparticle colloid was deduced from UV-visible absorption spectra in ethanol.. PL intensity (a.u.). 2000. 1500. 1000. 500. 0 350. 400. 450. 500. 550. 600. Wavelength (nm). Figure 2-3 Photoluminescence spectrum of TPM-caped ZnO nanoparticles in ethanol.. 13.
(26) 2.2 Preparation of SSFLC Cells with and without nc-ZnO Doping The surface-stabilized ferroelectric liquid crystal samples used in this study were prepared with a procedure to be detailed in this section. 1. Substrate Cleaning: Two kinds of substrates were used to prepare SSFLC test. cells. The ITO-coated fused silica substrates were used for optical measurements in the spectral range from UV to visible. For IR spectroscopic studies, we select ITO-coated CaF2 substrates. The substrates were cleaned with the following steps: 1. Soak the substrates in a diluted detergent aqueous solution for 15 min. 2. Wash the soaked substrates with the diluted detergent solution, then rinse with deionized (DI) water. 3. Put the washed substrates in a fresh detergent aqueous solution and ultrasonic treatment for 15 min. 4. Rinse every substrate with DI water, and then ultrasonic the substrates in clean DI water for 5 min. 5. Repeat the step 4. 6. Put as treated substrates into acetone and ultrasonic vibration treatment for 15 min. 7. Rinse the substrates with clean DI water. Put them into a fresh DI water bath to perform ultrasonic vibration treatment for 15 min. Repeat the step for two times. 8. Rinse the substrates with DI water and purge with nitrogen gas to dry the substrates. 9. Put the substrates into clean oven to bake at 100oC for 1hr.. 2. Preparation of LC Alignment Layer: The selection of alignment material. depends on the desired parameters of LC test cell such as pretilt angle, anchoring 14.
(27) energy, and residue charge on the surface of alignment layer. In this thesis study, a polyimide RN1182 from Nissan Chemical was used. We applied a rubbing process to produce the easy axis for LC alignment on RN1182-coated ITO substrates. The preparations of alignment layers are described in the following: 1. Wait for the temperature of RN1182 and its diluting solvent to warm up to room temperature. Dilute the RN1182 with the solvent to a concentration of 25% in weight. 2. Stir the diluted RN1182 solution for 2 hours at room temperature. 3. Put droplets of diluted solution of RN1182 on substrate surface. The amount of the solution deposited depends on the size of substrate. 4. Spread the alignment layer on the substrate with a spin coater. The spinning rate should be optimized based on the viscosity of the spreading solution. The spinning rate used for RN1182 is 300 rpm for 10 sec and then 3000 rpm for another 30 sec. 5. Soft bake the coated substrates in an oven at 80oC for 5 min after the spin coating procedure is completed. 6. Hard bake the coated substrates at 250oC for another 60 min. 7. Rub the coated substrates with a rubbing machine. The distance between the roller and the substrate is about 0.5 mm. Set the rotation speed of the roller at 1000 rpm and the translation speed of the substrates about 5 cm/min. Check the rotation direction of the roller to ensure sufficient relative velocity existing between roller and substrate.. 3. FLC Preparation: To prepare FLC with an appropriate doping of nc-ZnO, the. ferroelectric liquid crystal material FELIX -017/100 mixture from Clariant was used. The phase transition sequences are I-N at 86oC-83oC, N-SA at 77oC, SA- SC at 73oC, SC-X at -28oC. Two different procedures were used in order to find out the best 15.
(28) preparation approach of nc-ZnO-doped FLC: A. Mix nc-ZnO Powder with FLC. 1. Take a suitable amount of pure FLC, and then add several milligrams of nc-ZnO powder to the desired weight percentage. In this study, FELIX -017/100 doped with nc-ZnO powder to a weight percentage of 1.06% was used. 2. Put the mixture into an ultrasonic water bath at about 85oC to keep the FLC in the isotropic phase and performed ultrasonic treatment for 40 min. 3. Put the mixture in vacuum and wait for its temperature return to room temperature.. B. Mix FLC with nc-ZnO Ethanol Solution. 1. Take an appropriate amount of pure FLC. Add several milligrams of TPM-caped nc-ZnO ethanol solution (what is the concentration of nc-ZnO in the ethanol solution) to a desired weight percentage. In this study, FLC FELIX -017/100 doped with nc-ZnO to a weight percentage of 1.086% was used. 2. Put the mixture into an ultrasonic water bath at about 85oC to keep the FLC in the isotropic phase and performed ultrasonic treatment for 5 min. Wait for the mixture returns to room temperature. 3. Put the mixture in vacuum line and purge it with nitrogen gas for 8 hours to drive the remaining ethanol out of the mixture.. 4. Test Cell Assembly: The gap of the test cells used is controlled by silica balls with. a diameter of 2 μm. The assembly of a test cell and liquid crystal filling are described as follows: 1. The silica balls were dispersed into a UV-curable gel NOA65 with a volume fraction of silica balls about 5% in the mixture. 16.
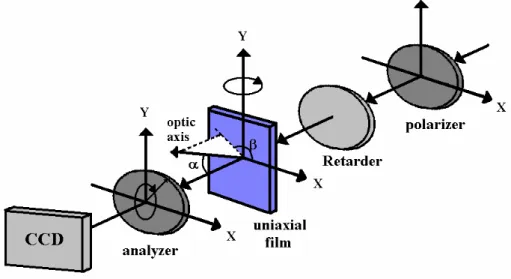
(29) 2. Coat the spacer solution along the two parallel rims of one substrate. 3. Assemble the substrates into a test cell with a desired rubbing geometry. Adjust the cell gap to achieve the best gap uniformity. 4. Cure the UV gel by exposing the test cell with UV light. 5. Put the empty cell on a hot plate with a temperature of 87oC to keep the FLC used in the isotropic phase. 6. Put several droplets of FLC (or FLC doped with nc-ZnO) on the opening side of the empty test cell. Wait the test cell filled with FLC (nc-ZnO doped FLC) via capillary force. 7. Cool down the filled cell to room temperature slowly and then seal the opening sides of the cell with a quick-dry sealant. 8. Carefully remove the polyimide layer on the cell substrates to expose the ITO film and put on conducting cupper pads. Attach thin cupper wires to the conducting copper pads.. 2.3 Alignment Quality Examination of SSFLC Cell with Imaging Polarimetry. Figure 2-4 Schematic of an imaging polarimetric apparatus used in this study. 17.
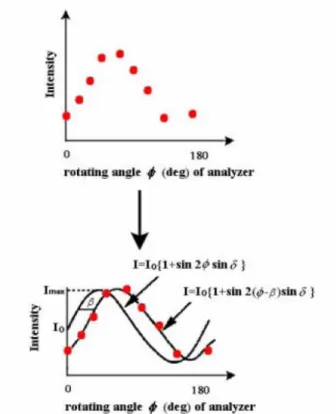
(30) Figure 2-4 presents a schematic diagram of the imaging polarimetric system used for probing the alignment quality of a SSFLC cell [13]. The polarimetric setup includes a polarizer, a retarder, a test sample, an analyzer, and an image detector. The FLC test cell, which is assumed to be a homogeneous uniaxial film, was mounted on a rotation stage to allow an accurate orientation adjustment. The light source was a laser diode with a wavelength of 670 nm. The light beam was expanded with a 40-times beam expander to yield a region with a uniform intensity distribution. The beam was transformed into a right-hand circularly polarized light with a polarizer and a variable retarder. After the right-hand circularly polarized light passes through the test cell, the polarization state of the transmitting light was analyzed with a polarization analyzer and then was imaged onto a 2D charge-coupled device (CCD). The sample plane was defined to be x-y plane, and the polar angle of the optic axis of the sample was defined to be α from the z-axis. The optic axis was projected onto the x-y plane to yield an azimuthal angle β relative to the x-axis. The 2D CCD detector has an imaging area of 7×5 mm2 with pixel arrays of 426(H)×320(V). The 2D intensity data measured by the CCD camera was transformed into National Television System Committee (NTSC) signal and sent to a computer, which contained an image processing circuit board. The image processing board had picture elements of 640(H)×480(V) with 8-bit coding for each pixel. To reduce the memory storage, we render nine-(3×3)-elements array into one element to form an image with a smaller size of 34,000 elements. We used Matlab as our image processing platform. By using Jones calculus, we can derive an expression for the optical irradiance on each pixel of CCD detector [14] :. ⎡ Ex' ⎤ ⎡ cos 2 φ sin φ cos φ ⎤ ⎡ξ η ⎤ 1 ⎡1 i ⎤ ⎡1 ⎤ ⎢ ' ⎥ = J PSA J f J PSG Ein = E0 ⎢ ⎥⎢ ⎥ ⎢ ⎥ ⎢ ⎥ (2.2) sin 2 φ ⎦ ⎣η ς ⎦ 2 ⎣i 1⎦ ⎣0 ⎦ ⎢⎣ E y ⎥⎦ ⎣sin φ cos φ 18.
(31) The Jones matrix elements (Jf) of a uniaxial film can be written as [15]:. ξ = cos 2 β eiδ / 2 + sin 2 β e − iδ / 2 , η = i cos 2 β eiδ / 2 + sin 2 β e − iδ / 2 ς = cos β e 2. − iδ / 2. + sin β e 2. (2.3). iδ / 2. The retardance of the transmitted light will experience an optical retardance of ⎛ ⎞ ⎜ ⎟ 1 ⎛ 2π ⎞ ⎜ − no ⎟ , δ (α ) = ⎜ ⎟ h ⎜ ⎟ λ 1 1 ⎝ ⎠ ⎜ ⎟ sin 2 α + 2 cos 2 α 2 ⎜ n ⎟ n o ⎝ e ⎠. (2.4). where h denotes the film thickness. Here we assume that the index of refraction of the film to be uniform over the entire film thickness, and the indices are known a priori. By using Eq. (2.2), the optical intensity on the detector can be expressed as I = Ex' Ex' * + E y' E y' * =. I0 {1 + sin 2(φ − β ) sin δ }, 2. (2.5). where I0 denoted the incident beam intensity, and φ is the azimuthal angle of the polarization state analyzer (PSA). The Measurement Principle of the Azimuthal Angle (β). Notice that sin(δ) is a constant because retardation is a function of polar angle and sample thickness, which were kept constant during the measurement (see Eq. (2.2)). Therefore we can determine the azimuthal angle β of the optic axis by fitting the measured intensity pattern I(φ) at normal incidence to Eq. (2.5) with sin(δ) and β as the fitting parameters. The angle φ is typically rotated from 0° to 180° and every 100 we record the intensity distribution with the CCD. That results in a 19-points intensity curve for each pixel, and can be fitted to Eq. (2.5) to retrieve β at each pixel with the nonlinear least-squares method.. 19.
(32) Figure 2-5 Determination of β and d from optical intensity pattern measured on a. birefringent film.. The Measurement Principle of the Polar Angle (α). After β was determined, polar angle α of the optic axis and thickness of the sample can be determined by rotating sample along the z-axis with φ adjusting to meet sin[2(φ−β)]=1 (i.e., φ−β=π/4 ). We changed the incident angle by rotating the sample about y-axis. The incident angle between the incident light and sample normal was denoted by ψ, as shown in Figure 2-6.. 20.
(33) Figure 2-6 The geometry of an incident optical beam on a uniaxial crystal film.. When an obliquely incident light passed through the sample, the optical retardation experienced can be expressed as. δ (γ ,ψ ) =. 2π. λ. ⋅ h ⋅ f (γ ,ψ ). (2.6). where γ ≡ π/2-α, and f(γ,ψ) was shown to be [16]: 1 2 2 1 a 2b 2 1 ( a b ) sin cos sin (1 sin 2 ψ )1/ 2 − (1 − b 2 sin 2 ψ )1/ 2 − γ γ ψ + − 2 2 c c c b , 1 1 2 2 2 2 a = , b = , c = a cos γ + b sin γ ne no f (γ ,ψ ) =. (2.7). where neee and nooo denote the refractive indexes of the extraordinary and the ordinary waves in the uniaxial film. We first noticed that when the polar angle α is fixed (γ is therefore fixed), we can rewrite the optical transmittance as 1 T (ψ ) = [1 + sin δ (ψ )] . 2. (2.8). Eq. (2.8) indicates that the optical transmittance varies with the incident angle and the variation pattern depends on the polar angle α of the optic axis and the thickness h of the uniaxial film. Therefore, we can fit the measured curves to Eq. (2.8) to retrieve the 2D distributions of α and h.. 21.
(34) Distribution of the Azimuthal Angle β of SSFLC Film with and without nc-ZnO Doping. In this study, we prepared nc-ZnO doped SSFLC by direct mixing the nc-ZnO powder into FLC. The 2D distributions of the azimuthal angle of SSFLC cells with and without nc-ZnO doping are presented in the Figure 2-7. We found the distribution of the azimuthal angle of the pure FELIX -017/100 SSFLC cell peaks at 9o (the x-axis set to be 0o) with a FWHM of 16o. However, the distribution of SSFLC with nc-ZnO doping peaks at 17o with a FWHM of 13o. We should point out that azimuthal distribution of LC director directly reflects the optical properties of the LC device. Thus, clearly nc-ZnO doping improves the azimuthal alignment and results in a narrower distribution. The 2D distribution images of the azimuthal angle of the two SSFLC test cells were shown in Figure 2-8 with an image size of 50×50 pixels. The color code indicates the magnitude of the azimuthal angle and the black short lines represent the liquid crystal directors projected on the substrate surface. For comparisons, the measured image patterns of the two test cells under different analyzer orientations are presented in Figure 2-9. It is observed that the similar streaks of these two test cells reveal in both measured image patterns and 2D distributions of the azimuthal angle. The variation of SSFLC from dark to bright are more obvious than that of nc-ZnO doped SSFLC in the same angle range. This difference make the SSFLC has higher distributing numbers than nc-ZnO doped SSFLC at the statistic of the azimuthal angle. However, the nc-ZnO doped SSFLC cell yields a darker image, indicating a narrower azimuthal distribution. The streaks of the SSFLC with nc-ZnO doping cell are not such apparent as that of the SSFLC cell, hence the entire 2D distributions of the azimuthal angle of nc-ZnO doped is more uniform.. 22.
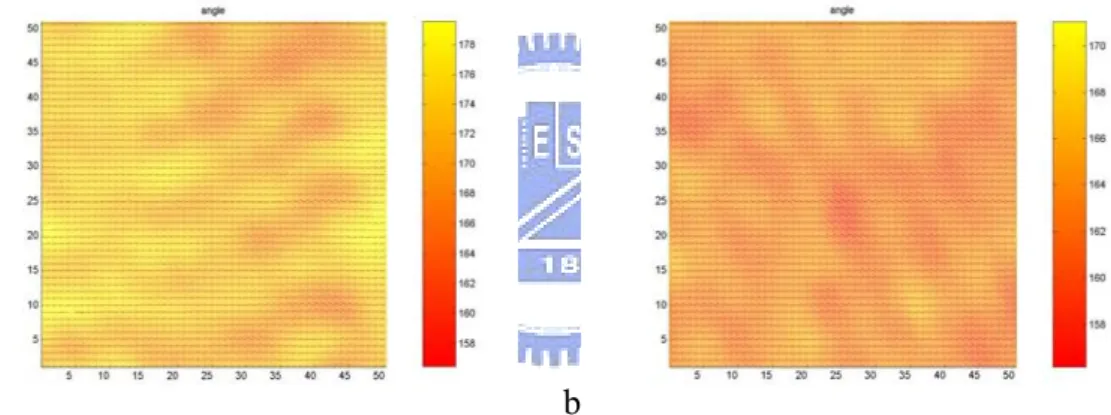
(35) 9o. 16000. 17o SSFLC FWHM 16o. Number (a.u.). 12000. SSFLC with nc-ZnO FWHM 13o 8000. 4000. 0 0. 30. 60. 90. 120. 150. 180. Angle (degree). Figure 2-7 The distribution of the azimuthal angle β of the SSFLC with (dash line). and without (solid line) nc-ZnO doping.. b. a. Figure 2-8 The 2D distributions of the azimuthal angle β of (a) the SSFLC, (b). nc-ZnO-doped SSFLC cells.. 0o. 40 o. 90 o. 130 o. 170 o. SSFLC. SSFLC with nc-ZnO doping Figure 2-9 The measured images of the SSFLC test cells with and without nc-ZnO doping at five different orientations of the analyzer. These images are part of the data, 23.
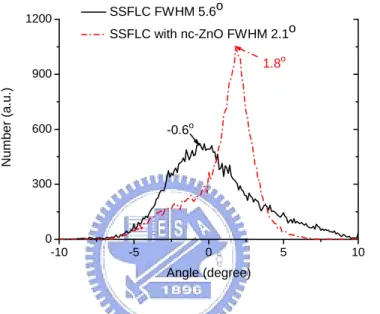
(36) which were used to retrieve the 2D distribution of azimuthal angle shown in Figure 2-8.. Distribution of the Polar Angle α of SSFLC Film with and without nc-ZnO Doping. The 2D distributions of the polar angle of SSFLC test cells with and without nc-ZnO doping are presented in Figure 2-10.. 1200. SSFLC FWHM 5.6o SSFLC with nc-ZnO FWHM 2.1o 1.8o. Number (a.u.). 900. -0.6o. 600. 300. 0 -10. -5. 0. 5. 10. Angle (degree). Figure 2-10 The distribution of the pretilt angle γ = π 2 − α of the SSFLC test cells. with (dashed line) and without (solid line) nc-ZnO doping.. The distribution of the pretilt angle of pure FELIX -017/100 test cell was found to peak at -0.6o (the z-axis set as 90o) with a FWHM of 5.6o. The doping of nc-ZnO into FELIX -017/100 leads to a distribution peak at 1.8o with a FWHM of 2.1o. We found that the nc-ZnO doping also improves the polar distribution of FLC director by effectively reducing the FWHM width. This improvement may originate from a novel effect of nc-ZnO to effectively tie surrounding FLC molecules together with its giant dipole moment. To give clearer comparisons of the transmitting light intensity variation, the measured images of the SSFLC test cells without and with nc-ZnO doping were 24.
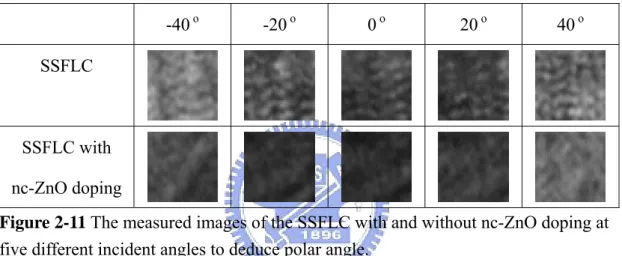
(37) collected and shown in Figure 2-11 at five different incident angles. Here 0o denotes that the incident light was normal to the test cell. These images are part of the data, which were used to retrieve the 2D distribution of azimuthal angle shown in Figure 2-10. The nc-ZnO doped SSFLC cell yields a darker image and the streaks of it are also less than the SSFLC cell, indicating a narrower pretilt distribution. Besides, it presents an asymmetric phenomenon to produce the pretil distribution shift 1.8 degrees.. -40 o. -20 o. 0o. 20 o. 40 o. SSFLC. SSFLC with nc-ZnO doping Figure 2-11 The measured images of the SSFLC with and without nc-ZnO doping at five different incident angles to deduce polar angle.. 2.4 Preisach Model and the Equivalent Electronic Circuit of SSFLC Cell Equivalent Electronic Circuit Model. To accelerate the applications of a FLC device, many papers have been published to propose an equivalent electronic circuit model for FLC cell in DHF-LCDs and TLAF-LCDs [17-19]. The electronic model can help us analyzing the dynamic behavior of the FLC molecules with an external electric field. In this study, we develop an equivalent electronic circuit model of SSFLC cells to reveal more clearly the effect of the nc-ZnO doping. The resulting effective circuit model is presented in Figure 2-12. Here Cp and Rp 25.
(38) denote the capacitance and resistance of the polymer alignment layer, and CLC and RLC reflect the dynamic capacitance and resistance of the FLC layer. The total capacitance of the SSFLC cell CCell can be determined from electrical measurement. The electrical characterization apparatus used in this study was a HP4284A LCR meter. The characterization procedure starts with a careful measurement of the total capacitance of the empty cell at four different frequencies. The results are presented in Figure 2-13(a), which exhibits that the capacitance decreases with an increase of frequency. At a fixed frequency, the capacitance is nearly constant independent of the applied voltage.. Figure 2-12 The equivalent electronic circuit model of a SSFLC cell. a. The empty cell empty cell 100Hz 1KHz 10KHz 100KHz. 1.60E-009. Capacitance Ccell (F). 1.50E-009 1.40E-009 1.30E-009 1.20E-009 1.10E-009 1.00E-009 9.00E-010 8.00E-010 -10. -5. 0. 5. Bias Voltage (v). 26. 10.
(39) b. The SSFLC cell SSFLC 100Hz 1KHz 10KHz 100KHz. 1.40E-008. Capacitance Ccell (F). 1.20E-008. 1.00E-008. 8.00E-009. 6.00E-009. 4.00E-009. 2.00E-009. 0.00E+000 -10. -5. 0. 5. 10. Bias Voltage (v). Figure 2-13 The capacitance-voltage (C-V) curves of (a) the empty cell, (b) the cell filled with FLC at four different frequencies.. We can therefore determine the capacitance of the ITO/polymer alignment layer directly and from the result we also can deduce the current-voltage curve of the empty cell. The result is presented in Figure 2-14. The measurement result suggests that the capacitance and resistance of the ITO/polymer layer should be connected in a parallel form in the electronic circuit. We filled the test cell with FLC and measured its C-V curve again. We found that the total capacitance of the cell becomes a function of the applied voltage, as shown in Figure 2-13(b). The capacitance of the filled cell was lager than that of the empty cell at about 1-2 order. The C-V curve profiles also change with frequency. According to the result, we connect the capacitances of the FLC layer and the polymer layer in parallel. The current-voltage curve (I-V) of the SSFLC cell measured with a DC voltage was shown in Figure 2-14. Comparing with the empty cell, the current flowing through the SSFLC cell is increased. This meant that the resistance of the SSFLC was smaller than that of empty cell deduced from the Ohm’s law. From this IV result, we conclude that the resistances of the polymer layer and the FLC layer should be connected in a parallel form. 27.
(40) The charge stored in a SSFLC cell can be expressed as. Ccell ⋅Vext = ∫ Vext C p ⋅ dV + ∫ Vext CLC ⋅ dV .. (2-9). The resulting equivalent electronic circuit model of SSFLC shown in Figure 2-12 can be used to describe the variation of the capacitance of the FLC layer with applied voltage. The same approach can be applied to analyze the behavior of the SSFLC cell with nc-ZnO doping.. SSFLC cell empty cell. 4.00E-008. Current (A). 2.00E-008. 0.00E+000. -2.00E-008 -10. -5. 0. 5. 10. DC bias voltage. Figure 2-14 The measured current-voltage (I-V) curves of the empty cell (circle-symbol) and the filled SSFLC cell (square-symbol) plotted as a function of applied voltage.. The Preisach Model. The Preisach model of hysteresis [20] behavior in a ferroelectric film proposes that the ferroelectric film is formed has a bi-dimensional distribution of coercitive fields, called the Preisach distribution [21]. The major physical approach of the Preisach model was to find the meaning of the Preisach distribution for ferroelectric thin films. Two microscopic interpretations had been proposed: (1) it attributes the coercive field distribution to ferroelectric dipoles [22]; (2) it refers to the threshold voltage at which the independent domain switch [23]. The Preisach model can be applied to analyze the behavior of the ferroelectric liquid crystal [24]. In this study,. 28.
(41) we use the Preisach model to describe the variation of the FLC capacitor as a frequency-dependent polarization reversal in SSFLC under an applied driving field. The spontaneous polarization of the FLC can directly couples with the external electric field. The polarization-electric field (P-E) curve of the FLC was shown in the Figure 2-15 [25].. Figure 2-15 Hysteresis of macroscopic polarization P(E) (top) and dielectric susceptibility χ(E) = ∂ P/ ∂ E (bottom) for an FLC cell. Here ΔVc is defined to be the width of hysteresis.. The FLC molecules can be aligned parallel or antiparallel to the applied electric field direction, and the transition from the antiparallel state to the parallel state is followed by the reversal of the polarization direction. The nonlinear capacitance of FLC cell can combine with a linear capacitance [26] to yield ⎛ dp CLC = Clin + ⎜ ⎝ dVext 29. ⎞S ⎟ ⎠L. ,. (2-10).
(42) where Clin denotes the linear capacitance, V the applied voltage, S and L the area and the thickness of the capacitance, respectively. Here the nonlinear capacitance, which corresponds to the polarization reversal, can be deduced from the Preisach model. The individual dipoles in the FLC film add up to the total polarization and each of them had a rectangular hysteresis loop. The external applied field can interact with the dipoles to change their directions. Assuming the direction of the dipoles in thermal equilibrium to exhibit a Gaussian distribution [27], the resulting total polarization P of the FLC film could be expressed as. P (Vext ) = FP tanh ⎡⎣δ (Vext ∓ VC± ) ⎤⎦ .. (2-11). Here F is a factor reflecting the behavior of the loop is not saturated; δ is a constant with ⎡. 1 + Pr / Ps ⎤ )⎥ , 1 − Pr / Ps ⎦. δ = VC−1 ⎢ log( ⎣. (2-12). Ps denotes the saturated polarization or the spontaneous polarization, and the Vc± is the mean value of the individual coercive voltage. The (+) sign indicates an increase of Vext, and the (-) sign a devrease of Vext. The meaning of FPs represents the proportion of the dipoles in the switching process of the non-saturated loop [29]. By combining Eq. (2-10) with Eq.(2-11), an expression of the FLC capacitance can be obtained CLC = Clin +. and. FPs δ. S cosh ⎡⎣δ (Vext ∓ V ) ⎤⎦ L ± C. 2. (2-13). dP (−V ) dP (+V ) . = dV v dV − v. Eq. (2-13) shows that the capacitance peaks in the C-V curve shall coincide with the polarization reversal point and the intensity of the peak relating to the amount of 30.
(43) switchable polarization [28].. 2.5 Electrical Properties of SSFLC with and without nc-ZnO Doping We shall focus in this section on the electrical properties of SSFLC test cells doped with nc-ZnO powder and the pure SSFLC. We shall apply the effective electronic circuit presented in section 2-4, to deduce the relation of the FLC capacitance with the applied voltage. All C-V curves were measured with the HP4284A LCR meter at room temperature. The cell gap and the area of our SSFLC test cells are 2 μm and 180 mm2, respectively. The FLC FELIX -017/100 mixture has a spontaneous polarization of 48.2 nC/cm2 at room temperature. The measured CV curves of pure FLC at four different frequencies of 100 Hz, 1K, 10K and 100KHz respectively are shown in the Figure 2-16(a), and the Figure 2-16(b) is an expanded view of the curves at the high frequencies of 10 K and 100 KHz. In general, the profiles of the C-V hysteretic loops vary with frequency. The peak values of the capacitances decrease with an increase of frequency and the voltage with maximum capacitance also changes. All the C-V curves are symmetric with respect to the 0V point.. 31.
(44) a.. SSFLC 100Hz 1KHz 10KHz 100KHz. Capacitance CCell (F). 1.20E-008. 8.00E-009. 4.00E-009. 0.00E+000 -10. -5. 0. 5. 10. Bias Voltage (v). b.. SSFLC 10KHz 100KHz. Capacitance CCell (F). 9.25E-010. 9.00E-010. 8.75E-010. 8.50E-010 -10. -5. 0. 5. 10. Bias Voltage (v). Figure 2-16 The capacitance (CLC) versus the applied voltage on the pure SSFLC cell without doping at four different frequencies: (a) at 100Hz, 1KHz, 10KHz, and. 100KHz; (b) An expanded view of the curves at the two highest frequencies 10KHz and 100KHz.. The Figure 2-17(a) shows the CV characteristic curves of the nc-ZnO doped SSFLC cell at four different frequencies of 100, 1K, 10K and 100KHz, respectively. These CV curves are similar to those of the pure FLC with some minor differences. Such as the C-V hysteresis loops exhibit a reversal behavior at 10K and 100KHz. In the following we shall apply the Preisach model to yield more detailed information about the doping effect of ZnO nanocrystals.. 32.
(45) a.. SSFLC with nc-ZnO doping 100Hz 1KHz 10KHz 100KHz. Capacitance CCell (F). 1.50E-008. 1.00E-008. 5.00E-009. 0.00E+000 -10. -5. 0. 5. 10. Bias Voltage (v). SSFLC with nc-ZnO doping 10KHz 100KHz. b.. Capacitance CCell (F). 1.00E-009. 9.00E-010. 8.00E-010. 7.00E-010. 6.00E-010 -10. -5. 0. 5. 10. Bias Voltage (v). Figure 2-17 The capacitance (CLC) versus the applied voltage on the nc-ZnO doped SSFLC cell at four different frequencies: (a) at 100Hz, 1KHz, 10KHz, and 100KHz;. (b) An expanded view of the curves at the two highest frequencies 10KHz and 100KHz.. From the measured data, we found that the pure SSFLC can not be fitted with single Preisach model. It is considering that the FLC material FELIX 017-100 is a mixture and that it may possess several FLC dipole species with different responses at various field strength and frequencies. We therefore propose the Preisach model to have CLC = Clin + (m1 + m2 + m3 + m4 ). 33. S L. (2-14).
(46) ( FPs )1 δ1 ( FPs ) 2 δ 2 , m2 = , 2 ± cosh ⎡⎣δ1 (Vext ∓ VC1 ) ⎤⎦ cosh ⎡⎣δ 2 (Vext ∓ VC±2 ) ⎤⎦ . ( FPs )3 δ 3 ( FPs ) 4 δ 4 m3 = , m4 = cosh 2 ⎡⎣δ 3 (Vext ∓ VC±3 ) ⎤⎦ cosh 2 ⎡⎣δ 4 (Vext ∓ VC±4 ) ⎤⎦. m1 = with. 2. Figure 2-18 presents the measured data (empty squares) and the fitting curve to Eq. (2-14) (black solid line) of the pure SSFLC at 100Hz. We need four linear Preisach terms to achieve a good fit to the data as indicated in Figure 2-19(a). The resulting fitting parameters δ, Vc± , and FPs, as described by Eq.(2-14) are summarized in Table 2-1. The results of SSFLC with nc-ZnO doping are presented in Figure 2-18, with the measured data (empty triangle symbol), the fitting curve (black solid line) at 100Hz. Two linear Preisach terms are needed to yield a good fit of the data to Eq. (2-14) as shown in Figure 2-19(b). The resulting fitting parameters δ, Vc± , and FPs, as described by Eq. (2-14) are summarized in Table 2-2. At 100Hz, we found that the SSFLC with nc-ZnO doping has a higher capacitance peak and lower coercive voltage (the peak position) than the pure SSFLC. SSFLC SSFLC with nc-ZnO doping. Capacitance CCell (F). 1.60E-008. 1.20E-008. 8.00E-009. 4.00E-009. 0.00E+000 -10. -5. 0. 5. 10. Bias Voltage (v). Figure 2-18 The experimental C-V curves (open symbols) and the fitting curves (solid lines) of the SSFLC test cells without and with nc-ZnO doping cells at 100Hz.. 34.
(47) a.. b. Fitting curve measured data. Fitting curve measured data. 1.60E-008. 9.00E-009. Capacitance CLC (F). Capacitance CLC (F). 1.20E-008. 6.00E-009. 3.00E-009. 1.20E-008. 8.00E-009. 4.00E-009. 0.00E+000. -10. -5. 0. 5. -10. 10. -5. 0. 5. 10. Bias Voltage (v). Bias Voltage (v). Figure 2-19 The fitting results of the measured data of (a) the SSFLC cell, and (b) the SSFLC cell with nc-ZnO doping at 100Hz. The solid lines are the fitting curve and the. symbols are the measured data. (a) The four curves with dash, dot, dash-dot and dash-dot-dot, respectively, represent the corresponding Preisach terms involved. (b) The dash and dot lines represent the corresponding Preisach terms involved in the nc-ZnO doped SSFLC cell.. In Figure 2-19, the experimental data can be synthesized with several Preisach terms because the molecules of FLC FELIX 017-100 may possess several FLC dipole species. Because the polarization of the FLC couples directly to the external electric field, these molecular dipole species may exhibit different responses at various field strength and frequencies. At the frequency 100Hz, the ZnO nano dots can effectively “glue” their surrounding FLC dipoles together and yield an improved alignment as shown in the imaging polarimetric investigation. This novel effect is possible in view that these nc-ZnO possess fairly large dipole moments and could affect the FLC molecules via dipolar interaction, which simplifies the Preisach terms needed at 100 Hz from four to two with nc-ZnO doping. It is also interesting to point out that the peak positions (i.e., the coercive voltage) of the Preisach terms with the dashed and the dotted curves are similar for the two cells but the SSFLC cell with nc-ZnO doping yields a higher peak height. The SSFLC cell with nc-ZnO doping does not exhibit another two Preisach terms (the dash-dott and dash-dot-dot lines), which are present in the pure SSFLC. This appears to affirm that ZnO nanocrystals could effectively 35.
(48) connect the FLC dipole species and simplify the field-induced responses.. Table 2-1 The fitting parameters of the pure SSFLC cell to Eq. (2-14) at different. frequencies. 100Hz δ1. 1KHz. 10KHz. 0.36642. VC±1 (V). (FPs)1 (C/mt2). -0.36642. ±7.0354. ±5.38644. ±3.64075. ±5.590. 1.277×10⁻¹⁰. 7.297×10⁻¹¹. 3.458×10⁻¹³. 1.480×10⁻¹². δ2. 0.191199. VC±2 (V). (FPs)2 (C/mt2). -0.191199. ±2.24519. ±1.7003. ±0.355235. ±1.98496. 1.473×10⁻¹⁰. 8.547×10⁻¹¹. 1.617×10⁻¹². 1.614×10⁻¹². δ3. 0.885003. VC±3 (V). (FPs)3 (C/mt2). 100KHz. -0.885003. ∓ 6.82148. ∓ 7.38824. ∓ 10.7792. ∓ 11.2531. 5.589×10⁻¹⁰. 2.322×10⁻¹⁰. 2.866×10⁻¹². 7.564×10⁻¹². δ4. 1.6201. VC±4 (V). (FPs)4 (C/mt2). ±8.4126 7.257×10⁻¹². From the Table 2-1, the pure SSFLC cell requires four linear Preisach terms model was used to fit its measured at 100Hz, but only three are needed for 1KHz and 100KHz. Both the switchable polarization (FPs) and the coercive voltage ( VC± ) decrease with an increase of frequency. The parameters δ1, δ2, δ3, and δ4 are positive at frequencies below 100KHz. At 100KHz, the C-V curve exhibits a reversal phenomenon. The parameter δ1, δ2 and δ3 became negative with magnitudes similar to their positive values.. 36.
(49) Table 2-2 presents the fitting parameters of the SSFLC cell with nc-ZnO doping cell. Only two linear Preisach terms are needed at 100Hz, and it is reduced to one at 1K, 10K, and 100KHz. The δ1 and δ2 of the SSFLC with nc-ZnO doping cell are different from the corresponding values in the pure SSFLC cell. The reversal of C-V curve occurs at 10KHz and the δ parameters change sign from positive to negative. It is to know that the FLC molecules naturally try to align with the largest permittivity component along the external field. If the frequency of the electric field is so high that it cannot couple with the spontaneous polarization. Therefore, the FLC molecules will remain in (or return to) the almost fully switched state and do not contribute to the nonlinear part of the capacitance. For the reason, the inversion of the C-V curve is associated to the inversion of the dielectric δε. When the spontaneous polarization is proportion to the dielectric biaxiality, the C-V hysteresis loop will show an inversion at higher frequencies [30]. The switchable polarization (FPs) decreases with an increase of frequency from 100 Hz to 1 KHz, but becomes increase with frequency from 10KHz to 100KHz. But the coercive voltage always decreases with an increase of frequency. At higher frequency the applied field changes direction before the FLC molecules reach their final position for the applied field magnitude, so that the contribution of the molecules to the dielectric constant decrease [30]. Hence, the switchable polarization (FPs) decreases with an increase of frequency. However, after the C-V hysteresis loop shows an inversion, the behavior of the switchable polarization (FPs) may also inverse.. 37.
(50) Table 2-2 The fitting parameters of the SSFLC cell with nc-ZnO doping to Eq. (2-14). at different frequencies 100Hz δ1. 1KHz 0.509512. VC±1 (V). (FPs)1 (C/mt2) δ2. 10KHz. 100KHz. -0.509512. ±5.11285. ±2.5093. ±3.55682. ±2.50275. 1.889×10⁻¹⁰. 6.083×10⁻¹¹. 8.376×10⁻¹³. 1.245×10⁻¹². 0.29875. VC±2 (V). (FPs)2 (C/mt2). ±1.84602 3.319×10⁻¹⁰. Figure 2-20 shows the measured data of the pure SSFLC (open squares) and the SSFLC with nc-ZnO doping (open triangles) at 1KHz and their corresponding fitting curves (solid lines) to Eq. (2-14). Figure 2-21 displays the linear Preisach terms involved in the pure SSFLC and SSFLC doped nc-ZnO at 1KHz. Clearly, the pure SSFLC cell requires three Preisach terms to successfully synthesize the experimental curve, but for the SSFLC with nc-ZnO doping only one is needed at the same frequency 1KHz. The coercive voltage of the SSFLC with nc-ZnO doping is about the averaged value of the two coercive voltages of the Preisach terms (the dash and dot lines) used in the pure SSFLC. This again affirms that ZnO nanocrystals could effectively connect the FLC dipole species and simplify the field-induced responses.. 38.
(51) 6.00x10. -9. CV characteristics @1 kHz. Capacitance CCell (F). SSFLC SSFLC with nc-ZnO doping. 4.50x10. -9. 3.00x10. -9. 1.50x10. -9. 0.00 -12. -6. 0 6 Applied Voltage (Volt). 12. Figure 2-20 The experimental C-V curves (empty symbols) and their fitting results (solid lines) of the SSFLC cells without and with nc-ZnO doping at 1 kHz.. a.. b.. Fitting curve measured data. Fitting curve measured data. 3.75E-009. Capacitance CCell (F). Capacitance CCell (F). 4.00E-009. 3.00E-009. 2.00E-009. 1.00E-009. 3.00E-009. 2.25E-009. 1.50E-009. 0.00E+000. 7.50E-010 -10. -5. 0. 5. -10. 10. -5. 0. 5. 10. Bias Voltage (v). Bias Voltage (v). Figure 2-21 The fitting curves to Eq. (2-14) of (a) the SSFLC cell and (b) the SSFLC cell with nc-ZnO doping at 1 kHz. The symbols are the measured data. In (a) the three. curves with dash, dot, and dash-dot, respectively, represent the Preisach terms involved and the solid line is the summation of all the three terms. (b) The solid line is the fit to the single-component Preisach model.. Figures 2-22 and 2-23 present the measured data of the pure SSFLC (open squares) and the SSFLC cell with nc-ZnO doping (open triangles) and the corresponding fitting curves (solid lines) at 10KHz and 100KHz, respectively. At 10 kHz, the SSFLC cell doped with nc-ZnO cell exhibits a reversal C-V hysteretic curve, however the pure SSFLC cell displays similar CV reveal behavior at 100 kHz. The experimental data of the pure SSFLC cell require a good fit to Eq. (2-14) with three linear Preisach terms at 10K, and at 100 kHz but the SSFLC cell doped with nc-ZnO 39.
數據

+7
相關文件
substance) is matter that has distinct properties and a composition that does not vary from sample
The short film “My Shoes” has been chosen to illustrate and highlight different areas of cinematography (e.g. the use of music, camera shots, angles and movements, editing
"Extensions to the k-Means Algorithm for Clustering Large Data Sets with Categorical Values," Data Mining and Knowledge Discovery, Vol. “Density-Based Clustering in
The research proposes a data oriented approach for choosing the type of clustering algorithms and a new cluster validity index for choosing their input parameters.. The
(a) Find the unit vectors that are parallel to the tangent line to the curve at the point.. (b) Find the unit vectors that are perpendicular to the
For 5 to be the precise limit of f(x) as x approaches 3, we must not only be able to bring the difference between f(x) and 5 below each of these three numbers; we must be able
[This function is named after the electrical engineer Oliver Heaviside (1850–1925) and can be used to describe an electric current that is switched on at time t = 0.] Its graph
Consistent with the negative price of systematic volatility risk found by the option pricing studies, we see lower average raw returns, CAPM alphas, and FF-3 alphas with higher
