Development and Implementation of Performance Evaluation
System for a Water Treatment Plant: Case Study of Taipei
Water Treatment Plant
E.-E. Chang
1; Peng-Chi Chiang
2; Shu-Mei Huang
3; and Yi-Li Lin
4Abstract: To implement performance assessment, it is necessary to develop adequate and representative performance indicators. Good performance indicators can specify the measurable evidence that is necessary to document the achievement of a goal. To provide the higher quality and stable water to the customers, the water utilities themselves should establish the proper maintenance and management programs to enhance the availability of plant facilities and equipments in the water treatment plant. With the appropriate performance indicators, the objectives and/or targets of the business plan can be evaluated quantitatively. The aim of this research work is to set up the performance evaluation system for the Taipei water treatment plant. After the establishment of performance indicators 共seven in this research兲, the corresponding evaluation items and their relative weights were revealed throughout forum discussion and questionnaire survey and based on the comprehensive performance evaluation technique and analytic hierarchy process method, respectively. Mean-while, according to the results of performance evaluation and simulation studies by the developed model, an implementation plan for upgrading the performance of the Taipei water treatment plant was proposed, with two important items:共1兲 proper adjustment of the water production rate, PAC dosage, and sludge management for different turbidities in source water based on the required finished water quality can minimize the total treatment cost and enhance the performance of the water treatment plant; and共2兲 establishing a regular performance evaluation system to identify potential and existing problems so that correction action could be immediately taken. Developing a sound database program, and cooperating with the stakeholders for source water protection are the major tasks that should be implemented to achieve the objectives of safe drinking water and clean water.
DOI: 10.1061/共ASCE兲1090-025X共2007兲11:1共36兲
CE Database subject headings: Performance characteristics; Implementation.
Introduction
The concept of performance assessment has been in existence for decades. For example, “measuring municipal activities” was pro-mulgated in 1938 by the International City/County Management Association共ICMA 1999兲. This concept suggested various types of information that local governments could use to monitor and assess the quality and delivery of local services. To implement performance assessment, it is necessary to develop adequate and representative performance indicators. Good performance indica-tors can specify the measurable evidence necessary to document the achievement of goals. They can provide performance
ap-praisal standards, supply criteria for the evaluation of resource development, identify valid interventions, and define new organi-zational purposes. There are two critical uses of performance in-dicators:共1兲 to identify what should be accomplished and 共2兲 to provide criteria for determination of success or failure共Kaufman 1988兲. However, performance assessment is not adapted widely and effectively for enterprises and government-related entities be-cause of the lack of consistent information and experience 共Paralez 2001兲.
The Taipei water treatment plant, which is the major tap water supplier in the Great Taipei Metropolitan Area, provides 2⫻106m3 of drinking water per day, serves about 69% 共3.8
million users兲 of the total residents in the area. This plant is a publicly owned facility governed by the water production depart-ment in Taipei Water Company, and consists of grit removal, prechlorination, coagulation, sedimentation, filtration, and postchlorination. A sludge treatment process is employed to treat the backwashed wastewater and settled sludge. As a water utility, it must supply high-quality and stable water to their customers so that it can survive under strict competition 共TWD 2000兲. There-fore, appropriate performance indicators must be developed to provide scientific data and a systematic approach to achieve op-timum status for the water utility.
Regarding the operation of a water treatment plant managed by the water utility, a standard operating procedure is needed for achieving optimal performance in water quality control, water production, chemical cost reduction, and waste minimization. A proper maintenance program must be established for a water 1
Dept. of Biochemistry, Taipei Medical Univ., 250 Wu-Hsing Street, Taipei, Taiwan, Republic of China.
2
Graduate Institute of Environmental Engineering, National Taiwan Univ., 71 Chou-Shan Rd., Taipei, Taiwan, Republic of China.
3
Graduate Institute of Environmental Engineering, National Taiwan Univ., 71 Chou-Shan Rd., Taipei, Taiwan, Republic of China.
4
Graduate Institute of Environmental Engineering, National Taiwan Univ., 71 Chou-Shan Rd., Taipei, Taiwan, Republic of China 共corresponding author兲. E-mail: [email protected]
Note. Discussion open until June 1, 2007. Separate discussions must be submitted for individual papers. To extend the closing date by one month, a written request must be filed with the ASCE Managing Editor. The manuscript for this paper was submitted for review and possible publication on March 15, 2006; approved on April 18, 2006. This paper is part of the Practice Periodical of Hazardous, Toxic, and Radioactive Waste Management, Vol. 11, No. 1, January 1, 2007. ©ASCE, ISSN 1090-025X/2007/1-36–47/$25.00.
treatment plant to enhance the availability of plant facilities and equipments. A water utility must also have a sound management system thereby providing effective and efficient services for customers. With appropriate performance indicators, its operating performance and goals of achievement can be evaluated quantitatively.
The aim of this research is to set up the performance indicators and their major evaluation items and relative weight associated with each indicator and evaluation items for the Taipei water treatment plant. First of all, the performance evaluation system for the water production department in Taipei Water Company was originally developed through forum discussion, questionnaire survey, and analytic hierarchy process 共AHP兲 method. Second, the performance evaluation system for the Taipei water treatment plant was suggested by the integration of the performance evalu-ation system for the water production department in the Taipei Water Company and the comprehensive performance evaluation 共CPE兲 technique. The detailed evaluation items and their relative weight associated with each performance indicator were deter-mined based on a CPE technique and AHP method, respectively. Finally, an implementation plan for upgrading the performance of the Taipei water treatment plant was proposed in accordance with the results of performance simulation as well as problem analysis of operation and management information.
Methodology
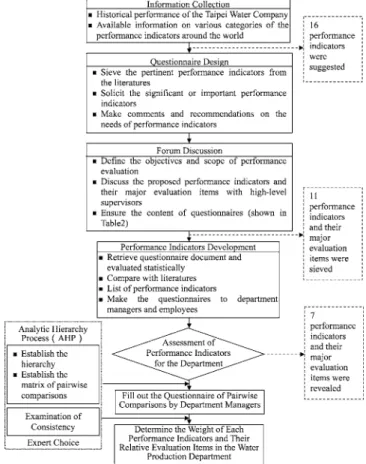
The schematic diagram of this research is shown in Fig. 1. There are two steps in the determination of performance indicators. In the first step, performance indicators and their major evaluation items were developed for the water production department in the Taipei Water Company共Fig. 2兲. In the second step, the developed performance evaluation system from the Water Production De-partment in conjunction with the CPE technique was introduced to establish the performance evaluation system in the Taipei water
treatment plant. The detailed description will be shown in the section, “Results and Discussion.”
AHP Method
Developed by Professor Saaty, AHP was used to determine the relative weight value of each performance indicator共Saaty 1980兲. It simplifies a complicated policy problem by analyzing the struc-ture of each level. The relative weight value of each indicator is determined by comparing pair matrices of standard structures. Results from surveys completed by the experts in this field are also used in this analysis.
In this study, the AHP method was used for the determina-tion of relative weight for each performance indicator and their major evaluation items used for the water production department. A questionnaire in the form of pair comparisons was sent to the managers in the water production department in the Taipei Water Company and managers in the Taipei water treatment plant, respectively. The evaluation scales were divided into five categories—extreme 共1 point兲, very 共3 points兲, somewhat 共5 points兲, slight 共7 points兲, and equally important 共9 points兲.
After statistical analysis of the retrieved data, it was found that it is difficult to obtain uniform agreement among results in the survey. Therefore, a process to evaluate the uniformity of the results should be conducted. According to Saaty’s recommenda-tions, nonuniformity is acceptable if the C.I.共consistency index兲 value is 0.1. Since persons filling out the survey form of this Fig. 1. Schematic diagram of this research
Fig. 2. Flow chart for establishment of performance evaluation
system in the water production department in the Taipei Water Company
study are not familiar with the level analysis method, the accept-able C.I. value was relaxed to 0.15. Answer sheets with C.I. val-ues greater than 0.15 were discarded.
CPE Technique
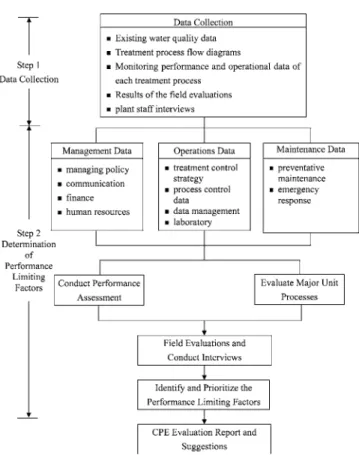
The CPE technique is a systematic step-by-step process for evalu-ating the performance of a water treatment plant. It can be used to improve the performance of existing water treatment plants and to achieve optimal performance 共USEPA 1998; Choi et al. 2002兲. There are two steps involved in the CPE technique, i.e., data collection and determination of performance-limiting factors 共shown in Fig. 3兲. After identifying and prioritizing the perfor-mance limiting factors, the evaluation reports are proposed by our technical group. The correlations of performance indicators with the management, maintenance, and operation parameters were in-vestigated in this study for the performance indicators in the Taipei water treatment plant.
Results and Discussion
Establishment of Performance Evaluation System for Water Production Department in Taipei Water Company
Sixteen performance indicators including water quality control, in-plant modification and contingency plan, water production rate, chemical cost reduction, equipment availability, waste minimiza-tion, source water producminimiza-tion, electricity consumpminimiza-tion, number of employees, reliability of equipments, maintenance of equipments, classification and utilization of maintenance information,
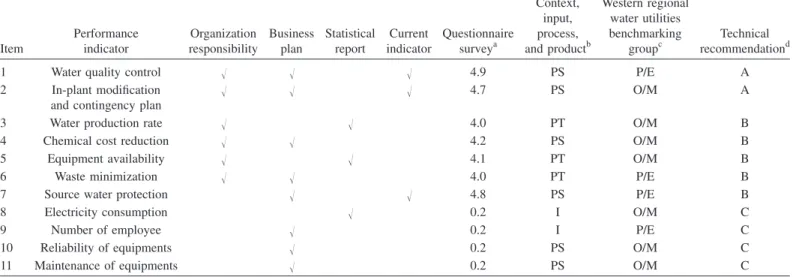
inspec-tion and maintenance of facilities, stability of water supply, ser-vice of water industry, and drinkable water supply were suggested by our technical advisors based on the available information from the currently performed evaluation indicators in the water produc-tion department, operaproduc-tional indicators from industry, financial indicators of city government, and performance indicators used in both context, input, process, and product共CIPP兲 and western re-gional water utilities benchmarking group共WRWUBG兲. The WR-WUBG provides lessons with useful insights about “layers” of data that exist in utilities, challenges in using data across those layers, and managing the data toward the goal of performance assessment 共Paralez 2001兲. In this paper, performance indicators are divided into the following four categories: execution; finan-cial; planning and engineering; and operation and maintenance. The framework of CIPP is employed to separate different kinds of performance indicators into four categories: context; input; pro-cess; and product. For the balance and integrity of performance assessment, indicators belonging to different categories should be well distributed and represented so that the results of performance assessment can display the effectiveness and efficiency of all pro-cesses, not just the “outcome.” The correlations between the presieved performance indicators and organization responsibility, business plan, statistical report, and current indicators of Taipei Water Company were evaluated. The characteristics of each per-formance indicator in the category of CIPP and WRWUBG were also classified.
After discussion with the high-level supervisors in the Taipei Water Company, it suggests that 11 among the presieved 16 per-formance indicators共shown in the second column in Table 1兲 may be adequate, but too copious. As a result, the above 11 presieved performance indicators were integrated into a questionnaire and sent to the authorized managers共20 persons兲 and the representa-tive employees共240 persons兲 in the water production department for further evaluation of these 11 performance indicators. The evaluation scales were divided into five categories as follows: very important 共5 points兲; important 共4 points兲; fair 共3 points兲; less important共2 points兲; and not important 共1 points兲. The con-tents of the questionnaire utilized in this investigation are shown in Table 2.
The calculated scores for each performance indicator are shown in the column of “questionnaire survey” in Table 1. Based on the practice utilized in the area of organization responsibility, business plan, statistical report, current indicator, CIPP and WRWUBG, and results of the questionnaire survey, the technical advisors recommended seven performance indicators共water qual-ity control, in-plant modification and contingency plan, water production rate, chemical cost reduction, equipment availability, waste minimization, and source water protection兲 as well as their major evaluation items being used for the water production de-partment共shown in Tables 1 and 2兲.
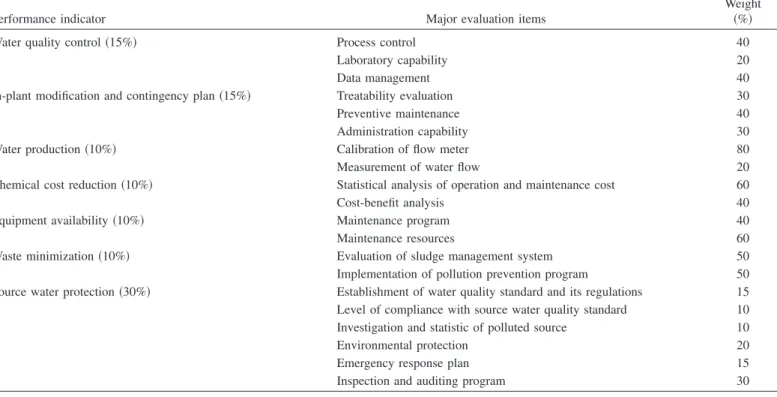
In the following, another questionnaire was drawn up in the form of pairwise comparisons for the determination of the relative weight value of each performance indicator and its major evalu-ation items. This questionnaire was filled out by 15 department managers and then analyzed by the AHP method. Results from the “expert choice” in analyzing the relative weight values of the seven performance indicators are shown in the first column in Table 3. The relative weight values of the major evaluation items are shown in the third column in Table 3.
Fig. 3. Flow chart of comprehensive performance evaluation
technique
Establishment of Performance Evaluation System for Taipei Water Treatment Plant
The performance evaluation system initially developed for the water production department was then used for the Taipei water treatment plant共Fig. 1兲. According to the CPE classification, the performance indicators recommended for the water production department were reorganized and categorized as follows: in-plant modification and contingency plan, chemical cost reduction, and source water protection 共CPE management, shown in Table 4兲; equipment availability共CPE maintenance, shown in Table 5兲; and water quality control, water production rate, and waste minimiza-tion 共CPE operation, shown in Table 6兲. In the following, the detailed evaluation items for each performance indicator were determined through integration of the performance evaluation system for the water production department and the CPE tech-nique so that the performance evaluation system for the Taipei water treatment plant was established. This information should be useful and applicable to all water treatment plants in Taiwan. Development of Implementation Plan for Upgrading Performance of Taipei Water Treatment Plant
This section will focus on an implementation plan for upgrading the performance of the Taipei Water Treatment Plant. The plan-ning tasks include problem identification, goal analysis, and strategy formulation.
Issue identification includes analysis of external environmental factors and analysis of internal factors. Detailed discussions are provided below.
Issue Identification
The external environmental factors affecting the operational man-agement of Taipei water treatment plant include the following: 1. Public demand: The improvement of living standards in
Taipei areas in the past several decades has resulted in public demand for quality water. Therefore, maintaining
high-Table 1. Comprehensive Review of Performance Indicators Selected for Water Production Department
Item Performance indicator Organization responsibility Business plan Statistical report Current indicator Questionnaire surveya Context, input, process, and productb Western regional water utilities benchmarking groupc Technical recommendationd
1 Water quality control 冑 冑 冑 4.9 PS P/E A
2 In-plant modification and contingency plan
冑 冑 冑 4.7 PS O/M A
3 Water production rate 冑 冑 4.0 PT O/M B
4 Chemical cost reduction 冑 冑 4.2 PS O/M B
5 Equipment availability 冑 冑 4.1 PT O/M B
6 Waste minimization 冑 冑 4.0 PT P/E B
7 Source water protection 冑 冑 4.8 PS P/E B
8 Electricity consumption 冑 0.2 I O/M C
9 Number of employee 冑 0.2 I P/E C
10 Reliability of equipments 冑 0.2 PS O/M C
11 Maintenance of equipments 冑 0.2 PS O/M C
a
Score of survey= summation the scores of items÷ number of retrieved questionnaire. b
C⫽context; I⫽input; PS⫽process; and PT⫽product. c
P/E⫽planning and engineering; and O/M⫽operation and maintenance
dA⫽strongly recommended 共for indicators with three “冑” and scores of questionnaire survey above 4.0兲; B⫽recommended 共for indicators with two “冑” and scores of questionnaire survey above 4.0兲; and C⫽not recommended 共for indicators with less than two “冑” and scores of questionnaire survey below 4.0兲.
Table 2. Contents of Questionnaire for Soliciting Performance Indicators
Department name
Solicit the significant or important performance indicators
共Hint: Give points from 5 to 1 depending upon its relative importance. Points 5: very important; Points 4: important; Points 3: fair; Points 2: less important; Point 1: not important兲
1. Water quality control
2. In-plant modification and contingency plan 3. Water production rate
4. Chemical cost reduction 5. Equipment availability 6. Waste minimization 7. Source water protection 8. Electricity consumption 9. Number of employee 10. Reliability of equipments 11. Maintenance of equipments
Make comments and recommendations on needs of performance indicators
1. What are the workload, ability, moral, and loyalty of employees in your department?
2. What is your impression about “authorization” in your department?
3. What is your response or impression after the “outcome assessment”?
4. What is your correction plan if you cannot achieve your objective? 5. How does your business plan or annual budget affect your implementation plans?
6. What are your strategies or action plans to upgrade your company performance; please point out the most significant task force should be implementing.
quality drinking water is an essential goal of the Taipei water treatment plant.
2. Present and potential market competitors: Bottled water is becoming popular in Taiwan due to reasonable price and convenience. Besides bottled water, desalination technology is also an option for the public as well as for industries in selecting alternate sources of drinking water.
3. Stability of source water quality: Maintaining stable source water quality is the most important external environmental factor. The important factors affecting the source water qual-ity were as follows: 共1兲 eutrophication; 共2兲 high turbidity during storms; and 共3兲 pollution due to discharge of toxic substances. Source water protection to achieve good quality of raw water should be a higher priority than improvement of treatment processes to achieve better finished water quality when source water quality is poor. Achieving good quality of source water requires the cooperation of citizens and govern-ment. Public awareness of ecology and the importance of source water protection are essential in achieving the source water protection goals.
Internal factors affecting the operational management of the Taipei water treatment plant include the following items: 1. Limiting factors from CPE: According to the
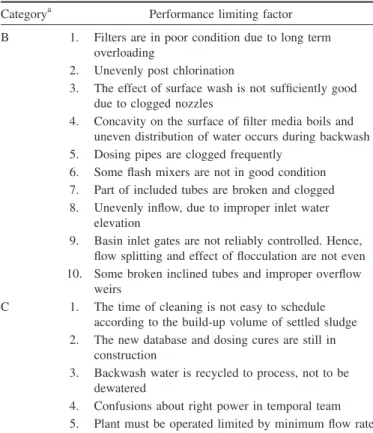
comprehen-sive performance evaluation of the Taipei water treatment plant, except for the filtration process, the capacities of all treatment processes are designed adequately. However, im-provement must be made in operation for these processes. A CPE conducted at the Taipei water treatment plant in 2001 showed problems regarding the design, operation, and maintenance of the plant. Analysis found fifteen 共15兲 minor limiting factors, which are summarized in Table 7 共Chen et al. 2002兲.
2. Lack of young professionals: The service year span of all employees in the water plant indicates that approximately 68% of the employees have been there for more than 15 years. This means that most of the employees have good
experience in plant operation and emergency response. How-ever, a lack of young employees with modern skills to develop innovative technologies or integrated management systems can be a drawback. It is, therefore, recommended that employees have intensive education and training pro-grams particularly in the area of information technology. Results from the issue identification will be used as a back-bone in formulating a feasible management strategy.
The most important operational management goal for the Taipei water treatment plant is to maintain good water quality regardless of variations in raw water quality. The operational management goals are excellent source water quality, adequate water quantity, and excellent finished water quality.
Optimization of Performance
In our previous paper共Chang et al. 2005兲, it was reported that the total coliforms, total organic carbon共TOC兲, and chemical oxygen demand 共COD兲 were selected as the major parameters because of their specific characteristics associated with the disinfection efficiency and disinfection by-products formation and in compli-ance with source water quality in Taiwan. Since all the major water quality parameters, i.e., TOC, COD, NH3-N, total
coli-forms, As, Pb, Cd, Cr, Hg, and Se can meet the source water quality standards, these parameters can be easily treated to achieve the drinking water quality standards in this selected water treatment plant. However, the turbidity affected the quality and quantity of the water supply system and became the local envi-ronmental issue, especially during the typhoon periods. Therefore, the turbidity would be selected as the major factor for perfor-mance evaluation in this research work.
In order to optimize the performance of the Taipei water treat-ment plant, two objective functions 共water production cost and removal efficiency兲 incorporated with four performance indica-tors 共water quality control, water production rate, chemical cost reduction, and waste minimization兲 are integrated to develop 12 mathematical equations in this research to simulate the
perfor-Table 3. Major Evaluation Items and Corresponding Weight for Performance Indicators in Production Department of Taipei Water Company
Performance indicator Major evaluation items
Weight 共%兲
Water quality control共15%兲 Process control 40
Laboratory capability 20
Data management 40
In-plant modification and contingency plan共15%兲 Treatability evaluation 30
Preventive maintenance 40
Administration capability 30
Water production共10%兲 Calibration of flow meter 80
Measurement of water flow 20
Chemical cost reduction共10%兲 Statistical analysis of operation and maintenance cost 60
Cost-benefit analysis 40
Equipment availability共10%兲 Maintenance program 40
Maintenance resources 60
Waste minimization共10%兲 Evaluation of sludge management system 50
Implementation of pollution prevention program 50 Source water protection共30%兲 Establishment of water quality standard and its regulations 15 Level of compliance with source water quality standard 10 Investigation and statistic of polluted source 10
Environmental protection 20
Emergency response plan 15
Inspection and auditing program 30
mance of the Taipei water treatment plant with different operation parameters. We also propose the strategies on reducing sediment and turbidity in raw water for source water protection. The devel-oped equations and parameters based on the available data from the Taipei water treatment plant are summarized in Table 8.
The first objective function is water production cost关Eq. 共1兲 in Table 8兴, which is made up by the cost of coagulation 关use 共PAC兲 as coagulant兴, cost of disinfection 共use chlorine as disinfectant兲, cost of electricity, and cost of sludge management关Eqs. 共3兲, 共6兲, 共8兲, and 共10兲 in Table 8兴. The cost of each component is calcu-lated by the product of the unit cost and the amount of consump-tion. The second objective function is removal efficiency关Eq. 共2兲 in Table 8兴, which is related to the amount of PAC addition 共PAC⬘兲, surface flow rate of grit chamber 共SORp兲, surface flow
rate of sedimentation tank 共SORs兲, and filtration rate of rapid
filtration tank 共FR兲. The basic equations 关Eqs. 共1兲–共3兲, 共6兲, 共8兲, and共10兲兴 presented in Table 8 were originally developed by Wu 共1986兲, and modified and validated by the available water quality
data and operational data of each treatment unit gathered from 1998 to 2000 in this research. Consequently, these developed equations can be used to simulate the operating conditions in the Taipei water treatment plant to enable development of an imple-mentation plan to optimize the performance of the plant.
The cost of coagulation is related to PAC dosage关Eqs. 共4兲 and 共5兲兴, which is a function of turbidity in source water obtained from the results of jar tests. The experimental data are fairly con-sistent with the results predicted by Eq.共4兲 shown in Fig. 4. The cost of disinfection is related to chlorine consumption关Eq. 共7兲兴. The cost of electricity is composed of electricity consumption of rapid filtration, coagulation, and sludge pumping 关Eq. 共9兲兴. The cost of sludge management in terms of source water turbidity, PAC addition, and water content is calculated as Eq.共11兲.
Nonlinear regression analysis was used to determine the pa-rameters in objective function of removal efficiency关Eq. 共2兲兴 and the results are presented in Eq.共12兲.
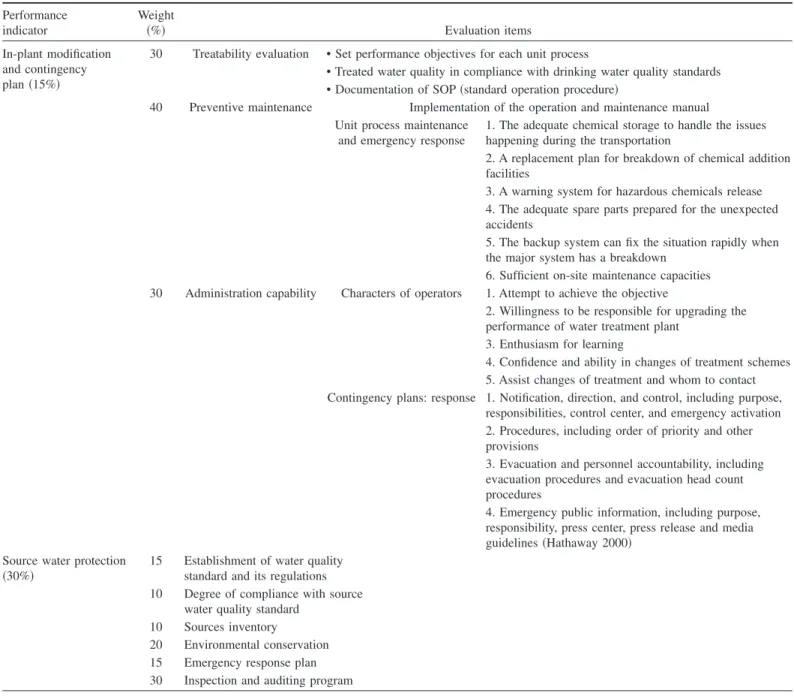
Table 4. Performance Indicators Categorized as Comprehensive Performance Evaluation Management and Their Detailed Evaluation Items Suggested by
Comprehensive Performance Evaluation Practice Performance indicator Weight 共%兲 Evaluation items In-plant modification and contingency plan共15%兲
30 Treatability evaluation • Set performance objectives for each unit process
• Treated water quality in compliance with drinking water quality standards • Documentation of SOP共standard operation procedure兲
40 Preventive maintenance Implementation of the operation and maintenance manual Unit process maintenance
and emergency response
1. The adequate chemical storage to handle the issues happening during the transportation
2. A replacement plan for breakdown of chemical addition facilities
3. A warning system for hazardous chemicals release 4. The adequate spare parts prepared for the unexpected accidents
5. The backup system can fix the situation rapidly when the major system has a breakdown
6. Sufficient on-site maintenance capacities 30 Administration capability Characters of operators 1. Attempt to achieve the objective
2. Willingness to be responsible for upgrading the performance of water treatment plant
3. Enthusiasm for learning
4. Confidence and ability in changes of treatment schemes 5. Assist changes of treatment and whom to contact Contingency plans: response 1. Notification, direction, and control, including purpose,
responsibilities, control center, and emergency activation 2. Procedures, including order of priority and other provisions
3. Evacuation and personnel accountability, including evacuation procedures and evacuation head count procedures
4. Emergency public information, including purpose, responsibility, press center, press release and media guidelines共Hathaway 2000兲
Source water protection
共30%兲 15 Establishment of water qualitystandard and its regulations 10 Degree of compliance with source
water quality standard 10 Sources inventory
20 Environmental conservation 15 Emergency response plan 30 Inspection and auditing program
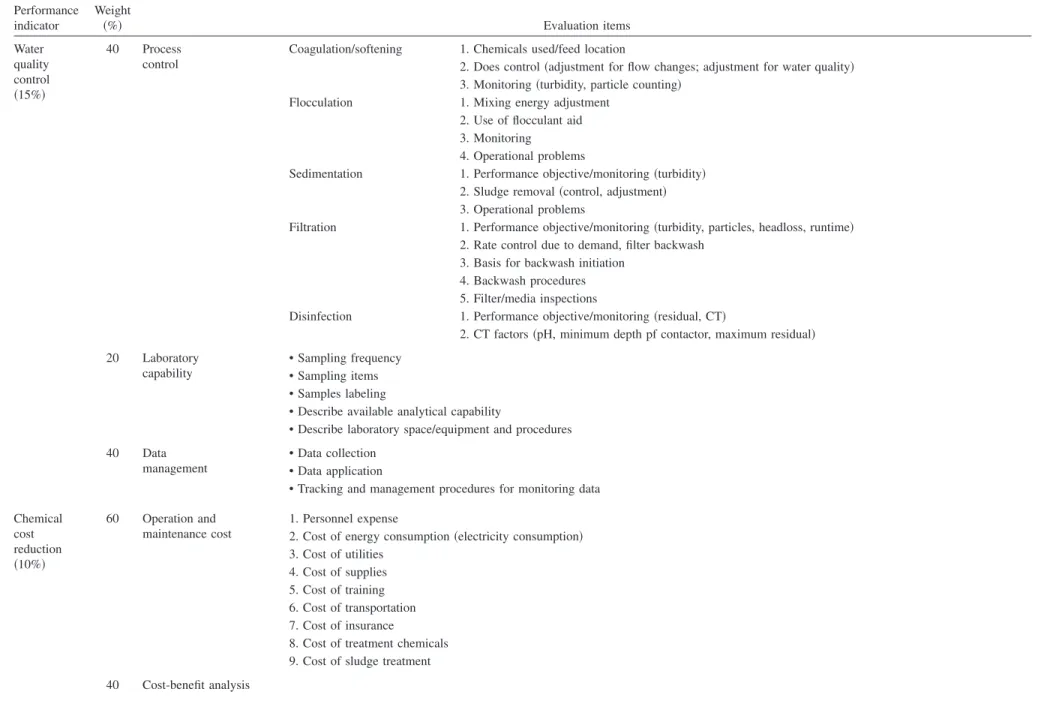
Table 5. Performance Indicators Categorized as Comprehensive Performance Evaluation Operation and Their Detailed Evaluation Items Suggested by Comprehensive Performance Evaluation Practice Performance indicator Weight 共%兲 Evaluation items Water quality control 共15%兲 40 Process control
Coagulation/softening 1. Chemicals used/feed location
2. Does control共adjustment for flow changes; adjustment for water quality兲 3. Monitoring共turbidity, particle counting兲
Flocculation 1. Mixing energy adjustment
2. Use of flocculant aid 3. Monitoring
4. Operational problems
Sedimentation 1. Performance objective/monitoring共turbidity兲
2. Sludge removal共control, adjustment兲 3. Operational problems
Filtration 1. Performance objective/monitoring共turbidity, particles, headloss, runtime兲
2. Rate control due to demand, filter backwash 3. Basis for backwash initiation
4. Backwash procedures 5. Filter/media inspections
Disinfection 1. Performance objective/monitoring共residual, CT兲
2. CT factors共pH, minimum depth pf contactor, maximum residual兲
20 Laboratory
capability
• Sampling frequency • Sampling items • Samples labeling
• Describe available analytical capability
• Describe laboratory space/equipment and procedures
40 Data
management
• Data collection • Data application
• Tracking and management procedures for monitoring data Chemical cost reduction 共10%兲 60 Operation and maintenance cost 1. Personnel expense
2. Cost of energy consumption共electricity consumption兲 3. Cost of utilities
4. Cost of supplies 5. Cost of training 6. Cost of transportation 7. Cost of insurance
8. Cost of treatment chemicals 9. Cost of sludge treatment 40 Cost-benefit analysis 42 / PRACTICE PERIODICAL OF HAZARDOUS, T OXIC, AND RADIOACTIVE W ASTE MANAGEMENT © ASCE / J ANUARY 2007
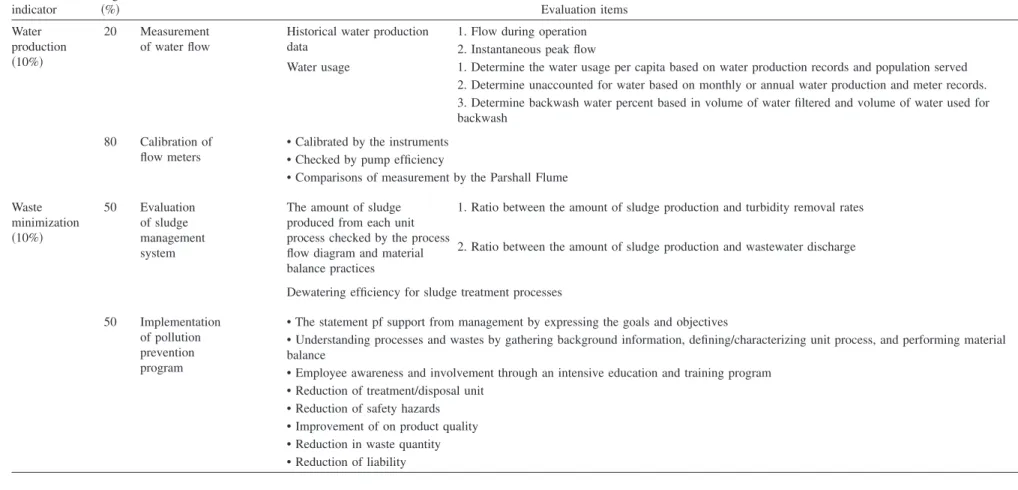
Table 5. 共Continued.兲 Performance indicator Weight 共%兲 Evaluation items Water production 共10%兲 20 Measurement of water flow
Historical water production data
1. Flow during operation 2. Instantaneous peak flow
Water usage 1. Determine the water usage per capita based on water production records and population served
2. Determine unaccounted for water based on monthly or annual water production and meter records. 3. Determine backwash water percent based in volume of water filtered and volume of water used for backwash
80 Calibration of
flow meters
• Calibrated by the instruments • Checked by pump efficiency
• Comparisons of measurement by the Parshall Flume Waste minimization 共10%兲 50 Evaluation of sludge management system
The amount of sludge produced from each unit process checked by the process flow diagram and material balance practices
1. Ratio between the amount of sludge production and turbidity removal rates 2. Ratio between the amount of sludge production and wastewater discharge
Dewatering efficiency for sludge treatment processes
50 Implementation
of pollution prevention program
• The statement pf support from management by expressing the goals and objectives
• Understanding processes and wastes by gathering background information, defining/characterizing unit process, and performing material balance
• Employee awareness and involvement through an intensive education and training program • Reduction of treatment/disposal unit
• Reduction of safety hazards • Improvement of on product quality • Reduction in waste quantity • Reduction of liability PRACTICE PERIODICAL OF HAZARDOUS, T OXIC, AND RADIOACTIVE W ASTE MANAGEMENT © ASCE / J ANUARY 2007 / 43
Tr⬘=Ti− Te Ti = 143.4⫻ PAC⬘ 1.99+ 998600 1.77⫻ 10−3⫻ SORp⫻ SORs⫻ FR + 925300 共12兲 The average error between the observed data and the simulated results shown in Fig. 5 is 5.1%, which indicates that this equation can be introduced to estimate the removal efficiency of turbidity in source water by the water treatment plant.
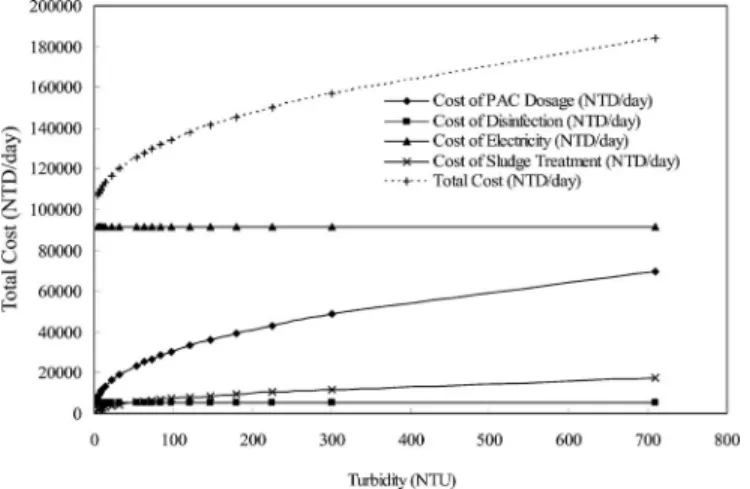
By integrating the data of turbidity and water production rate in the Taipei water treatment plant into Eqs.共4兲, 共5兲, 共7兲, 共9兲, and 共11兲, the relationships among turbidity in source water, water pro-duction rate, and four categories of cost including coagulation, disinfection, electricity, and sludge management were disclosed. As shown in Figs. 6 and 7, it is obvious that the total treatment cost increases with increasing water production rate and the tur-bidity in source water. The higher the turtur-bidity in the source water, the greater the cost of coagulation and sludge management, especially for the case of turbidity greater than 710 NTU. On the other hand, the cost of electricity and disinfection are not greatly influenced by turbidity in the source water. As for the increase of water production rate, the cost of the above-mentioned four cat-egories will all increase.
Implementation Plans
Afterward, two suggestions are made for the Taipei water treat-ment plant. First of all, lower the water production rate for high turbidity in source water and heighten the water production rate for low turbidity in source water for the maintenance of total treatment cost. Second, establish a manual of optimal operation parameters. Proper adjustment of the water production rate, PAC dosage, and sludge management for different turbidities in source water based on the required finished water quality can minimize the total treatment cost and optimize the performance of the water treatment plant.
In order to put the simulation results into application and solve the performance limiting factors 共shown in Table 8兲 at the same time so as to upgrade the performance of the Taipei water treat-ment plant, the general principles are suggested as follows, ac-cording to the previously suggested performance indicators 共shown in Tables 4–6兲:
1. Establishing a regular performance evaluation system to re-alize the potential and existing problems so that corrective action can be immediately taken;
2. Evaluating the overall performance of the water treatment plant by the technical committee so that suggestions to the plant manager can be made objectively;
3. Building up partnerships with other water treatment plants and exchanging technology experiences frequently;
4. Developing a sound database to provide a scientific approach for optimizing the performance of the water treatment plant; and
5. Proposing a strategic plan for cooperating with stakeholders for source water protection.
The first recommended strategic plan is to complete and ex-ecute a source water protection plan for the Taipei water treatment plant. It was mentioned in the previous section that maintaining stable source water quality is the most important external envi-ronmental factor affecting the operational management of the plant. Therefore, protecting the source water of the Taipei water treatment plant by implementing the National Policy is the first task to be carried out. The National Policy should include共1兲 soil conservation policies in reducing soil erosion and sediment in the reservoir,共2兲 evaluation and development of appropriate soil conservation practices, best management practices共BMP兲 in re-ducing sediment in the reservoir, and 共3兲 determination of the sediment sources by using the TMDL共total maximum daily load兲 approaches to assign sediment load allocation to each tributary of the reservoir.
In the past decade, pollution control in Taiwan focused on point source management. However, nonpoint source pollution control is currently receiving much attention. Policies regarding TMDL and BMPs are currently being drafted by the Taiwan Environmental Protection Administration 共TEPA兲 to minimize nonpoint source pollution. TMDL is a water quality base strategic plan to minimize pollutant load to a watershed. Data for deter-mining TMDL include background water quality data, hydrologic data of a watershed, locations of point and nonpoint sources, and characteristics of pollutants 共USEPA 1999兲. The Taipei water
Table 7. Performance Limiting Factors for Taipei Water Treatment Plant
Categorya Performance limiting factor B 1. Filters are in poor condition due to long term
overloading
2. Unevenly post chlorination
3. The effect of surface wash is not sufficiently good due to clogged nozzles
4. Concavity on the surface of filter media boils and uneven distribution of water occurs during backwash 5. Dosing pipes are clogged frequently
6. Some flash mixers are not in good condition 7. Part of included tubes are broken and clogged 8. Unevenly inflow, due to improper inlet water
elevation
9. Basin inlet gates are not reliably controlled. Hence, flow splitting and effect of flocculation are not even 10. Some broken inclined tubes and improper overflow
weirs
C 1. The time of cleaning is not easy to schedule according to the build-up volume of settled sludge 2. The new database and dosing cures are still in
construction
3. Backwash water is recycled to process, not to be dewatered
4. Confusions about right power in temporal team 5. Plant must be operated limited by minimum flow rate a
CPE classification system for prioritizing performance limiting factors to three categories: A⫽major effect on a long-term, repetitive basis; B⫽minor effect on a routine basis or major effect on a periodic basis; and C⫽minor effect.
Table 6. Performance Indicators Categorized as Comprehensive
Performance Evaluation Maintenance and Their Detailed Evaluation Items Suggested by Comprehensive Performance Evaluation Practice Performance indicator Weight 共%兲 Evaluation Items Equipment availability 共10%兲 40 Maintenance program • Preventive maintenance • Corrective maintenance • Predictive maintenance • Housekeeping 60 Maintenance resources
• Equipment repair and parts • Maintenance expertise • Work space and tools
treatment plant should cooperate with the TEPA to execute the TMDL plan by identifying problems, establishing water quality goals, investigating pollution sources, evaluating the relationship between water quality criteria and pollution sources, distributing pollutant loads, establishing monitoring and followup plans, and finalizing TMDL and integration.
Conclusions
Performance evaluation systems for the water production depart-ment in the Taipei Water Company and Taipei water treatdepart-ment plant were developed throughout this investigation. By reviewing and screening the literatures, discussion in the forums and analyz-ing the results of questionnaire survey, seven performance indicators 共water quality control, in-plant modification and
con-Fig. 4. Relationship between experimental data and predicted data of
PAC dosage with respect to turbidity at Taipei water treatment plant
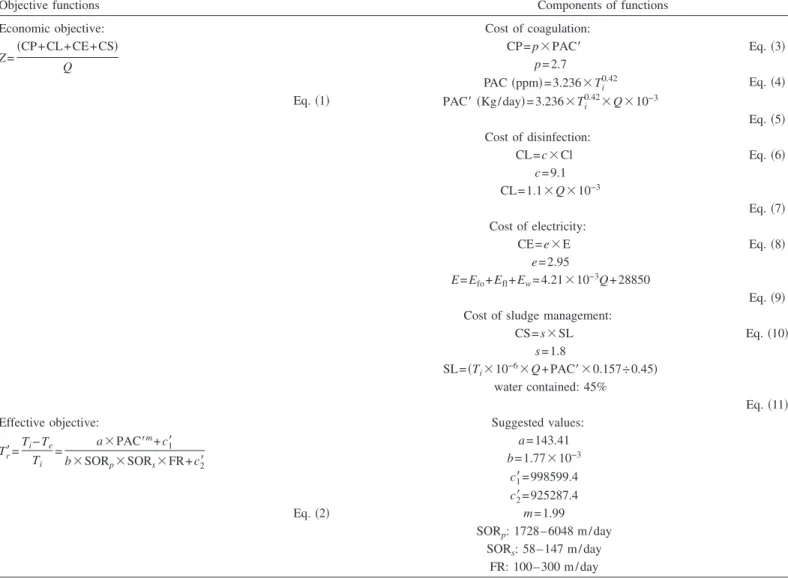
Table 8. Objective Functions for Taipei Water Treatment Plant
Objective functions Components of functions
Economic objective: Cost of coagulation:
Z =共CP+CL+CE+CS兲 Q CP= p⫻PAC⬘ Eq.共3兲 p = 2.7 PAC共ppm兲=3.236⫻Ti 0.42 Eq.共4兲
Eq.共1兲 PAC⬘共Kg/day兲=3.236⫻Ti
0.42⫻Q⫻10−3 Eq.共5兲 Cost of disinfection: CL= c⫻Cl Eq.共6兲 c = 9.1 CL= 1.1⫻Q⫻10−3 Eq.共7兲 Cost of electricity:
CE= e⫻E Eq.共8兲
e = 2.95
E = Efo+ Efl+ Ew= 4.21⫻10−3Q + 28850
Eq.共9兲 Cost of sludge management:
CS= s⫻SL Eq.共10兲
s = 1.8
SL=共Ti⫻10−6⫻Q+PAC⬘⫻0.157÷0.45兲 water contained: 45%
Eq.共11兲
Effective objective: Suggested values:
Tr⬘= Ti− Te Ti = a⫻PAC⬘m+ c 1 ⬘ b⫻SORp⫻SORs⫻FR+c2⬘ a = 143.41 b = 1.77⫻10−3 c1⬘= 998599.4 c2⬘= 925287.4 Eq.共2兲 m = 1.99 SORp: 1728– 6048 m / day SORs: 58– 147 m / day FR: 100– 300 m / day
Fig. 5. Relationship between monitoring data and predicted data of
turbidity removal efficiency at Taipei water treatment plant
tingency plan, water production rate, chemical cost reduction, equipment availability, waste minimization, and source water protection兲 as well as their major evaluation items were pro-posed to the water production department. Then the selected performance indicators were analyzed by the AHP method with the expert choice software to determine the relative weight value of each performance indicator and their major evaluation items.
According to the CPE practice, the performance evaluation system initially developed for the water production department can be categorized into management, maintenance, and operation areas and then used for the Taipei water treatment plant with the determination of detailed evaluation items for each performance indicator. This very unique experience could be transferred to other water treatment plants in Taiwan.
Through a series review by the CPE practice at the Taipei water treatment plant, external problems and internal performance-limiting factors were discovered. In order to achieve the goals of excellent source water quality, adequate water qual-ity, and excellent finished water qualqual-ity, two objective functions 共water production cost and removal efficiency兲 are developed and analyzed to draw out an implementation plan for optimizing the performance of the Taipei water treatment plant. Proper adjust-ment of the water production rate, PAC dosage, and sludge
management for different turbidities in source water based on the required finished water quality can minimize the total treat-ment cost and enhance the performance of the water treattreat-ment plant. In addition, establishing a regular performance evaluation system to identify potential and existing problems so that cor-rection action could be immediately taken, developing a sound database program, and cooperating with the stakeholders for source water protection are the major tasks that should be imple-mented to achieve the objectives of safe drinking water and clean water.
Notation
The following symbols are used in this paper: a ⫽ parameter of Eq. 共11兲;
b ⫽ parameter of Eq. 共11兲;
c ⫽ cost of unit disinfectant 共kg/NTD兲; c1⬘ ⫽ parameter of Eq. 共11兲;
c2⬘ ⫽ parameter of Eq. 共11兲;
CE ⫽ cost of electricity 共NTD/day兲; Cl ⫽ addition of disinfectant 共kg/day兲; CL ⫽ cost of disinfection 共NTD/day兲; CP ⫽ cost of coagulation 共NTD/day兲; CS ⫽ cost of sludge management 共NTD/day兲;
e ⫽ cost of unit electricity 共NTD/kW/h兲;
E ⫽ electricity consumption of equipment 共kW/h/day兲; Efl ⫽ electricity consumption of rapid filtration tank
共kW/h/day兲;
Efo ⫽ electricity consumption of coagulation tank
共kW/h/day兲;
Ew ⫽ electricity consumption of sludge pumping
共kW/h/day兲;
FR ⫽ filtration rate of rapid filtration tank 共m/day兲;
m ⫽ parameter of Eq. 共11兲;
p ⫽ cost of unit coagulant 共kg/NTD兲;
PAC ⫽ addition of PAC 共ppm兲; PAC⬘ ⫽ addition of PAC 共kg/day兲;
Q ⫽ water production rate 共m3/ day兲;
s ⫽ cost of unit sludge management 共kg/NTD兲;
SL ⫽ sludge production 共kg/day兲;
SORp ⫽ surface flow rate of grit chamber 共m/day兲;
SORs ⫽ surface flow rate of sedimentation tank 共m/day兲;
Te ⫽ turbidity in finished water 共NTU兲;
Ti ⫽ turbidity in source water 共NTU兲;
Tr⬘ ⫽ removal efficiency of turbidity 共%兲; and Z ⫽ unit treatment cost 共NTD/day兲.
References
Chang, E. E., Chiang, P. C., Lin, Y. L., and Tsai, H. P.共2005兲. “Evaluation of source water quality standards for total coliforms, TOC, and COD in Taiwan.” Pract. Period. Hazard. Toxic Radioact. Waste Manage.,
9共3兲, 193–203.
Chen, M. L., Fan, F. Y., Chen, C. C., and Shih, M. H. 共2002兲. “An approach to optimizing the performance of ChihTan water purification plant of Taipei Water Department.” 8th Int. Conf. on Drinking Water Quality Management and Treatment Technology, Kaohsiung, Taiwan. Choi, S., Yun, Z., Yoon, J., Hong, J., and Lee, Y.共2002兲. “Performance evaluation program of water treatment plant in Korea.” Water Sci. Technol.: Water Supply, 2共5–6兲, 143–148.
Fig. 6. Relationship between components of cost and turbidity in
source water
Fig. 7. Relationship between components of cost and water
production rate
Hathaway, R. A. 共2000兲. “Contingency plans V: Response.” Chem. Health Safety, 7共1兲, 10–14.
International City/County Management Association 共ICMA兲. 共1999兲. “Beyond data: Current uses of comparative performance measurement in local government.” Washington, D.C.
Kaufman, R.共1988兲. “Preparing useful performance indicators.” Training Development, 52共9兲, 80–83.
Paralez, L. L.共2001兲. “Performance assessment in US water and waste-water utilities.” J. Am. Water Works Assoc., 93, 68–76.
Saaty, T. L. 共1980兲. The analytic hierarchy process, McGraw-Hill, New York.
Taipei Water Department共TWD兲. 共2000兲. Water supply of Taipei, Print Printing Co., Ltd., Taipei.
U.S. Environmental Protection Agency 共USEPA兲. 共1998兲. “Handbook: Optimizing water treatment plant performance using the composite correction program.” EPA/625/6-91/027, Cincinnati.
U.S. Environmental Protection Agency 共USEPA兲. 共1999兲. “Draft guid-ance for water quality-based decisions: The TMDL process, 2nd Ed.” EPA-841-D-99-001, Washington, D.C.
Wu, M. Y. 共1986兲. “Optimization design of water treatment and its evaluation.” Ph.D. thesis, National Taiwan Univ., Taiwan, Republic of China.