Exploring causal relationships and critical factors affecting a country’s ICT
global competitiveness
Wei-Wen Wu*
Department of International Trade Ta-Hua Institiute of Technology, Taiwan
E-mail: [email protected] Lawrence W. Lan
Department of Marketing and Logistics Management Ta-Hua Institiute of Technology, Taiwan
Yu-Ting Lee
Department of International Trade Ta-Hua Institiute of Technology, Taiwan
Abstract
The Global Information Technology Report published by World Economic Forum used Networked Readiness Index (NRI) to measure the global competitiveness of a country’s information and communication technologies (ICT). The NRI covers three subindexes with nine pillars, which are treated with equal weights. It does not explore the causal relationships. In order to provide more information to the policymakers for better decisions making, this paper proposes a solution framework to create the causal relationships among the pillars and overall NRI scores, and furthermore, to identify the critical factors affecting the overall NRI scores. Three techniques are employed in the solution framework: super-efficiency data envelopment analysis, Bayesian network classifiers, and partial least squares path modeling. An empirical study is carried out. Policy implications to advance a country’s ICT competiveness are discussed according to the empirical results.
Keywords: causal relationship, information and communication technologies, World Economic
Forum
Exploring causal relationships and critical factors affecting a country’s ICT
global competitiveness
1. Background
Over the past decade, the World Economic Forum (WEF) has published a series of annual reports in various areas such as financial development, trade, travel and tourism, gender gap, information technology, among others. Some of which are on the country basis (e.g., Africa Competitiveness Report 2009, Country Studies: Mexico 2007-2008); some others are on the global basis (e.g., Global Competitiveness Report 2009-2010; Global Information Technology Report 2008-2009; Global Gender Gap Report 2008).
It is interesting to note that in the Global Competitiveness Report 2009-2010, for instance, the WEF used Global Competitiveness Index (GCI) to measure the global competitiveness of each country. The GCI is a weighted score from twelve pillars of competitiveness under three main subindexes—basic requirements, efficiency enhancers, innovation and sophisticated factors. All the countries were divided into five groups, according to their income thresholds (i.e., GDP per capita) for establishing stage development, and different weights were used for the three main subindexes at each stage of development. In general, the results are viewed quite fair.
Unlike the Global Competitiveness Report, however, in the Global Information Technology Report 2009-2010, the WEF used Networked Readiness Index (NRI) to measure the global competitiveness of a country’s information and communication technologies (ICT). The NRI covers three subindexes (environment, readiness, usage) with nine pillars, which are respectively denoted as E1 (market environment), E2 (political and regulatory environment), and E3 (infrastructure environment) under the environment subindex; R1 (individual readiness), R2 (business readiness), and R3 (government readiness) under the readiness subindex; U1 (individual usage), U2 (business usage), and U3 (government usage) under the usage subindex. Some sixty-eight components are further utilized to elucidate the nine pillars. Details of the 68 components, 9 pillars, and 3 subindexes under the NRI are summarized in Appendix 1 (Dutta and Mia, 2010).
In this Report, the final NRI score for each country is a simple average of the three composing subindex scores; wherein the score for each subindex is also a simple average of its composing pillars. In other words, all of the nine pillars have been strongly assumed with equal contributions to a country’s networked readiness, which is of course not true. Treating the nine pillars with identical weights (equal importance) is neither sound nor useful. In theory, it would be more reasonable if one could have introduced an appropriate method that can objectively reflect the relative importance of a set of criteria (pillars) rather than subjectively assign identical weights to them. In practice, the final NRI scores and rankings in this Report have revealed no information about the causal relationships amongst these pillars. And this can deteriorate the quality of decision-making in determining the most critical items to enhance a country’s competiveness of ICT.
It is essential for the policymakers to understand the causal relationships amongst pillars within the NRI so as to advance the decision-making quality and thereby facilitate the process of transforming strategic objectives into effective actions (Wu, 2010). With causal relationships, the policymakers can concentrate on the critical pillars and the corresponding components which bring in the greatest economic benefits. However, establishment and identification of the causal relationships amongst the nine pillars within the NRI can be a complicated and challenging issue.
To perform causal analyses, the causal directions between pillars must be explored first. Once the causal directions are confirmed, the hypotheses can then be effectively developed. Finally, by testing the hypotheses one can easily scrutinize the most critical pillars affecting the overall ICT competiveness of a country.
Based on this, the present paper aims to propose a solution framework to (1) create the causal relationships amongst the nine pillars within the NRI, (2) utilize the causal directions to develop hypotheses, and (3) test the hypotheses to find out the most crucial pillars. The proposed framework will incorporate with three specific techniques: super-efficiency data envelopment analysis (DEA), Bayesian network (BN) classifiers with tree augmented Naïve Bayes (TAN), and partial least squares (PLS) path modeling. An empirical study is carried out to demonstrate the applicability of the proposed approach. The NRI scores used in the empirical study are directly drawn from the Global Information Technology Report 2009-2010.
The remainder of this paper is organized as follows. Section 2 briefly explains the methodologies including super-efficiency DEA, BN classifiers, PLS path modeling and the proposed approach. Section 3 conducts an empirical study and discusses the managerial implications based on the findings. Finally, the conclusions and recommendations for future research are presented.
2. Methodologies
2.1 Data envelopment analysisThe data envelopment analysis (DEA) is a useful non-parametric technique to assess the relative efficiency of decision making units (DMUs). It employs linear programming to determine the relative efficiencies of a set of homogeneous and comparable units. The relative efficiency can be defined as the ratio of total weighted output to total weighted input. Since the DEA method has some advantages (e.g., one can handle multi-output multi-input production technologies without the need of specifying the functional form in prior (Cook et al., 2004); especially, DEA method allows each candidate to choose its own weights in order to maximize the overall ratings subject to certain conditions), a variety of DEA models have been developed and widely applied in different areas for performance measurement and benchmarking over the past three decades.
According to Golany and Roll (1989), Adler et al. (2002), as well as Cook and Seiford (2009), the most popular DEA models include the CCR model (Charnes et al., 1978), the BCC model (Banker et al., 1984), and the super-efficiency model (Andersen and Petersen, 1993). The CCR model measures the overall efficiency for each unit, which assumes a constant returns-to-scale relationship between inputs and outputs. Moreover, the CCR model does not place any restrictions on the weights in the model, but it is possible for units to be rated as efficient through a very uneven distribution of weights. Unlike the CCR model with assumption of constant returns-to-scale, the BCC model adds an additional constant variable in order to allow variable returns-to-scale. Thus, the BCC model permits an increase in inputs without generating a proportional change in outputs. The overall efficiency of a CCR model divided by the technical efficiency of a BCC model will define the scale efficiency.
Generally, CCR or BCC models produce an efficiency score (between zero and one) for each DMU. All DMUs with score 100% are regarded as relatively efficient, while those units with score less than 100% are viewed as relatively inefficient. A CCR or BCC model evaluates the relative efficiency of DMUs, but does not allow for a ranking of the efficient units themselves
(Golany and Roll, 1989). For the purpose of ranking, Andersen and Petersen (1993) first developed the super-efficiency DEA model which can not only measure the relative efficiency of DMUs but also rank the efficient units. This is because the super-efficiency model enables an extreme efficient unit to achieve an efficiency score greater than 100%. The proposed approach will employ the super-efficiency DEA method to divide the DMUs into two classes—the efficient DMUs (with score equal to or greater than 100%) and the inefficient DMUs (with score less than 100%). To save space, details of the super-efficiency DEA model can be referred to (Adler et al., 2002).
2.2. Bayesian network classifier
The Bayesian network (BN) has been successfully applied in various fields over the past decade. For instance, Lewis (1999) addressed the issues surrounding Bayesian Belief Network software process modeling. Wheeler (2001) presented a Bayesian approach to service level performance monitoring. Zhu et al. (2002) explored a Bayesian framework for constructing combinations of classifier outputs. Kao et al. (2005) performed the supply chain diagnostics with dynamic BNs. Rhodes and Keefe (2007) employed a Bayesian approach to study the social network topology. Chan and McNaught (2008) applied BNs to improve fault diagnosis.
The BN is a graphical representation of probabilistic relationships between multiple attributes/variables (Lewis, 1999; Klopotek, 2002; Kao et al., 2005). It is more robust for inferring structure than other methods because it is better resistant to noise in data (Wang et al., 2004). Moreover, the BN incorporates probabilistic inference engines that support reasoning under uncertainty (Hruschka and Ebecken, 2007). It is an outcome of a machine-learning process that finds a given network’s structure and its associated parameters, and it can provide diagnostic reasoning, predictive reasoning, and inter-causal reasoning (Lauria and Duchessi, 2007). A BN is a directed acyclic graph (DAG) that consists of a set of nodes/vertices linked by arcs, in which the nodes represent the attributes and the arcs stand for relationships among the connected attributes (Hruschka and Ebecken, 2007). In a DAG, the arcs designate the existence of direct causal relations between the linked variables, and the strengths of these relationships are expressed in terms of conditional probabilities.
Inferring Bayesian structure from expression data can be viewed as a search problem in the network space (Wang et al., 2004). Thus, to heuristically search the BN space, it is necessary to employ a variety of search methods, such as simulated annealing algorithm, genetic algorithm, and tree augmented Naïve Bayes (TAN). For structure learning through BNs, the software WEKA offers various algorithms including hill climbing, K2, simulated annealing, genetic, tabu, TAN, and so on. Among these algorithms, the TAN can produce a causal-effect graph (not just a tree-like graph), in which the class attribute treated as the only and greatest parent node of all other nodes is located at the top in the DAG (Friedman et al., 1997). The causal-effect graph of the TAN is formed by calculating the maximum weight spanning tree using (Chow and Liu, 1968).
The TAN is an extension of the Naïve Bayes—it removes the Naïve Bayes assumption that all the attributes are independent. Moreover, the TAN finds correlations among the attributes and connects them in the network structure learning process. According to Friedman et al. (1997), the TAN provides for additional edges between attributes that capture correlations among them, and it approximates the interactions between attributes by using a tree structure imposed on the Naïve Bayes structure. Davis et al. (2004) pointed out that (1) although the Naïve Bayes is more straightforward to understand as well as easy and fast to impart through training, the TAN, on the other hand, allows for more complex network structures than the Naïve Bayes; and (2) the TAN
achieves retention of the basic structure of Naïve Bayes, permitting each attribute to have at most one other parent, and allowing the model to capture dependencies between attributes.
The BN classifiers incorporated in WEKA, such as the BN with the TAN search algorithm, have exhibited excellent performance in data mining (Cerquides and De Mantaras, 2005). In fact, the conditional independence assumption of Naïve Bayes is not real, and the TAN is developed to offset this disadvantage. It does achieve a significant improvement in terms of classification accuracy, efficiency and model simplicity (Jiang et al., 2005). Although the TAN may not always perform the best with regard to classification accuracy, the proposed approach will adopt the TAN because it can create a causal-effect graph in which the class attribute treated as the supreme parent node is located at the top in the DAG. To save space, details of BN classifier with TAN algorithm can be referred to Friedman et al. (1997).
2.3 Partial least squares path modeling
It is well known that linear structural relations (LISREL) and partial least squares (PLS) path modeling are two main SEM approaches to establishing the relationships between latent variables (Tenenhaus et al., 2005; Temme et al., 2006). LISREL focuses on maximizing the explained covariation among the various constructs; it highlights theory confirmation. In contrast, PLS path modeling maximizes the explained variation among the various constructs; it stresses causal explanation (Lauria and Duchessi, 2007). Unlike LISREL, with its assumption of homogeneity in the observed population, PLS path modeling is more suitable for real world applications. It is particularly more advantageous to employ PLS path modeling when models are complex (Fornell and Bookstein, 1982). Moreover, a major merit of using PLS path modeling is that its required minimum sample size is mere 30 (Anderson and Vastag, 2004).
Anderson and Vastag (2004) argued that SEM is likely the preferred method if the objective is only a description of theoretical constructs with no interest in inference to observable variables; however, BN should be used if the objectives include prediction and diagnostics of observed variables. PLS path modeling is more suitable for analyzing exploratory models with no rigorous theory grounding; it requires minimal assumptions about the statistical distributions of data sets; more importantly, it can work with smaller sample sizes (Ranganathan and Sethi, 2004). Therefore, the proposed approach also incorporate with the PLS path modeling. For brevity, details of the PLS path modeling can be referred to Jakobowicz and Derquennea (2007).
2.4 The proposed solution framework
The proposed solution framework mainly contains the following three steps:
Step 1: Cluster all of the DMUs into two classes with the super-efficiency DEA model. The scores of nine pillars are used as the input variables, while the overall score of NRI is used as the output variable.
Step 2: Explore the causal directions amongst the pillars and overall score by the BN classifier with the TAN search algorithm. The resulted causal relationship diagram is then used to develop the hypotheses.
Step 3: Test the hypotheses by the PLS path modeling.
3. Empirical study
To demonstrate the applicability of the proposed approach, an empirical study based on the NRI rankings in the Global Information Technology Report 2009-2010 is conducted. As
mentioned above, a total of 9 pillars/criteria are identified within the NRI; namely, E1 (market environment), E2 (political and regulatory environment), and E3 (infrastructure environment) under the environment subindex; R1 (individual readiness), R2 (business readiness), and R3 (government readiness) under the readiness subindex; U1 (individual usage), U2 (business usage), and U3 (government usage) under the usage subindex. The following will present the detailed results step by step and then discuss the managerial implications accordingly.
3.1 Results
To perform the super-efficiency DEA to divide the DMUs into two classes, it requires identifying the input and output variables. The nine pillars are used as the input variables, while the overall score is treated as the output variable. The data analysis is implemented by the software called EMS (Efficiency Measurement System). The detailed results are presented in Appendix 2, wherein the overall score, rank, and scores of nine pillars are directly extracted from the Global Information Technology Report; whereas the DEA_Score and class are the results from the super-efficiency DEA.
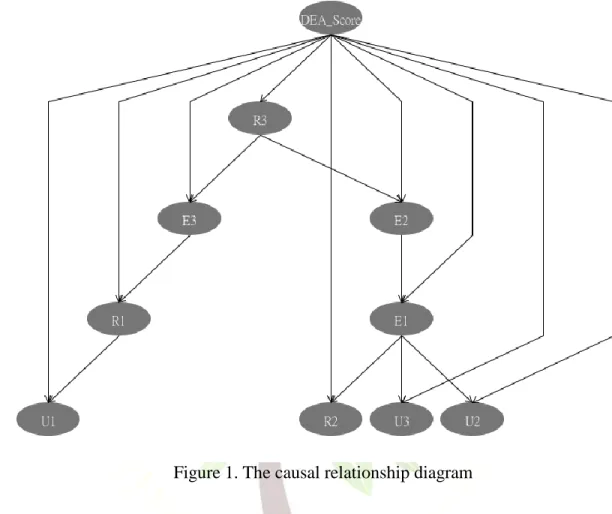
To establish the causal directions, BN classifier with the TAN search algorithm is performed with nine pillars and DEA_Score as the inputs. It is implemented with the software WEKA, using a test mode of 10-fold cross-validation. Figure 1 displays the causal relationship diagram, from which it visibly shows the causal directions between pillars and DEA_Score.
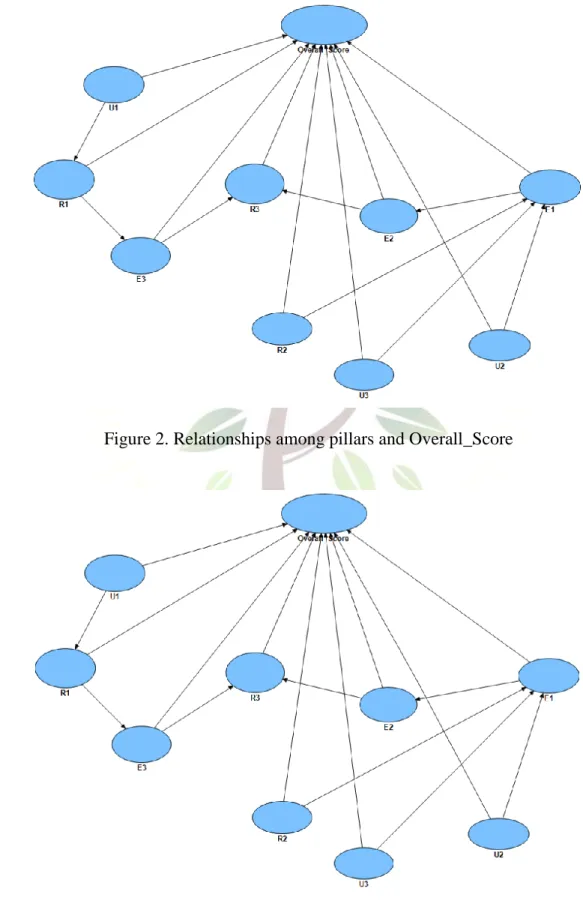
The hypotheses can therefore be developed according to Figure 1. Note that the causal directions acquired by using the BN classifier with the TAN search algorithm is required to make them reverse when using PLS path modeling[12](Wu, 2010). Thus, all the hypotheses can be developed according to Figure 2, which has reverse directions of Figure 1. From Figure 2, a total of 17 hypotheses can be identified. The Overall_Score is directly affected by nine pillars: U1, R1, E3, R3, R2, U3, E2, U2, and E1. However, U1 will affect R1, which in turn affects E3; R3 is affected by both E3 and E2. E1 affects E2 but is affected by R2, U3 and U2.Taking U1 as an example, one hypothesis is that individual usage (U1) will positively affect not only individual readiness (R1) but also Overall_Score. However, U1 is not affected by other pillars; thus, U1 may be a potentially important root cause.
Figure 1. The causal relationship diagram
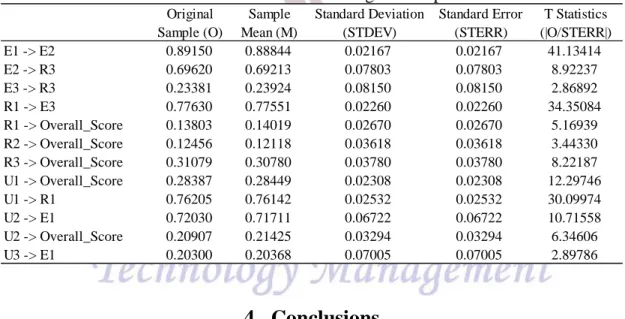
Finally, the aforementioned 17 hypotheses are tested by the PLS path modeling method, which is implemented with the software SmartPLS. Figure 3 displays the significant paths among pillars and Overall_Score, after removing the non-significant ones. Table 1 also presents the detailed information about the significant path coefficients. From Figure 3, it is apparent that (1) the highest path coefficient (0.891) is the E1 (market environment) → E2 (political and regulatory environment); (2) as for the R value, the E1 (market environment) exhibits the best 2
ability to explain this model (81.6%); and (3) the combination of these 9 pillars has predictive ability of 98% for the Overall_Score.
Figure 2. Relationships among pillars and Overall_Score
3.2 Discussions and implications
The results of this empirical study indicate that some hypotheses have been supported by the data analysis. Referring to Figure 3, several interesting patterns from these significant paths can be found. For example, there are five pillars which could positively affect the Overall_Score, including R1 (individual readiness), R2 (business readiness), R3 (government readiness), U1 (individual usage), and U2 (business usage). In contrast, all three environment-related criteria have no significant effects on the Overall_Score. This reveals that readiness-related criteria are the foremost enablers to leverage the overall score of the NRI for a country.
It should be noted that, among those five pillars (R1, R2, R3, U1, and U2), U1 and U2 are the most imperative ones to promote the overall score of the NRI. They have positively affected the Overall_Score as well as other pillars since that U1 is the start of the path “U1→R1→E3→R3 → Overall_Score ” and that U2 is the beginning of the path “ U2 → E1 → E2 → R3 → Overall_Score.” Furthermore, all these two paths have covered R3, suggesting that R3 is greatly affected by several antecedent criteria.
Based on the findings, some managerial implications can be derived. First, the Report emphasized that environment is a crucial enabler of networked readiness and that communication technology readiness facilitates the ICT usage. However, this study had different findings—readiness-related pillars are the foremost enablers and U1 (individual usage) and U2 (business usage) are the two most imperative facilitators. These findings did not mean that environment-related pillars are not important. Perhaps it would be safer to conclude that environment-related factors are indispensable, yet they cannot significantly bring out grand performance for the overall score of the NRI of a country. Second, R3 (government readiness) is the central component of the NRI, based on the findings, yet it is influenced by a series of antecedent criteria. In this regard, one should advance U1 and U2 because they are the root causes. From the causal analysis, it is sensible to focus on three specific pillars (U1, U2, and R2) rather than all 9 criteria.
Table 1. The coefficients of significant paths
Original Sample (O) Sample Mean (M) Standard Deviation (STDEV) Standard Error (STERR) T Statistics (|O/STERR|) E1 -> E2 0.89150 0.88844 0.02167 0.02167 41.13414 E2 -> R3 0.69620 0.69213 0.07803 0.07803 8.92237 E3 -> R3 0.23381 0.23924 0.08150 0.08150 2.86892 R1 -> E3 0.77630 0.77551 0.02260 0.02260 34.35084 R1 -> Overall_Score 0.13803 0.14019 0.02670 0.02670 5.16939 R2 -> Overall_Score 0.12456 0.12118 0.03618 0.03618 3.44330 R3 -> Overall_Score 0.31079 0.30780 0.03780 0.03780 8.22187 U1 -> Overall_Score 0.28387 0.28449 0.02308 0.02308 12.29746 U1 -> R1 0.76205 0.76142 0.02532 0.02532 30.09974 U2 -> E1 0.72030 0.71711 0.06722 0.06722 10.71558 U2 -> Overall_Score 0.20907 0.21425 0.03294 0.03294 6.34606 U3 -> E1 0.20300 0.20368 0.07005 0.07005 2.89786
4. Conclusions
empowered individuals with unprecedented access to information and knowledge, with important consequences in terms of providing education and access to markets, of doing business, and of social interactions, among others. By increasing productivity and therefore economic growth in developing countries, ICT can play a formidable role in reducing poverty and improving living conditions and opportunities for the poor all over the world. The extraordinary capacity of ICT to drive growth and innovation should not be overlooked, since it can play a critical role not only in facilitating countries’ recovery but also in sustaining national competitiveness in the medium to long term.
In order to increase the credibility and utility of the NRI score rankings from the Global Information Technology Report, this paper has proposed a novel approach to properly create the causal relationships among nine pillars and overall score of NRI, to develop and test the hypotheses so that the most critical ones can be scrutinized. The proposed approach employed three techniques in its operational procedure: super-efficiency DEA method, BN classifiers with TAN algorithm, and PLS path modeling. The empirical study has concluded that (1) readiness-related criteria are the foremost enablers; and (2) rather than all 9 pillars, policymakers may spotlight on U1 (individual usage), U2 (business usage), and R2 (business readiness) because they are the root causes to overall NRI score. Though U3 (government usage) has no direct effect on the overall NRI score, the policymakers should never overlook this pillar because it is also a root cause which indirectly and significantly affects the overall NRI score.
The proposed solution framework has successfully established the casual relationships among pillars and NRI score. It can also clearly scrutinize the imperative factors to facilitate the policymakers to arrive at more informed decisions, which is otherwise impossible for only relying on the original NRI scores and rankings from the Report. Consequently, this study contributes to the practical applications of global ICT competitiveness around the world. The proposed approach can help the policymakers focus on the most critical pillars and associated components to effectively advance the ICT competition of a nation.
Several directions for future studies can be identified. First, different clustering techniques may produce different results; thus, it calls for further research by comparing with other clustering techniques so as to reach more robust conclusions. Second, since the ICT industry has been changing drastically, it is important to examine the consistency of the significant pillars affecting the overall NRI scores and rankings over time. Future study can employ the proposed approach to conduct similar analyses based on several annual Reports.
5. References
Adler, N., Friedman, L., Sinuany-Stern, Z. (2002) Review of ranking methods in the data envelopment analysis context. European Journal of Operational Research 140(2), 249-265. Andersen, P., Petersen, N.C. (1993) A procedure for ranking efficient units in data envelopment
analysis. Management Science 39(10), 1261-1264.
Anderson, R.D., Vastag, G. (2004) Causal modeling alternatives in operations research: Overview and application. European Journal of Operational Research 156(1), 92-109.
Banker, R.D., Charnes, A., Cooper, W.W. (1984) Some models for estimating technical and scale inefficiencies in data envelopment analysis. Management Science 30(9), 1078-1092.
Cerquides, J., R.L. De Mantaras. (2005) TAN Classifiers Based on Decomposable Distributions. Machine Learning 59, 323-354.
manufacturing tests of mobile telephone infrastructure. Journal of the Operational Research Society 59(4), 423-430.
Charnes, A., Cooper, W.W., Rhodes, E. (1978) Measuring the efficiency of decision-making units, European Journal of Operational Research 2(6), 429-444.
Cook, W.D., Seiford, L.M. (2009) Data envelopment analysis (DEA)-Thirty years on. European Journal of Operational Research 192(1), 1-17.
Cook, W.D., Seiford, L.M., Zhu, J. (2004) Models for performance benchmarking: measuring the effect of e-business activities on banking performance. Omega 32(4), 313-322.
Davis, J., Costa, V.S., Ong, I.M., Page, D., Dutra, I. (2004) Using Bayesian Classifiers to Combine Rules. In 3rd Workshop on Multi-Relational Data Mining, Seattle, USA.
Dutta, S., Mia, I. (2010) The Global Information Technology Report 2009-2010. World Economic Forum and INSEAD, SRO-Kundig Geneva, Switzerland.
Fornell, C., Bookstein, F. (1982) Two structural equations models: LISREL and PLS applied to consumer exit-voice theory. Journal of Marketing Research 19(4), 440-452.
Friedman, N., Geiger, D., Goldszmidt, M. (1997) Bayesian Network Classifiers. Machine Learning 29(2-3), 131-163.
Golany, B., Roll, Y. (1989) An application procedure for DEA. Omega 17(3), 237-250.
Hruschka, E.R. Ebecken, N.F.F. (2007) Towards efficient variables ordering for Bayesian networks classifier. Data & Knowledge Engineering 63(2), 258-269.
Hulland, J. (1999) Use of partial least squares (PLS) in strategic management research: A review of four recent studies. Strategic Management Journal 20(2), 195-204.
Jakobowicz, E., Derquennea, C. (2007). A modified PLS path modeling algorithm handling reflective categorical variables and a new model building strategy. Computational Statistics & Data Analysis 51(8), 3666-3678.
Jiang, L., Zhang, H., Cai, Z., Su, J. (2005) Learning Tree Augmented Naive Bayes for Ranking, DASFFA 2005: database systems for advanced applications, Lecture Notes in Computer Science 3453, 688-698, Springer Berlin,.
Kao, H.Y., Huang, C.H., Li, H.L. (2005) Supply chain diagnostics with dynamic Bayesian networks. Computers & Industrial Engineering 49(2), 339-347.
Klopotek, M.A. (2002) A new Bayesian tree learning method with reduced time and space complexity. Fundamenta Informaticae 49(4), 349-367.
Lauria, E.J.M., Duchessi, P.J. (2007) A methodology for developing Bayesian networks: An application to information technology (IT) implementation. European Journal of Operational Research 179(1), 234-252.
Lewis, N.D.C. (1999) Continuous process improvement using Bayesian belief networks. Computers & Industrial Engineering 37(1-2), 449-452.
Ranganathan, C., Sethi, V. (2002) Rationality in Strategic Information Technology Decisions: The Impact of Shared Domain Knowledge and IT Unit Structure. Decision Sciences 33(1), 59-86.
Rhodes, C.J., Keefe, E.M.J. (2007) Social network topology: a Bayesian approach. Journal of the Operational Research Society 58(12), 1605-1611.
Temme, D., Kreis, H., Hildebrandt, L. (2006) PLS path modeling: A software review. SFB 649 Discussion Papers SFB649DP2006-084, Humboldt University, Berlin, Germany.
Tenenhaus, M., Vinzi, V.E., Chatelin, Y.M., Lauro, C. (2005) PLS path modeling. Computational Statistics and Data Analysis 48(1), 159-205.
Wang, T., Touchman, J.W., Xue, G. (2004) Applying two-level simulated annealing on Bayesian structure learning to infer genetic networks. Computational Systems Bioinformatics
Conference, 2004. CSB 2004. Proceedings. 2004 IEEE, Publication Date: 16-19, p.647- 648.
Wheeler, F.P. (2001) A Bayesian approach to service level performance monitoring in supplier, provider relationships. The Journal of the Operational Research Society 52(4), 383-390. Wixom, B.H., Watson, H.J. (2001) An empirical investigation of the factors affecting data
warehousing success. MIS Quarterly 25(1), 17-41.
Wu, W.W. (2010) Linking Bayesian networks and PLS path modeling for causal analysis. Expert Systems with Applications 37(1), 134-139.
Zhu, H., Beling, P.A., Overstreet, G.A. (2002) A Bayesian framework for the combination of classifier outputs. Journal of the Operational Research Society 53(77), 719-727.