632 JOURNAL OF FOOD SCIENCE—Vol. 68, Nr. 2, 2003 © 2003 Institute of Food Technologists
Food Microbiology and Safety
Optimization of the Viability of Probiotics in
a New Fermented Milk Drink by the Genetic
Algorithms for Response Surface Modeling
M.-J. CHEN, K.-N. CHEN, AND C.-W. LIN
ABSTRACT: Calcium gluconate (0.0 to 0.5%), sodium gluconate (0.0 to 1.0%), and N-acetylglucosamine (0.0 to 1.0%) were added to skim milk to retain the viability of Lactobacillus acidophilus and Bifidobacterium longum. To carry out response surface modeling, the regression method was performed on experimental results to build mathematical models. The models were then formulated as an objective function in an optimization problem that was consequently optimized using a genetic algorithm approach to obtain the maximum viability of the probiotics. The genetic algorithms (GAs) were examined to search for the optimal value. The results indicated that GAs were very effective for optimizing the activity of probiotic cultures.
Keywords: probiotics, optimization, genetic algorithms, response surface modeling
Introduction
L
ACTOBACILLUSACIDOPHILUSANDBIFIDOBACTERIAMUSTRETAINviability and activity in food carriers to meet the suggested “therapeutic minimum” at the time of consumption (Playne 1994). Several factors have been claimed to affect the viability of probiotic cultures in fermented milk products. The culture conditions, chem-ical composition of the fermentation medium (for example, carbo-hydrate source), final acidity, growth promoters and inhibitors, in-cubation temperature, and fermentation time and storage temperature have all been identified as having effects on the man-ufacturing and storage of yogurt (Young and Nelson 1978; Hamman and Marth 1983; Kneifel and others 1993; Lankaputhra and Shah 1995).
In food microbiology, during the past few years, much effort has been directed to developing models describing the combined ef-fects of the factors for microbe growth. Response surface method-ology (RSM) is a collection of statistical and mathematical tech-niques useful for developing, improving, and optimizing processes. The main advantage of RSM is the reduced number of experimental trials needed to evaluate multiple parameters and their interactions (Porretta and others 1995; Lee and others 2000). It was successfully used for application in finding the optimum producing conditions of the dairy product Kou Woan Lao (Weng and others 2001). The ex-perimental data were used to build mathematical models using the regression method. Once an appropriate approximating model is obtained, this model may be analyzed to determine the optimum conditions for the process.
Genetic algorithms (GAs) are search procedures that imitate the natural evolution process and can be used for the computation of the global maximum or minimum of a function (Mitchell 1996). Genetic algorithms differ from other search techniques in that they search among a population of points and use probabilistic rather than deterministic transition rules. As a result, genetic algorithms search more globally (Wang 1997). More details regarding GAs will be included in the next section.
The purpose of this research was to study the addition of calci-um gluconate (0.0 to 0.5%), sodicalci-um gluconate (0.0 to 1.0%) and
N-acetylglucosamine (0.0 to 1.0%) in milk to optimize the viability of the probiotics by RSM and genetic algorithms. The experimental data were used to build mathematical models using the regression method. The mathematical models were formulated as an objective function (as in an optimization problem) and were optimized us-ing the genetic algorithm approach to obtain the maximum viability for the probiotics. The endpoint was to provide a new optimization method to improve the growth of probiotics in dairy products.
Materials and Methods
Preparation of fermented milk drink
The milk used in the experiments was reconstituted milk (12% total solids, Anchor, New Zealand), heat treated at 85 °C for 30 min. Samples were prepared using 100 mL of skim milk, mixed with 4% of isomaltooligosaccharides and the growth promoters (calcium gluconate, Cheng-Fung Co., Taiwan; sodium gluconate, Nacalai Tesque, Japan; and N-acetylglucosamine, Sigma, Germany), which was inoculated with 1% L. acidophilus and 2% B. longum suspen-sions and fermented for 10 h at 37 °C.
Cultures and medium performance
Pure lyophilized cultures of B. longum (CCRC 14605) and L. ac-idophilus (CCRC 14079) were purchased from the Culture Collec-tion and Research Center, Hsin-Chu, Taiwan, R.O.C. Lactobacilli MRS (deMan, Rogosa, and Sharp, Merck, (Darmstadt, Germany) and Lithium propionate MRS agar (LP-MRS, Merck) were used as the selective media (Lapierre and others 1992).
Activity determination
For determination of the viabilities of the probiotics, the popu-lations of B. longum and L. acidophilus were measured as colony-forming units (CFU) and by the amount of -galatosidase produced by them.
The suitability of the media was tested by plating decimal dilu-tions of the probiotic cultures. Thus, a 1-g sample of each pure lyo-philized culture was decimally diluted into sterile peptone water
Food Microbiology and Safety
(0.1%) and then 0.1-mL aliquot dilutions were plated onto thedif-ferent media, in triplicate. Plates of MRS agar were incubated aer-obically for 72 h at 37 °C to inhibit bifidobacteria. Plates of LP-MRS agar were incubated anaerobically (72 h at 37 °C, GasPak System-Oxoid, Basingstoke, Hampshire, England). The population in col-ony-forming units (CFU) and the characteristics of the colonies were recorded for each medium.
-galatosidase activity was measured by determining the rate of hydrolysis of o-nitrophenol--galatopyranoside as described by Yu and others (1987). Hydrolysis of this substrate results in the release of o-nitrophenol, a highly chromogenic compound that can be de-tected spectrophotometrically. One unit of enzyme activity released 1 µmol/L of o-nitrophenol/mL.
Experiment design
To carry out response surface modeling, the regression method was performed on experimental results to build mathematical models. The models were then formulated as an objective function in an optimization problem that was consequently optimized us-ing a genetic algorithm approach to obtain the maximum viabili-ty of the probiotics.
According to Mitsuoka and others (1987) and our screening test, the viabilities of L. acidophilus and B. longum were affected by 3 independent variables: calcium gluconate (0.0 to 0.5%), sodium gluconate (0.0 to 1.0%), and N-acetylglucosamine (0.0 to 1.0%). Among the 3 growth promoters, calcium gluconate is now a very popular ingredient in Taiwan because it promotes bifidobacteria and fortifies calcium. However, according to our pretest, milk started to coagulate and produced a bitter taste when the concentration of added calcium gluconate was higher than 0.5%. Therefore, the upper limit for calcium gluconate was set to 0.5% in this study.
Response surface modeling. A 3-variable and 3-level design method with 6 replicates at the center point was selected to build response surface models (Box and Behnken 1960). The coded and uncoded variables and their respective level are shown in Table 1. The RSM procedure of the Design-Expert® software package (Stat-Ease, Inc., Minneapolis, Minn., U.S.A., 2000) was used to fit the ex-perimental data to polynomial equations of order 1 through 3 to obtain coefficients. The following linear relationship achieved this.
Yi = ƒi(X1, X2, X3) + ⑀i i = 1,2,3 (1)
where Y1, Y2, Y3 were the observed numbers of L. acidophilus, B. longum and -galactosidase activity, respectively. ƒ1, ƒ2,ƒ3 repre-sented the modeled response surfaces. X1, X2, X3,defined as natural variables, were the concentrations of N-acetylglucosamine, Ca-gluconate, and Na-Ca-gluconate, respectively. ⑀1, ⑀2, ⑀3 were the errors
in each model. With RSM, it is convenient to transform the natural variables to coded variables 1, 2, 3, where the coded variables are defined as dimensionless, with mean zero and the same spread or standard deviation:
Yi = ƒi (1, 2, 3) +⑀i i = 1,2,3 (2) Genetic algorithms (GAs). The GAs provide a very flexible frame-work and recently have been regarded as not only a global optimi-zation method but also a multi-objective optimioptimi-zation method in various areas. Generally, the algorithmis can be described as follows (Goldberg 1989; Mitchell 1996):
I. Encoding: GA works with the coding of the parameters. The methods of parameter coding that have often been used are binary encodings and real-valued encodings. Binary encodings are most
commonly used. A l-bit binary variable is used to represent 1 pa-rameter Xi, i = 1,…,q, where q is the number of parameters.
II. Initial population: The population consists of N chromo-somes, that is, arrays of q × l binary bits (binary encoding GAs). The initial population of chromosomes is randomly generated. A chro-mosome represents a set of experimental variables (growth promot-ers) in our study.
III. Selection for reproduction: Selection for reproduction is the operation that couples of chromosomes are selected from the cur-rent population. The chromosomes with higher fitness values are more likely to be selected to reproduce. In this research, the fitness of a chromosome is pertinent to the activities of probiotics, the high-er the activities the highhigh-er the fitness.
IV. Crossover: Crossover allows us to generate new chromo-somes starting from existing ones. This operator randomly choos-es a locus and exchangchoos-es the subsequencchoos-es after that locus be-tween 2 chromosomes to create 2 offsprings. The percentage of the population chromosomes that mates is called crossover probabil-ity.
V. Mutation: Mutation operator alters some of the bits of ran-domly selected chromosomes with a probability equal to the mu-tation rate, which is usually very small.
VI. New generation: After the mutations take place, a new gen-eration of population has formed. The fitness value associated with each chromosome in this generation is calculated.
VII. Termination criteria: The stopping criteria often used are the maximum number of generations, set at the beginning of the optimization process, and that there is no appreciable improve-ment in the highest fitness for a number of generations.
Steps III through VI are repeated until one of the termination criteria is satisfied. With each generation, the population gets closer to an optimal solution, which is an optimal set of percentages of added growth promoters to produce the highest activities in pro-biotics in our research. A flow chart of genetic algorithms described above can be seen in Figure 1.
In the present article, the simple genetic algorithm and the micro genetic algorithm were evaluated to determine which one was more effective. Both GAs were programmed in Matlab codes (Math Works 2000). The numbers of bits in the binary strings, population size, crossover rate, mutation rate, and maximum number of generations in GAs were all obtained by fine tuning the algorithms through multiple trial runs, which is a common practice for using GAs to solve an optimization problem, such as Vallapuzha and others (2002).
Although recently there have been researchers who proclaimed the advantages of real-value encodings of GAs (Barrios and others 2000; Bessaou and Siarry 2001), binary encodings are still more pop-ular for several reasons, one of which is that much of the existing GA theory is based on the assumption of fixed-length binary encodings, including the so-called fundamental theorem of genetic algorithms or the Schema theorem (Holland 1975; Goldberg 1989). In this study, the binary encoding GAs were adopted.
To search a solution that maximized multiple responses using GAs, a composite function fitness was defined as the following:
Composite Function Fitness (CFF) = (3)
The CFF combines 3 responses into 1 single function whose maximum can be sought by GAs. Each response contributes equally to the CFF.
Simple Genetic Algorithm. The simple genetic algorithm (SGA) searches for an optimal value by simulating the biological
evolu-Food Microbiology and Safety
tionary process, based on crossover and mutational genetics (Niki-tas and others 2001). To use the GAs, a chromosome was formed by 3 different growth promoters: calcium gluconate, sodium gluconate, and N-acetylglucosamine, which were all coded as 20-bit binary strings. Table 2 shows the parameters of the SGA. The initial popu-lation, consisting of 50 chromosomes (population size), was gener-ated at random. The crossover and mutation operators were applied to those chromosomes. The crossover rate and mutation rate were 0.5 and 0.02 individually. The selection technique was based on the roulette wheel selection and the elitist strategy (Mitchell 1996). The roulette wheel technique is the most simple selection method while the elitist strategy makes sure the 1 chromosome with the highest composite function fitness survives to the next generation. The maximum number of generations was set to 100 for SGA.
This iterative process continues until a prespecified maximum number (100) of generations is reached, or until there is no appre-ciable improvement in the CFF. With each new generation, the population gets closer to an optimal value. Once the search is com-plete, the best value from the final generation is taken as the optimal solution.
Micro Genetic Algorithm. The essence of the micro genetic al-gorithm (MGA) is the lack of mutations and presence of restarts. Due to this feature, the algorithm converges rapidly to a local or glo-bal maximum (Nikitas and others 2001). The lack of mutations also results rapidly in a decrease of the variance of the cost values of the population. When the variance value falls below a certain limit, a restarting process begins, in which the chromosome with the
high-Table 1—Nature and coded variables, levels, and experimental data of fermented milk drinks
Variables Responses
Calcium Sodium N-acetyl- b-galactosidase
Treatment gluconate gluconate glucosamine L. acidophilus B. longum activity
nr* (%) (%) (%) (log CFU/ml) (log CFU/ml) (units/ml)
1 0.00 (–1) 0.00 (–1) 0.50 ( 0 )** 7.47 7.44 257.5 2 0.50 (+1) 0.00 (–1) 0.50 ( 0 ) 7.56 7.79 282.5 3 0.00 (–1) 1.00 (+1) 0.50 ( 0 ) 7.34 7.56 252.5 4 0.50 (+1) 1.00 (+1) 0.50 ( 0 ) 7.35 7.56 250.0 5 0.00 (–1) 0.50 ( 0 ) 0.00 (–1) 7.56 7.83 270.0 6 0.50 (+1) 0.50 ( 0 ) 0.00 (–1) 7.55 7.80 280.0 7 0.00 (–1) 0.50 ( 0 ) 1.00 (+1) 7.34 7.71 246.7 8 0.50 (+1) 0.50 ( 0 ) 1.00 (+1) 7.45 7.76 251.7 9 0.25 ( 0 ) 0.00 (–1) 0.00 (–1) 7.48 7.91 285.0 10 0.25 ( 0 ) 1.00 (+1) 0.00 (–1) 7.35 7.81 236.7 11 0.25 ( 0 ) 0.00 (–1) 1.00 (+1) 7.41 7.77 241.7 12 0.25 ( 0 ) 1.00 (+1) 1.00 (+1) 7.32 7.70 232.5 13 0.25 ( 0 ) 0.50 ( 0 ) 0.50 ( 0 ) 7.38 7.71 275.0 14 0.25 ( 0 ) 0.50 ( 0 ) 0.50 ( 0 ) 7.41 7.77 275.0 15 0.25 ( 0 ) 0.50 ( 0 ) 0.50 ( 0 ) 7.40 7.73 275.0 16 0.25 ( 0 ) 0.50 ( 0 ) 0.50 ( 0 ) 7.42 7.79 277.5 17 0.25 ( 0 ) 0.50 ( 0 ) 0.50 ( 0 ) 7.42 7.80 275.0
*Treatments were run in a random order. **(–1), (0), and (1) are coded levels.
Table 2—Parameters of the simple genetic algorithm (SGA) and micro genetic algorithm (MGA)
Parameter SGA MGA
Population size 50 10
Nr of bits 20 20
Mutation rate 0.02 0
Crossover rate 0.5 0.5
Maximum generation 100 500
Food Microbiology and Safety
est composite function fitness is retained and the rest of the N-1chromosomes (N is the total number of chromosomes in 1 genera-tion) are replaced by the same number of randomly generated new ones.
Table 2 shows the parameters of the MGA. The initial population consisting of 10 chromosomes (population size) was generated at random. The crossover rate was 0.5. The chromosomes with higher CFF were selected and retained for the next generation. The max-imum number of generations was set to 500 for the MGA.
Statistical analysis
Model verification experiments were repeated 3 times and the results were analyzed using ANOVA from the SAS software package (SAS Inst. 1990), with Duncan’s multiple range test for significance used to detect differences between predicted values and observed values.
Results and Discussion
Response surface modeling
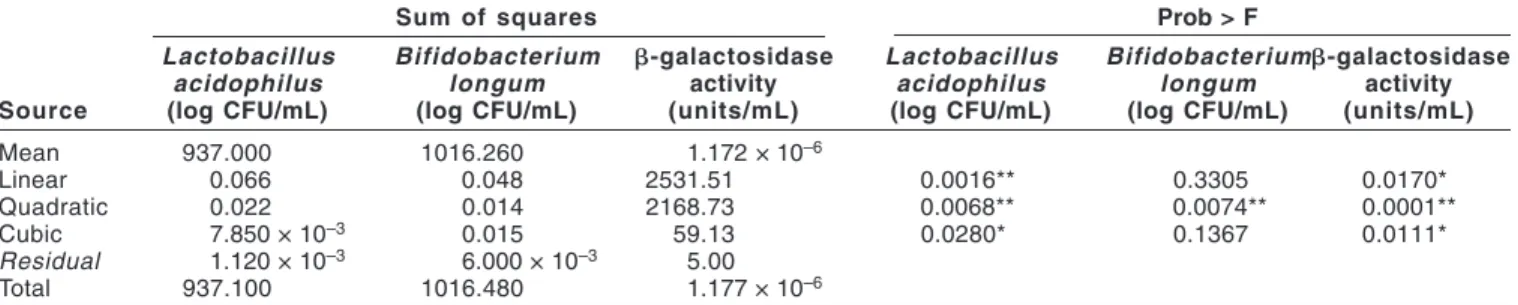
Fitting the models. Three growth promoters (calcium gluconate, sodium gluconate, and N-acetylglucosamine) were mixed with milk to improve the activities of L. acidophilus, B. longum, and -galac-tosidase. The nature and coded variables levels and experimental data of fermented milk drinks are shown in Table 1. The responses, as linear, quadratic and cubic functions of the factors, were tested for adequacy and fitness using analysis of variance (ANOVA). Table 3a examines the probability (Prob > F) to see if it falls below 0.05. The highest order polynomial that is significant is selected. The “lack of fit tests” (Table 3b) compares the residual error with the pure error from replicated design points. If there is a significant lack of fit, as indicated by a low probability value (Prob > F), the response predictor should be discarded. The model with insignificant lack-of-fit is selected. ANOVA showed that the quadratic models ap-peared to be the most accurate for all 3 responses, with no
signifi-cant lack of fit (Table 3). Second-order polynomial Eq. 4 was fitted to the experimental data using the Design Expert procedure:
k = 1, 2, 3 (4)
where fk were the 3 responses and 0,  i,  ii, and ij were constant coefficients and Xi were the uncoded independent variables. The regression coefficients for the statistically significant models are given in Table 4.
Factors affecting viability of L. acidophilus and B. longum. Estimation of the overall effects of the 3 factors affecting viability of L. acidophilus and B. longum using ANOVA indicated that all factors were significant (P < 0.05). The relationships between the factors and the responses were also investigated by examining a series of 3-D plots generated by holding constant one of the variables of the Table 3—Analysis of variance for the variables as linear, quadratic and cubic terms and their interactions in a response-variable model
(a) Model
Sum of squares Prob > F
Lactobacillus Bifidobacterium b-galactosidase Lactobacillus Bifidobacteriumb-galactosidase
acidophilus longum activity acidophilus longum activity
Source (log CFU/mL) (log CFU/mL) (units/mL) (log CFU/mL) (log CFU/mL) (units/mL)
Mean 937.000 1016.260 1.172 × 10⁻⁶ Linear 0.066 0.048 2531.51 0.0016** 0.3305 0.0170* Quadratic 0.022 0.014 2168.73 0.0068** 0.0074** 0.0001** Cubic 7.850 × 10⁻³ 0.015 59.13 0.0280* 0.1367 0.0111* Residual 1.120 × 10⁻³ 6.000 × 10⁻³ 5.00 Total 937.100 1016.480 1.177 × 10⁻⁶
*Significant at 5% level ; **significant at 1% level
(b) Lack of fit
Sum of squares Prob > F
Lactobacillus Bifidobacterium b-galactosidase Lactobacillus Bifidobacterium b-galactosidase
acidophilus longum activity acidophilus longum activity
Source (log CFU/mL) (log CFU/mL) (units/mL) (log CFU/mL) (log CFU/mL) (units/mL)
Linear 0.030 0.160 2227.86 0.0145* 0.0149* 0.0001
Quadratic 7.850 × 10⁻³ 0.015 59.13 0.0280* 0.1367** 0.0111*
Cubic 0.000 0.000 0.00
Pure Error 1.120 × 10⁻³ 6.000 × 10⁻³ 5.00
*Insignificant at 5% level; **insignificant at 1% level
Table 4—Regression coefficients of the second-order poly-nomials
Regression Lactobacillus Bifidobacterium
coefficient1 acidophilus longum b-galatosidase
0 7.56 7.68 269.32 1 –0.38 1.24 58.25 2 0.01 0.39 26.45 3 –0.24 –0.61 8.28 11 0.87 –0.56 –14.00 22 0.12 –0.30 –5.60 33 0.06 0.45 –50.10 12 –0.16 –0.70 –55.00 13 0.24 0.16 –10.00 23 0.04 0.03 39.10 1
0 represents intercept and 1, 2 and 3 represent the 3 factors of calcium
gluconate, sodium gluconate, and N-acetylglucosamine, respectively. 11,
22, and 33 represent the respective square terms. 12, 23, and 13 are the
Food Microbiology and Safety
CFF, which was composed of 3 second-order polynomial equations (Eq. 4).
As Figure 2 shows, the composite function fitness increased with increasing calcium gluconate. Addition of sodium gluconate im-proved the activity of probiotics only at a level lower than 0.4%. The
optimal values in the plots changed negatively with N-acetylglu-cosamine. According to the contour plots, most of the diagrams in-dicated that maximum activity of L. acidophilus and B. longum (AB culture) could be obtained with maximum calcium gluconate and minimum N-acetylglucosamine. Growth promoters are sub-stances known to improve the growth of probiotic bacteria. Mitsuo-ka and others (1987) suggested the function of gluconic acid and its salts (gluconic acid, glucono-delta-lactone, and calcium gluconate) as a bifidobacteria growth promoter, and this was confirmed by an in vitro test. The current study gave similar results. Lourens-Hat-tingh and Viljoen (2001) indicated the N-acetylglucosamine could be the nitrogen source of bifidobacteria and probably improved viability of bifidobacteria. However, this study did not support that statement.
Search of an optimal value using genetic algorisms
The CFF was optimized using the GAs. Figure 3 shows the evolu-tion curves in searching for an optimal value. The CFF increased in accordance to the number of function evaluations and reached the maximum value in the curves of the MGA and SGA. The searching procedure was stopped when the CFF continued to keep the same maximum value with increasing numbers of function evaluations. The chromosomes having the maximum CFF provided the optimal ratios of concentrations of the growth promoters. The number of function evaluations in Eq. 5 represents the efficiency of the algo-rithms. A smaller number indicates a higher efficiency.nr of function evaluations = nr of generations × Population size (5) In Figure 3, both methods produced fast increasing CFF during the early stage of optimization process, which is typical for GAs. For 350 function evaluations, the CFF by SGA has been increased from 25.870 to 26.301, compared to 25.870 to 26.324 for MGA. At around 800 function evaluations, both SGA and MGA experienced an in-crease in the CFF. For SGA, the CFF was raised from 26.327 to 26.331 for 800 to 850 function evaluations. For MGA, the CFF was lifted from 26.328 to 26.333 for 810 to 820 evaluations. Finally, the same optimal value (CFF = 26.334) was obtained in 1900 and 1490 func-tion evaluafunc-tions for SGA and MGA, respectively. The MGA con-verged more rapidly to the optimal value than did the SGA. The
Figure 2—Response surface plots of composite function fit-ness showing effects of calcium gluconate and sodium glu-conate under the conditions of constant cosamine: (a) N-acetylglucosamine = 0.0%, (b) N-acetylglu-cosamine = 0.5%, (c) N-acetylgluN-acetylglu-cosamine = 1.0%.
Figure 3—Evolution curves in searching for an optimal value under the different search procedures of the genetic algo-rithm
Food Microbiology and Safety
essences of MGA are the lack of mutations and the mechanism ofrestarts. Due to these features, the algorithm converges rapidly to maximum (Nikitas and others 2001) and still maintains the ability to reach the global optimum.
Population size also affected the results (Figure 3). An optimal value was obtained at the 38th generation, that is, 1900/50 = 38 from Eq. 5, for the SGA curve. For the MGA curve, comparing to SGA curve, an optimal value was obtained at the 149th generation, that is, 1490/10 = 149. This means the highest fitness value could be obtained at earlier generations for increasing population size be-cause of the variety of chromosomes. Moriyama and Shimizu (1996) also drew a similar conclusion and indicated that large population size could decrease the generation to reach the highest fitness value, but the computational burden could be a big problem.
The elitist strategy used in this study is known as an effective way for improving the fitness of chromosomes because a chromosome with maximum fitness is compulsorily remained for next genera-tion. However, its searching performance can easily fall into a local optimum because only the superior individuals with higher fitness are picked in each generation (Morimoto and others 1997). In this article, the confirmation was carried out by using a round-robin algorithm that examines all possible solutions around the near optimal solution and by examining the response surface plots.
Model verification
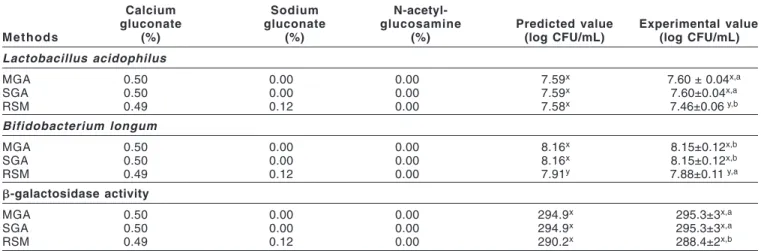
The optimal producing conditions were suggested by the MGA, SGA, and RSM and were verified by additional independent exper-iments (Table 5). The optimal conditions were realized by using 100 mL of skim milk, mixed with 4% of isomaltooligosaccharides and the prescribed growth promoters, which was inoculated and fer-mented for 10 h at 37 °C.
Table 5 shows that the optimal ratio of growth promoters, sug-gested by the MGA and SGA, were the same. The final responses were very close to the calculated values with no significant differ-ence (P > 0.05). Although, the optimal producing conditions, sug-gested by the GAs, were not significantly different in increasing L. acidophilus counts and in improving -galactosidase activities than with the RSM, the conditions did significantly raise the B. longum counts (P < 0.05). The optimization technique used in the RSM was the steepest ascent method. The coordinates along the path of steepest ascent depended on the nature of the regression
coeffi-cients in the fitted model (Myers and Montgomery 1995). The search might be stuck in a local maximum other than the global one because of high dimensionality and irregularities contained in the objective function response (Wang 1997).
Conclusions
T
HE 2-STAGEEFFORT, OBTAININGASURFACEMODELUSINGTHE RSM and optimizing this model using the GAs, resulted in a useful method of finding an optimal set of process parameters. In the current study, the RSM and GAs proved effective for optimization of the activity of AB cultures when developing a new fermented milk drink.References
Barrios D, Manrique K, Porras J, Rios J. 2000. Real-coded genetic algorithms based on mathematical morphology. LNCS 1876:706-15.
Bessaou M, Siarry P. 2001. A genetic algorithm with real-value coding to opti-mize multimodel continuous functions. Struct Multidisc Optim 23:63-74. Box GEP, Behnkin EW. 1960. Some new 3 level designs for the study of quantitative
variables. Technolnetrics 2:455-75.
Goldberg DE. 1989. Genetic algorithms in search, optimization, and machine learning. Reading, Mass.: Addison-Wesley Publishing Company. p 59-84. Hamann ET, Marth EH. 1983. Survival of Streptococcus thermophilus and
Lacto-bacillus bulgaricus in commercial and experimental yogurts. J Food Prot
47:781-6.
Holland JH. 1975. Adaptation in natural and artificial systems. Ann Arbor, Mich.:The Univ. of Michigan Press. p 66-74.
Kneifel E, Jaros D, Erhard F. 1993. Microflora and acidification properties of yo-gurt and yoyo-gurt-related products fermented with commercially available starter cultures. Int J Food Microbiol 18:179-89.
Lankaputhra WEV, Shah NP. 1995. Survival of Lactobacillus acidophilus and bi-fidobacterium spp. in the presence of acid and bile salts. Cult Dairy Prod J 30:2-7.
Lapierre L, Undeland P, Cox LJ. 1992. Lithium chloride-sodium propionate agar for the enumeration of bifidobacteria in fermented dairy products. J Dairy Sci 75:1192-6.
Lee J, Ye L, Landen WO, Eitenmiller RR. 2000. Optimization of an extraction pro-cedure for the quantification of vitamin E in tomato and broccoli using re-sponse surface methodology. J Food Comp Anal 13:45-57.
Lourens-Hattingh A, Viljoen BC. 2001. Yogurt as probiotic carrier food. Intl Dairy J 11:1-17.
Math Works 2000. Using Matlab. Natick, Mass.: The Math Works Inc.
Mitchell M. 1996. An introduction to genetic algorithms. London, England: The MIT Press. p 1-18.
Mitsuoka T, Hidaka H, Eida T. 1987. Effect of oligosaccharides on intestinal mi-croflora. Die Nahrung 31:427-36.
Morimoto T, Purwanto W, Suzuki J, Hashimoto Y. 1997. Optimization of heat treat-ment for fruit during storage using neural networks and genetic algorithms. Comp Elec Agric 19:89-101.
Moriyama J, Shimizu K. 1996. Online optimization of culture temperature for ethanol fermentation using a genetic algorithm. J Chem Tech Biotechnol 66:217-22.
Myers RH, Montgomery DC. 1995. Response surface methodology: process and Table 5—Validation of the optimum producing models for a fermented milk drink.
Calcium Sodium
N-acetyl-gluconate gluconate glucosamine Predicted value Experimental value
Methods (%) (%) (%) (log CFU/mL) (log CFU/mL)
Lactobacillus acidophilus MGA 0.50 0.00 0.00 7.59x 7.60 ± 0.04x,a SGA 0.50 0.00 0.00 7.59x 7.60±0.04x,a RSM 0.49 0.12 0.00 7.58x 7.46±0.06 y,b Bifidobacterium longum MGA 0.50 0.00 0.00 8.16x 8.15±0.12x,b SGA 0.50 0.00 0.00 8.16x 8.15±0.12x,b RSM 0.49 0.12 0.00 7.91y 7.88±0.11 y,a b-galactosidase activity MGA 0.50 0.00 0.00 294.9x 295.3±3x,a SGA 0.50 0.00 0.00 294.9x 295.3±3x,a RSM 0.49 0.12 0.00 290.2x 288.4±2x,b
CFU = colony forming unit; MGA = Micro Genetic Algorithm; RSM = Response Surface Method; SGA = Simple Genetic Algorithm.
x,yValues in the same row without a common superscript are significantly different (P < 0.05).
Food Microbiology and Safety
product optimization using designed experiments. 1st ed. New York, N.Y.: John Wiley & Sons, Inc. p 183-207.
Nikitas P, Pappa-Louisi A, Papageorgiou A, Zitrou A. 2001. On the use of genetic algorithms for response surface modeling in high-performance liquid chro-matography and their combination with the Microsoft Solver. J Chromat A 942:93-105.
Playne M. 1994. Probiotic foods. Food Aust 46:362.
SAS Inst. 1990. SAS/STAT User’s Guide. Cary, N.C.: SAS Inst. Inc.
Porretta A, Birzi A, Ghizzoni C, Vicini E. 1995. Effects of ultra-high hydrostatic pressure treatments on the quality of tomato juice. Food Chem 52:35-41. Vallapuzha S, Meter ECD, Choudhuri S, Khetan RP. 2002. An investigation into
the use of spatial coordinates for the genetic algorithm based solution of the fixture layout optimization problem. Intl J Mach Tools Manuf 42:265-75. Wang QJ. 1997. Using genetic algorithms to optimize model parameters. Environ
Model Software 12:27-34.
Weng WL, Liu YC, Lin CW. 2001. Studies on the optimum models of the dairy prod-uct Kou Woan Lao using response surface methodology. Asian-Aust J Anim Sci 14:1470-6.
Young CK, Nelson FE. 1978. Survival of Lactobacillus acidophilus in “Sweet Ac-idophilus Milk” during refrigerated storage. J Food Prot 41:248-50. Yu P-L, Smart JB, Ennis BM. 1987. Differential induction of -galatosidase and
phospho--galatosidase activity in the fermentation of whey permeate by
Clostridium acetobutylicum. Appl Microbiol Biotechnol. 26:254-7.
MS 20020335 Submitted 6/4/02, Accepted 9/23/02, Received 10/3/02 The authors are greatly indebted to the Council of Agriculture, R.O.C., for the support of the research through contract nr 89-Technology-1.3-Animal-64-9.
Author M.-J. Chen is with the Dept. of Food Science and Technology, Deh-Yu Inst. of Technology, Keelung, Taiwan, R.O.C. Author K.-N. Chen is with the Dept. of Mechanical Engineering, Tung-Nan Inst. of Technology, Taipei, Taiwan, R.O.C. Author Lin is with the Dept. of Animal Science, National Taiwan Univ., Taiwan, R.O.C. Direct inquiries to author M.-J. Chen (E-mail: [email protected]).