Mortality trends of elderly people in Taiwan from 1974 to 1994
6
0
0
全文
(2) K.-K. Leung et al. physicians must report each death to the national death certification system immediately after the event. Causes of death were classified with the International Classification of Diseases (ICD) 8th edition (ICD-8) from 1974 to 1980, and with the ICD-9 from 1981 to 1994. Data for the calculation of decrement life table were obtained from the Taiwan–Fukien Demographic Fact Book and the Abridged Life Tables of Taiwan Area, The Republic of China, published by the Ministry of Interior from 1974 to 1994. Life expectancies at birth, at age 65 and at age 85 from 1974 to 1994 were compared separately for men and women. This explains whether a prolonged life expectancy was achieved by a reduction in premature deaths or from a decline of mortality in old age. Changes of cause mortality rates for cancer (ICD codes 149–208), stroke (430–8), ischaemic heart disease (IHD; 410–14), hypertensive disease (401–5), diabetes mellitus (250), chronic pulmonary diseases (490–93), accidents (E800–949), pneumonia (480–6) and tuberculosis (010–8) from 1974 to 1994 were analysed. Manton used pneumonia, septicaemia and hip fracture deaths to represent causes of death prevalent in debilitated elderly persons [5]. In our study, falls were used instead of hip fracture because the number of deaths attributed to hip fracture was too small. There is evidence which relates fall injuries to frailty in advanced age: this justifies the use of fall deaths as an indicator of frailty in our study [6, 7]. The probability of death (lxA/lx) due to a given condition was calculated from the multiple decrement life table method [8]. The proportion of expected deaths for cause A after age x is lxA ¼. ∞ X. will eventually die of cause A (∞qtA= lxA/lx). The lxA/lx for a person at birth, surviving to age 65 and 85 for cancer, stroke, IHD, pneumonia, septicaemia and falls were compared between 1974 and 1984, and between 1984 and 1994. If the lxA/lx of a certain disease at 65 is larger than the value before 65, this disease is more important in the elderly population than at younger ages.. Results Change in life expectancy from 1974 to 1994 The life expectancy of those aged 0, 65 and 85 years was 66.92, 12.20 and 3.10 years respectively for men and 72.29, 14.63 and 4.16 years for women in 1974. The life expectancy of those aged 0, 65 and 85 was 71.81, 14.76 and 5.23 years for men and 77.76, 17.21 and 5.72 years for women in 1994. These figures showed substantial gains in the past 20 years, with a more rapid change between 1974 and 1984 than between 1984 and 1994. The relative gain was more obvious for those age 85 and older. There was a gradual decrease in sex differences and an increase in the male to female ratio at age 85 (Tables 1 and 2): although women still live longer than men, the differences have become smaller in recent years.. Table 2. Absolute and relative differences in life expectancy between sexes at different ages in 1974, 1984 and 1994. ðlt Þð qtA Þ. Sex difference .......................................................................................... t ¼x. At age 0. At age 65. .......................... The probability of surviving to age x is lx = lx–1 (1– qx–1). lxA/lx estimates the proportion of deaths due to cause A for people who survived to age x. It also implied the probability that a person surviving to age x. Years. M/F (%). ............................ Years. 1974 1984 1994. 5.37 5.18 5.95. 92.6 93.1 92.3. 2.43 2.14 2.45. Change in life expectancy ............................................................................................ At age 65. ..................... Years. %. At age 85. .......................... Years. %. .......................... Years. %. ........................................................................................................................ Men 1974–84 1984–94 Women 1974–84 1984–94. 200. Years. M/F (%). ........................................................................................................ Table 1. Absolute and relative change of life expectancy between 1974 and 1984 and between 1984 and 1994. At age 0. M/F (%). At age 85 ........................... 2.84 2.05. 4.2 2.9. 1.45 1.11. 11.9 8.1. 1.37 0.76. 44.2 17.0. 2.65 2.82. 3.7 3.8. 1.16 1.42. 7.9 9.0. 1.04 0.52. 25.0 10.0. 83.4 86.4 85.8. 1.06 0.73 0.49. 74.5 86.0 91.4.
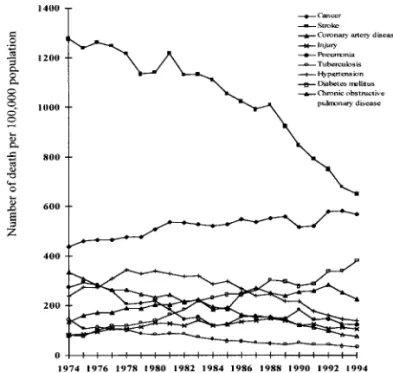
(3) Mortality trends of elderly people in Taiwan. Figure 1. Changes in mortality of men aged 65 and older between 1974 and 1994.. Change in cause mortality rates from 1974 to 1994 Figure 1 shows a sharp decline in stroke mortality and a sustained increase in cancer mortality in aged men. These two curves crossed in 1988, when cancer became the major cause of death for men. IHD mortality gradually increased but in a fluctuating course. Fatal hypertensive disease and chronic pulmonary disease declined almost at the same pace. Deaths related to diabetes mellitus showed a fourfold increase from 1974 to 1994. Tuberculosis deaths rapidly declined from 1974 to 1984 and then flattened out. Pneumonia deaths increased from 1984. Figure 2. Changes in mortality of women aged 65 and older between 1974 and 1994.. until 1990 and then fell to the 1986 level. The rate of deaths caused by accidents gradually rose from 1974 to 1981, then levelled off at 2.2–2.6 per thousand per year. The change of mortality rates in the above conditions in women is shown in Figure 2. The decline in stroke mortality and rise in cancer mortality were similar to men except that these two curves have not yet crossed. Stroke was still the main cause of death in aged women before 1994. The change in mortality for the other diseases and injuries were similar to that of men except that the values of the rates and the amplitude of change were smaller and the increase of mortality associated with diabetes mellitus was steeper for women.. Table 3. Proportion of deaths (100 × lxA/lx) for cancer, stroke, ischaemic heart disease (IHD), pneumonia, septicaemia and falls in 1974, 1984 and 1994 At birth. At age 65. ..................................................... 1974. 1984. 1994. At age 85. ...................................................... 1974. 1984. 1994. ..................................................... 1974. 1984. 1994. ......................................................................................................................................................................................................................... Men Cancer Stroke IHD Pneumonia Septicaemia Fall Women Cancer Stroke IHD Pneumonia Septicaemia Fall. 11.81 17.71 2.28 5.74 0.44 0.45. 15.49 16.85 3.96 2.69 0.47 0.85. 19.85 12.50 5.24 3.71 1.42 0.93. 9.82 19.89 2.49 5.97 0.25 0.32. 13.50 18.66 4.54 3.01 0.39 0.62. 18.00 13.63 5.69 4.53 1.56 0.55. 3.94 13.84 1.40 7.44 0.18 0.53. 7.01 12.84 4.50 4.35 0.15 0.87. 9.79 11.12 4.61 6.39 1.40 0.40. 9.63 20.46 2.14 5.36 0.37 0.31. 11.72 20.33 3.59 2.63 0.54 0.66. 14.17 14.65 5.15 3.12 1.73 0.53. 7.04 21.79 2.30 5.17 0.24 0.29. 9.07 21.37 3.94 2.74 0.48 0.63. 11.51 15.41 5.50 3.45 1.78 0.44. 2.71 12.75 1.77 6.51 0.17 0.47. 4.28 15.17 3.78 3.75 0.33 0.86. 5.88 12.52 5.20 4.37 1.89 0.49. 201.
(4) K.-K. Leung et al. Table 4. Absolute and relative change of proportion of deaths for cancer, stroke, ischaemic heart disease (IHD), pneumonia, septicaemia, and falls between 1974 and 1984, 1984 and 1994 in elderly people in Taiwan. Sex/ cause of death. At birth. At age 65. ............................................................. ............................................................. At age 85. 1974–84. 1984–94. 1974–84. 1984–94. ............................ ............................. ............................ ............................ Years. Years. Years. Years. %. %. %. ............................................................. 1974–1984 %. ............................ Years. %. 1984–1994 ............................ Years. %. ......................................................................................................................................................................................................................... Men Cancer Stroke IHD Pneumonia Septicaemia Falls Women Cancer Stroke IHD Pneumonia Septicaemia Falls. 3.68 1.68 ¹0.86 ¹3.05 0.03 0.40. 31.16 73.68 ¹4.86 ¹53.14 6.82 88.89. 4.36 1.28 ¹4.35 1.02 0.95 0.08. 28.15 32.32 ¹25.82 37.92 202.13 9.41. 3.68 2.05 ¹1.23 ¹2.96 0.14 0.30. 37.47 82.33 ¹6.18 ¹49.58 56.00 93.75. 4.50 1.15 ¹5.03 1.52 1.17 ¹0.07. 33.33 25.33 ¹26.96 50.50 300.00 ¹11.29. 3.07 3.10 ¹1.00 ¹3.09 ¹0.03 0.34. 77.92 221.43 ¹7.23 ¹41.53 ¹16.67 64.15. 2.78 0.11 ¹1.72 2.04 1.25 ¹0.47. 39.66 2.44 ¹13.40 46.90 833.33 ¹54.02. 2.09 1.45 ¹0.13 ¹2.73 0.17 0.35. 21.70 67.76 ¹0.64 ¹50.93 45.95 112.90. 2.45 1.56 ¹5.68 0.49 1.19 ¹0.13. 20.90 43.45 ¹27.94 18.63 220.37 ¹19.70. 2.03 1.64 ¹0.42 ¹2.43 0.24 0.34. 28.84 71.30 ¹1.93 ¹47.00 100.00 117.24. 2.44 1.56 ¹5.96 0.71 1.30 ¹0.19. 26.90 39.59 ¹27.89 25.91 270.83 ¹30.16. 1.57 2.01 2.42 ¹2.76 0.16 0.39. 57.93 113.56 18.98 ¹42.40 94.12 82.98. 1.60 1.42 ¹2.65 0.62 1.56 ¹0.37. 37.38 37.57 ¹17.47 16.53 472.73 ¹43.02. Change in proportion of deaths (lxA /lx) from 1974 to 1994 A person at 65 had a higher probability of dying from stroke and IHD than a person at 85. The probability of dying with pneumonia increased with advanced age, whereas that of septicaemia declined with age. The probability of deaths related to falls did not change very much with age (Table 3). The changes in proportion of deaths are shown in Table 4. The probability of dying from cancer increases with time. IHD shows a similar pattern, but the increase is more rapid at age 85 only from 1974 to 1984. The probabilities of stroke death declined continuously from 1974 to 1994, the change being more rapid at age 65 in the 1984 to 1994 period in both sexes. The probability of dying with pneumonia decreased from 1974 to 1984, but increased from 1984 to 1994. For septicaemia, there was a huge increase in mortality from 1984 to 1994 in both sexes. At age 85, men have twice the rate of death from septicaemia as women. From 1974 to 1984, there was an increase in fall-related deaths in all ages for both sexes. From 1984 to 1994, fall-related deaths mostly declined, especially at age 85.. Discussion An increase in the proportion of aged people in a population has three main causes: a decreased birth rate, a decline in premature deaths and a decrease in mortality in the aged. After implementation of the birth control programme in 1964, the crude birth rate in Taiwan declined from 50 per thousand in 1951 to 16 per thousand in 1986 [9]. The crude death rate declined from 18 per thousand in 1947 to 5 per thousand in 1965. After 1965, the crude death rate. 202. levelled off and even increased slightly to 5.6 in 1995 [9]. This infers that the decline in birth and death rates contributed to the increase in the aged population before the mid-1980s. Afterwards, the increase in life expectancy was mainly caused by prolongation of life in aged people. Another important finding is the diminishing of sex differences in life expectancy, especially in people age 85 and older. In this they differ from elderly Americans, in whom the sex difference in life expectancy has progressively widened since 1950 [10]. The mortality rate of elderly people continued to decline from 1974 to 1994. Mortality from strokes in elderly people has halved in the past 20 years. Hypertensive disease mortality has also declined, but to a lesser degree. There have been nationwide hypertension, stroke prevention and anti-smoking programmes since the late 1980s, but the decline in cerebrovascular mortality cannot be solely due to these programmes. Improvements in lifestyles and increased accessibility to health care may play a role in the reduction of stroke mortality. Cancer mortality continues to increase. The decline in IHD mortality is probably due to the effects of the above programmes as well as diet education. However, a longer period of observation is needed to see whether this is a real trend or just a year-toyear fluctuation. Diabetes mellitus has emerged as another important chronic disease especially in elderly women. Since many diabetic patients die of other diseases (such as end-stage renal disease or infection), the impact of diabetes mellitus is often underestimated. Injury-related mortality in elderly men and women had a twofold increase between 1974 and 1994, similar to the 1.6 increase between 1974 and 1990 [11]. Taiwan’s decline in stroke mortality is similar to that of most western industrialized countries though we.
(5) Mortality trends of elderly people in Taiwan had a time-lag of 10 years; the decline of IHD mortality is less marked, and cancer mortality increased more quickly [12, 13]. We found an increase in the probability of pneumonia deaths in aged people. Since the increase in pneumonia and septicaemic deaths outweighed the decline in fall-related deaths, there was a net increase in mortality from these three conditions. This evidence does not support Fries’ hypothesis and suggests that the average health status declines in advanced age. There are several limitations and possible biases in this study. First, an autopsy diagnosis is the most important confirmation of the reliability of death certificates. Unfortunately, the autopsy rate in Taiwan is extremely low. Secondly, physicians frequently list ‘cardiac’ and ‘respiratory’ as causes of deaths on death certificates in Taiwan [14]. This overestimates common causes of death and underestimates underlying or occult causes [15]. Thirdly, only a single cause of death is coded and analysed in the mortality statistics in Taiwan. This obscures deaths due to multiple causes, especially in those with chronic diseases [16]. Fourthly, our study period covered the 8th and 9th editions of the ICD. Changes in coding may cause a sudden jump between two consecutive years before and after a new edition, although long-term trends can be interpreted without major distortion. Mortality statistics are easily available sources of data. The results of this study are useful for public health planning, though careful interpretation is necessary.. Key points. • The progressive increase in life expectancy in Taiwan for the past decade is mainly due to prolongation of life in aged people. • There is a trend of a decrease in sex differences in life expectancy, especially in people aged 85 and older. • Cancer is a major cause of death in aged people in Taiwan and the commonest cause of death in old men. • Diabetes mellitus is now an important cause of chronic disease-related death, especially in elderly women. • There was an increase in deaths due to ‘frailty’, which implies that the expanding elderly population in Taiwan seemed to suffer from poorer health in the later stages of life.. References 1. Chen KJ. A study of elderly welfare policy to meet the ageing population. Taipei: Research, Development and Evaluation Council, 1987. 2. Chan HS. Ageing in Taiwan. In Phillips DR eds. Ageing in East and South-East Asia. London, Edward Arnold, 1992, 128–47. 3. Fries JF. Aging, natural death, and the compression of morbidity. N Engl J Med 1980; 303: 130–5. 4. Schneider EL, Brody JA. Aging, natural death, and the compression of morbidity: another view. N Engl J Med 1983; 309: 854–5. 5. Manton KG. Cause specific mortality patterns among the oldest old: multiple cause of death trends 1968 to 1980. J Gerontol 1986; 41: 282–9. 6. Winograd CH, Geretz MB, Chung M, Goldstein MK, Dominguez F, Vallone R. Screening for frailty: criteria and predictors of outcome. J Am Geriatr Soc 1991; 39: 778–84. 7. Tinetti ME, Inouye SK, Gill TM, Doucette JT. Shared risk factors for falls, incontinence and functional dependence. JAMA 1995; 273: 1348–53. 8. Preston SH, Keyfitz N, Schoen R. Causes of Death: life tables for national populations. New York: Seminar, 1972, 9–54. 9. Department of Health, the Executive Yuan. Public Health in Taiwan Area, Republic of China. Taiwan: Department of Health, 1991; 32–3. 10. Wylie CM. Contrasts in the health of elderly men and women: an analysis of recent data for whites in the United States. J Am Geriatr Soc 1984; 32: 670–5. 11. Chiou ST, Tsauo JY, Wang JD. Trends in mortality rates and years of potential life lost due to elderly accidents in Taiwan from 1974 to 1990 (English abstract). J Natl Public Health Assoc (ROC) 1993; 12: 405–20. 12. Thom TJ, Epstein FH. Heart disease, cancer, and stroke mortality trends and their interrelations: an international perspective. Circulation 1994; 90: 574–82. 13. Davis DL, Hoel D, Fox J, Lopez A. International trends in cancer mortality in France, West Germany, Italy, Japan, England and Wales, and the USA. Lancet 1990; 336: 474–81. 14. Lee LT, Lai MS, Chen CY, Hsieh WC. Analysis of causes of death, Shuang-Hsi township Taipei county (English abstract). J Natl Public Health Assoc (ROC) 1988; 8: 101–8. 15. Goldacre MJ. Cause-specific mortality: understanding uncertain tips of the disease iceberg. J Epidemiol Community Health 1993; 47: 491–6. 16. Steenland K, Nowlin S, Ryan B, Adams S. Use of multiple-cause mortality data in epidemiologic analyses: US rate and proportion files developed by the National Institute for Occupational Safety and Health and the National Cancer Institute. Am J Epidemiol 1992; 136: 855–62.. Received 23 September 1997; accepted 12 March 1998. 203.
(6) John Crabtree, aged 91, in his back garden, Oldham. 䉷 Ian Beesley..
(7)
數據

相關文件
The ontology induction and knowledge graph construction enable systems to automatically acquire open domain knowledge. The MF technique for SLU modeling provides a principle model
• To enhance teachers’ knowledge and understanding about the learning and teaching of grammar in context through the use of various e-learning resources in the primary
Xianggang zaji (miscellaneous notes on Hong Kong) was written by an English and translated into Chinese by a local Chinese literati.. Doubts can therefore be cast as to whether
vs Functional grammar (i.e. organising grammar items according to the communicative functions) at the discourse level2. “…a bridge between
(b) reviewing the positioning of VPET in the higher education system in Hong Kong, exploring the merits of developing professional vocational qualifications at the degree
220V 50 Hz single phase A.C., variable stroke control, electrical components and cabling conformed to the latest B.S.S., earthing through 3 core supply cable.. and 2,300 r.p.m.,
Wang, Solving pseudomonotone variational inequalities and pseudocon- vex optimization problems using the projection neural network, IEEE Transactions on Neural Networks 17
In this paper, we build a new class of neural networks based on the smoothing method for NCP introduced by Haddou and Maheux [18] using some family F of smoothing functions.
