Note
Spin Transition of [Fe(btr)
3](ClO
4)
2Studied by X-ray Absorption
Spectroscopy
Yen-Chen Lina( ), I-Jui Hsua( ), Hui-Huang Hsiehb( ), Jyh-Fu Leec( ), Jin-Ming Chenc( ),
Jenn-Min Leec( ) and Yu Wanga* ( ) a
Department of Chemistry, Taiwan University, Taipei, Taiwan, R.O.C. b
Department of Electrical Engineering, Chung Cheng Institute of Technology, National Defense University, Taoyuan, Taiwan, R.O.C.
c
National Synchrotron Radiation Research Center, Hsinchu, Taiwan, R.O.C.
Complex [Fe(btr)3](ClO4)2(where btr = 4,4¢-bis-1,2,4-triazole) exhibits an unusual two-step spin transition at 188 K and 225 K, respectively. The corresponding three-dimensional framework structure at each step was characterized by X-ray diffraction. X-ray absorption spectroscopy (XAS) at both the Fe K-edge and the Fe L-edge is performed to probe the exact electronic configuration at various tempera-tures. The two-step behavior observed in the magnetic measurement is well reproduced by XAS. Two types of spin transitions: one abrupt and the other gradual are also observed precisely. The proper tech-nique on monitoring the spin transition by taking advantage of synchrotron radiation is therefore estab-lished.
Keywords: Two-step spin transition; X-ray absorption spectroscopy; Fe complex.
INTRODUCTION
Spin crossover complexes have drawn great attention over the past few decades. Octahedrally coordinated FeII (d6) complexes exhibit either a high spin or a low spin con-figuration depending on the corresponding ligand field strength, 10Dq, according to the Tanabe-Sugano diagram. Spin transition between5T2(high spin, t2g4eg2, S = 2) and 1
A1(low spin, t2g6eg0, S = 0) does occur as the consequence of external perturbation such as temperature, pressure and light irradiation.1-4Taking advantage of such dual proper-ties in magnetism, spin crossover (SCO) compounds do have great potential in applications in devices of storage, display and molecular switches.1,5-7The magnetic behav-iors of SCO systems cover a great variety; for instance, the spin transition can be gradual or abrupt, single or multiple steps, complete or incomplete, or with wide or narrow hys-teresis loop. Efforts have been focused on fine-tuning the ligand field strength through modifying ligands by varying substituents,2,8altering conformations9-10or designing new ones. Lots of attention has also been paid to improve the co-operative effect by (i) having the SCO complexes
incorpo-rated into 2D or 3D frameworks;3,11(ii) enhancingp-p in-teractions between stacked layers with extensive aromatic ligands;3,12(iii) varying different counter anions;13-19and (iv) crystallizing with different solvent molecules.20-21
Complex Fe(btr)3(ClO4)2(btr = 4,4¢-bis-1,2,4-triazole) was first synthesized and characterized both structurally and magnetically by Garcia et al.22Two crystallographi-cally unique Fe sites (Fe1 and Fe2) are located in the rhom-bohedral lattice; six btr ligands are coordinated around each of the Fe to form a pseudo-octahedral environment (Fig. 1a). Meanwhile, each neighboring Fe pair is bridged by a btr ligand, leading to a three dimensional framework structure (Fig. 1b). The observed Fe-N bond distances characterized respectively at 260 K, 190 K and 150 K are consistent with the magnetic measurements, namely the spin states of Fe atoms being HS-HS at 260 K, HS-LS at 190 K and LS-LS at 150 K. Fine-tuning of ligand field strength around the two Fe sites through different inter-molecular hydrogen bonds was proposed for the conse-quent two-step spin transition (one abrupt and one grad-ual).
Although the shortening of the Fe-N bond distance
(due to the loss of two unpaired electrons at the antibonding eg* orbitals of the Fe atom) has been taken as an important indicator for the evidence of spin transition, X-ray absorp-tion spectroscopy (XAS) in the near edge region provides the exact electronic configurations of the target atom. The K-edge absorption of Fe corresponds to the electronic exci-tation from the 1s to 4p orbitals and the L-edge absorption of Fe corresponds to that of the 2p to 3d orbitals. Thus, tem-perature dependent XAS technique (at both the Fe K-edge and the L-edge) is applied to investigate the spin transition of [Fe(btr)3](ClO4)2in the present work. The advantage of such a technique is it is atom specific, reflecting only the exact electronic configuration of the target atom.
EXPERIMENT
Sample preparation and magnetic measurement
[Fe(btr)3](ClO4)2was prepared according to the liter-ature.22The magnetic measurement was performed with a SQUID magnetometer (MPMS7 Quantum Design com-pany) under an external magnetic field of 0.5 Tesla at a tem-perature range of 2 K to 300 K. Diamagnetic calibrations are applied, using tabulated Pascal’s constants.
X-ray absorption spectroscopy
X-ray absorption spectra at the Fe K-edge were col-lected at beamline 17C at NSRRC (in Taiwan) with opera-tional energy of 1.5 GeV and working current of 100 ~ 200 mA. A Si(111) double crystal monochromator was opti-mized to reach an energy resolution (DE/E) of about 2*10-4
. An Oxford APD cryostat was utilized to support and con-trol the ultra low temperature environment under a vacuum of£ 10-3torr within the sample chamber. For all the data collections, samples were glued on an In foil (an excellent thermal conductor), which were then fixed at a Cu holder mounted on the APD cooling system. Due to the applied transmission mode for temperature dependent measure-ments, a well-ground sample was mixed evenly with Var-nish grease for better thermal conductivity at low tempera-ture. Energy calibration was based on the absorption edge of the Fe foil.
Fe L-edge absorption spectra were recorded at beam-line 11A (Dragon) and repeated at beambeam-line 20A (HSGM) for temperature calibration in NSRRC. After being mounted on a Cu holder with carbon conducting tape, crushed crys-tals were used for measurement with the sample current mode at a working vacuum of < 10-9torr within the sample chamber. Energy calibration was based on the LIII absorp-tion edge ofa-Fe2O3at 708.5 eV.
RESULTS AND DISCUSSION Magnetic Measurements
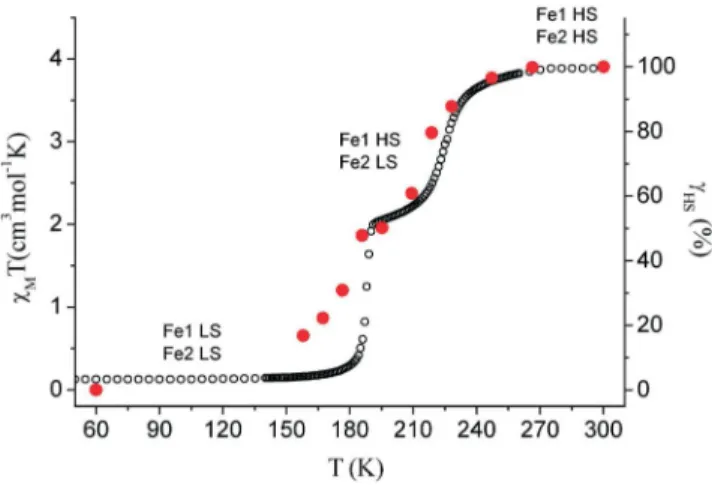
The two-step magnetic behavior is shown in Fig. 2, which reproduces the result given in the literature.22The molar susceptibility,cmT, is roughly 3.8 cm3Kmol-1in the temperature range of 260 K to 300 K, which corresponds to two HS species; actually the Fe-N distances are 2.161(3) Å and 2.164(3) Å for Fe1 and Fe2 respectively at 260 K, and these correspond to typical HS Fe-N bond distances.
Fur-Fig. 1. (a) Local environment of Fe(btr)3(ClO4)2around
Fe2 (viewing along 3-fold axis). (b) 3D frame-work structure. All the H atoms and perchlorate counteranions are not shown. Cif file was taken from Garcia et al.22
ther cooling from 260 K to 210 K results in a gradual spin transition before the plateau exhibited between 190 K and 210 K. ThecMT value at 200 K is 2.09 cm3Kmol-1, indicat-ing only half of the FeIIions in the lattice undergo the spin transitions, while the other half stay in HS states. In other words, the spin transition only takes place on one of the Fe sites when cooling from 260 K to 210 K (with T1/2= 225 K). The Fe-N distances at 190 K are 2.151(3) Å and 2.007(3) Å for Fe1 and Fe2 respectively,22indicating that Fe1 is in the HS and Fe2 is in the LS state. In addition, an abrupt drop in cMT value is observed with the subsequent cooling, corre-sponding to the spin transition of the second Fe site (T1/2= 188 K). The Fe-N distances at 150 K are 1.987(5) Å and 1.994(5) Å for Fe1 and Fe2, respectively,22showing both Fe sites are in LS states. Thus, the magnetic measurement is in very good agreement with the structural data at three temperatures. Slight discrepancies in T1/2 values might have resulted from temperature calibration on different in-struments. Apparently the spin transitions taking place at Fe1 and at Fe2 differ not only on the temperature but also the characteristic: one gradual for Fe2 and the other abrupt for Fe1. The cause of this could be quite complicated; it is often explained1-4as the effect of intermolecular interac-tion or a cooperative effect between molecules.
Fe K-edge XANES Spectra
X-ray near-edge absorption spectra (XANES) at the Fe K-edge measured at various temperatures (by heating mode) are shown in Fig. 3. Typical spectra of FeIIin HS and LS states24-29are well reproduced at 300 K and 60 K,
re-spectively. A shift of edge position toward higher energy and a corresponding decrease in the white line region (la-beled as region A and B) are observed while transition from the HS(t2g4eg*2) to the LS(t2g6eg*0) state. As proposed by Briois et al.,25better overlap between orbitals of Fe and N atoms (as the consequence of shortening in Fe-N bonds) for the LS state leads to a stabilization in thes bonding orbital (p, d of Fe and 2p of N) and to a destabilization in the corre-spondings* anti-bonding one, thus yielding a shift of edge position toward higher energy in the LS state. A decrease in edge absorption can be understood by the accompanying smaller contribution of the Fe 4p orbital in thes* anti-bonding orbital in the LS state than that in the HS state. Fur-thermore, shoulder A was assigned as 1s to 4p transition, according to Hannay et al.26However, the energy differ-ence between A and B is too large to assign B as a distin-guishable 4p component (such as 4px, 4pyor 4pz,). Never-theless, full multiple scattering processes were applied to simulate a few SCO systems,25,28of which curvature of re-gions B, C, D and M were all reproduced successfully. Comparable profiles of the title compound (Fig. 3) are also observed; therefore, it is feasible that similar multiple scat-tering process could be used to interpret these K-edge XAS spectra.
Fig. 2. (Open circle, left axis) Magnetic measurement of Fe(btr)3(ClO4)2. (Close circle, right axis) HS
contribution derived from corresponding Fe K-edge absorption spectra.
Fig. 3. A series of Fe K-edge absorption spectra of Fe(btr)3(ClO4)2measured at various
Evolution of XANES features with increasing tem-perature between 60 K and 300 K are illustrated in Fig. 3. Even at 150 K, a small amount of the HS component is de-tected according to the slight alteration in edge profile. Fur-ther enhanced absorptions (at ~ 7126 eV) as well as changes in regions C, D and M are observed with increasing temper-ature up to 180 K, indicative of a spin transition occurring at one of the Fe sites from the LS to HS states. Similar spec-tra between 180 K and 190 K are consistent with the plateau exhibited in the corresponding magnetic measurement (Fig. 2). From 190 K to 300 K typical features of the HS state increase progressively with temperature, indicating a gradual spin transition at the other Fe site.
The fraction of the HS state,gHS, at certain tempera-tures is derived by fitting the XAS spectrum with the suit-able percentage of typical HS and LS spectra measured at 300 K and 60 K, respectively. The fraction of HS state,gHS, versus T is presented as solid circles in Fig. 2. It is easy to see the two-step transition as expected from the magnetic measurement. The gradual spin transition between 300 K to 190 K and the plateau between 190 K and 180 K can be re-produced adequately. However, the abrupt spin transition at 188 K from magnetic measurement is not reproduced; in-stead a very gradual one is found. This may be due to the sample grinding since a similar phenomenon was observed in the case of Fe(PY5)2+Xn(X = MeCN and MeOH)29when XAS data collections were measured on the well-ground powder samples. In addition, moderation of SCO behaviors are known in pressure dependent experiments30as well as in some doped systems (e.g. FexM1-x(btr)2(NCS)2·H2O, M = Co, Ni31-32). Presumably, weakening of the cooperative effect is expected under such circumstances.
Fe L-edge Absorption Spectra
L-edge absorption spectroscopy is an even more sen-sitive tool for probing the electronic configuration of 3d transition metal atoms in comparison to the K-edge one, since it corresponds to an electric dipole allowed transition from 2p to unoccupied 3d valence orbitals. Thus, the L-edge absorption can be used to monitor (i) the nature of the absorber and the 3d orbital population (the electronic con-figuration) of the metal ion, (ii) the local symmetry around the metal atom and (iii) the strength of the embedded crys-tal field, as proposed by Briois et al.25Consequently, fea-tures of LIIand LIIIabsorption profiles provide fingerprints
of different metal atoms with different oxidation states, and/or with different local geometry. They are extremely sensitive to the d-orbital populations and their electron density distribution; thus it is useful for the observation on the spin state. Typical HS and LS spectra of Fe in octahe-dral geometry are well characterized,24,25and can be ap-plied to monitor the detailed process of spin transition.
A series of Fe L-edge absorption spectra were mea-sured at various temperatures; selected spectra are shown in Fig. 4. A typical L-edge XAS of FeII in HS and LS states24,25is recognized in the spectrum collected at 300 K and 95 K, respectively. The two-step transition feature is quite observable in the series of spectra, which is consistent with that observed in magnetic measurement. Spectra be-low 174 K are essentially the same, i.e. all Fe ions are in the LS state. However, from 174 K to 179 K, there is a drastic change in the spectrum; the shoulder at the lower LIII ab-sorption edge of the LS state becomes sharpened together with the broadening of the LIIIpeak and the weakening in the LIIregion, which is indicative of the appearance of the HS state. Such a sudden alteration in the spectra within a small temperature range is comparable to the abrupt transi-tion occurring at 188 K exhibited in magnetic measure-ment. In fact, similar spectra recorded from 179 K to 197 K are in good agreement with the plateau observed in the magnetic measurement in Fig. 2. The spectra within this temperature range can be simulated with a 50% contribu-tion each from the HS (at 300 K) and LS states (at 95 K) shown in Fig. 5. Thus, it is reasonable to say that one Fe site is in the HS state while the other one is in the LS state. In fact, the simulated spectrum matches quite well with the spectrum measured at 179 K. Relative intensities of the two strong absorption peaks in the LIIIregion change signifi-cantly but gradually from 197 K to 300 K, which is again consistent with the gradual spin transition detected in mag-netic measurement. Slight mismatches in temperature val-ues between the XAS and the magnetic measurement might originate from the exact temperature calibration between the two measurements. It can also come from the tempera-ture gradient between the sample position and the cold head of the cryostat in the XAS experiment. However, the two-step spin transition (one abrupt and one gradual) was quali-tatively reproduced both in temperature dependent Fe K-edge and L-K-edge absorption measurements. The fitting of the HS fraction from the L-edge absorption is unsuccessful
due to the difficulty in normalizing the series of spectra. However from the profile of the spectra, it is easy to follow the process of spin transition; in this case, the L-edge
ab-sorption gives clear and highly responsive changes.
SUMMARY
Here we present a way of directly monitoring the change in an exact electronic configuration of Fe by mea-suring the X-ray absorption taking advantage of the syn-chrotron radiation. The good agreement between the change in the HS/LS fraction from the XAS and the magnetic mea-surement indicates that the spin only model is suitable for the material. Such an XAS technique is a great tool to fol-low the detailed process on the change in the electronic configuration of chosen metal ions.
Received August 7, 2006.
REFERENCES
1. Top. Curr. Chem. 2004, 233-235 (special issues (Vol. 233-235) of Spin Crossover in Transition Metal Compounds) edited by Gütlich P.; Goodwin H. A.
Fig. 4. A series of Fe L-edge absorption spectra of Fe(btr)3(ClO4)2measured at various temperatures.
Fig. 5. Simulated spectrum of 50% HS and LS each; together with spectra of pure HS at 300 K, of pure LS at 95 K and of HS-LS state at 179 K.
2. Gütlich, P.; Garcia, Y.; Goodwin, H. A. Chem. Soc. Rev.
2000, 29, 419-427.
3. Real, J. A.; Gaspa, A. B.; Niel, V.; Muñoz, M. C. Coord.
Chem. Rev. 2003, 236(1-2), 121-141.
4. Real, J. A.; Gaspa, A. B.; Niel, V.; Muñoz, M. C. Dalton
Trans. 2005, 2062-2079.
5. Kahn, O.; Martinez, C. J. Science 1998, 279, 44-48. 6. Sato, O. Acc. Chem. Res. 2003, 36, 692-700.
7. Bousseksou, A.; Molnár, G.; Demont, P.; Menegotto, F. J.
Mater. Chem. 2003, 13, 2069-2071.
8. Holland, J. M.; McAllister, J. A.; Kilner, C. A.; Pett, M. T.; Bridgeman, A. J.; Halcrow, M. A. J. Chem. Soc. Dalton
Trans. 2002, 548-554.
9. Roux, C.; Zarembowitch, J.; Callois, B.; Granier, T.; Claude, R. Inorg. Chem. 1994, 33, 2273-2279.
10. Boillot, M.-L.; Roux, C.; Audière, J.-P.; Dausse, A.; Zarembowitch, J. Inorg. Chem. 1996, 35, 3975-3980. 11. Garcia, Y.; Niel, V.; Muñoz, M. C.; Real, J. A. Top. Curr.
Chem. 2004, 233, 229-257.
12. Zhong, Z.-J.; Tao, J.-Q.; Yu, Z.; Dun, C.-Y.; Liu, Y.-J.; You, X.-Z. J. Chem. Soc. Dalton Trans. 1998, 327-328.
13. Garcia, Y.; Ksenofontov, V.; Gütlich, P. C. R. Acad. Sci,
Paris, Chimie/Chemistry 2001, 4, 227-233.
14. Money, V. A.; Elhaïk, J.; Evans, I. R.; Halcrow, M. A.; Howard, J. A. K. J. Chem. Soc. Dalton Trans. 2004, 65-69. 15. Sugiyarto, K. H.; Craig, D. C.; Rae, A. D.; Goodwin, H. A.
Aust. J. Chem. 1988, 41, 1645-1663.
16. Sugiyarto, K. H.; Craig, D. C.; Rae, A. D.; Goodwin, H. A.
Aust. J. Chem. 1993, 46, 1269-1290.
17. Sugiyarto, K. H.; Craig, D. C.; Rae, A. D.; Goodwin, H. A.
Aust. J. Chem. 1994, 47, 869-890.
18. Sugiyarto, K. H.; Scudder, M. L.; Craig, D. C.; Goodwin, H. A. Aust. J. Chem. 2000, 53, 755-765.
19. Sugiyarto, K. H.; Weitzner, K.; Craig, D. C.; Goodwin, H. A.
Aust. J. Chem. 1997, 50, 869-873.
20. Gütlich, P. Struct. Bonding (Berlin) 1981, 44, 83-195. 21. Halder, G. J.; Kepert, C. J.; Moubaraki, B.; Murray, K. S.;
Cashion, J. D. Science 2002, 298, 1762-1765.
22. Garcia, Y.; Kahn, O.; Rabardel, L.; Chansou, B.; Salmon, L.; Tuchagues, J. P. Inorg. Chem. 1999, 38, 4664-4670. 23. Gallois, B.; Real, J. A.; Hauw, C.; Zarembowitch, J. Inorg.
Chem. 1990, 29, 1152-1158.
24. Lee, J.-J.; Sheu, H.-S.; Lee, C.-R.; Chen, J.-M.; Lee, J.-F.; Wang, C.-C.; Huang, C.-H.; Wang, Y. J. Am. Chem. Soc.
2000, 122, 5742-5747.
25. Briois, V.; Cartier dit Moulin, Ch.; Sainctavit, Ph.; Brouder, Ch.; Flank, A.-M. J. Am. Chem. Soc., 1995, 117, 1019-1026. 26. Hannay, C.; H.-Franskin, M.-J.; Grandjean, F.; Briois, V.;
J.-P. Itié,; Polian, A.; Trofimenko, S.; Long, G. J. Inorg.
Chem. 1997, 36, 5580-5588.
27. Real, J. A.; Castro, I.; Bousseksou, A.; Verdaguer, M.; Burriel, R.; Castro, M.; Linares, J.; Varret, F. Inorg. Chem.
1997, 36, 455-464.
28. Briois, V.; Sainctavit, P.; Long, G. J.; Grandjean, F. Inorg.
Chem. 2001, 40, 912-918.
29. Rudd, D. J.; Goldsmith, C. R.; Cole, A. P.; Stack, T. D. P.; Hodgson, K. O.; Hedman, B. Inorg. Chem. 2005, 44, 1221-1229.
30. Roux, C.; Zarembowitch, J.; Lité, J.-P.; Polian, A.; Verdaguer, M. Inorg. Chem. 1996, 35, 574-580.
31. Martin, J.-P.; Zarembowitch, J.; Dworkin, A.; Haasnoot, J. G.; Godjovi, E. Inorg. Chem. 1994, 33, 2617-2623. 32. Martin, J.-P.; Zarembowitch, J.; Bousseksou, A.; Dworkin,
A.; Haasnoot, J. G.; Godjovi, E. Inorg. Chem. 1994, 33, 6325-6333.