國 立 交 通 大 學
電機與控制工程學系
碩 士 論 文
即時獨立成分分析演算法應用於無線嵌入式腦
機介面
Real-Time ICA Applied on Wireless Embedded
EEG-Based Brain-Computer Interface
研 究 生:蔡依伶
指導教授:林進燈 博士
即時獨立成分分析演算法應用於無線嵌入式腦機介面
Real-Time ICA Applied on Wireless EEG-Based
Brain-Computer Interface
研 究 生:蔡依伶 Student:I- Ling Tsai
指導教授:林進燈 博士 Advisor:Dr. Chin-Teng Lin
國立交通大學 電機與控制工程學系
碩士論文
A Thesis
Submitted to Department of Electrical and Control Engineering College of Electrical Engineering
National Chiao Tung University in Partial Fulfillment of the Requirements
for the Degree of Master in
Electrical and Control Engineering July 2008
Hsinchu, Taiwan, Republic of China
即時獨立成分分析演算法應用於無線嵌入式腦機介面
學生:蔡依伶
指導教授:林進燈 博士
國立交通大學電機與控制工程研究所
摘要
為了增進腦機介面(Brain-Computer Interface, BCI)使其可適用於真實的生活 環境,線上(online)人為校正、特徵擷取、圖像事別等訊號處理技術是不可或缺 的。因此腦機介面系統必須是個便利的大小、堅固耐用、重量輕且低功率消耗來 達到可穿戴、可攜性與持久性的需求。本論文提出一個視窗移動(Moving-Window) 的獨立成分分析法(Independent Component Analysis)並應用於一個以電池供應電 源、微小化的嵌入式腦機介面。本論文也藉由模擬訊號與真實腦波訊號測試此嵌 入式腦機介面。且經由實驗結果指出視窗移動的獨立成分演算法的分離效果與同 樣離線(offline)演算法,提出獨立成分分析演算法在腦機介面上即時分析的可行 性。為了展示可穿戴式嵌入式腦機介面的可行性,本論文也實現了移動與平均 (Moving-average)頻譜分析於獨分成分分析結果的成分作用來達到即時並連續偵 測受測者的任務表現。
Real-Time ICA Applied on Wireless Embedded
EEG-Based Brain-Computer Interface
Student: I-Ling Tsai
Advisor: Dr. Chin-Teng Lin
Department of Electrical and Control Engineering
National Chiao Tung University
Abstract
Online artifact correction, feature extraction, and pattern recognition are essential to advance the brain computer interface (BCI) technology so as to be practical for real-world applications. The BCI system should also be a convenient size, rugged, lightweight, and have low power consumption to meet the requirements of wearability, portability, and durability. This thesis proposes and implements a moving-windowed Independent Component Analysis (ICA) on a battery-powered, miniature, embedded BCI. This thesis also tests the embedded BCI on simulated and real EEG signals. Experimental results indicated that the efficacy of the window-based ICA decomposition is comparable with that of the offline version of the same algorithm, suggesting the feasibility of ICA for real-time analysis of EEG in a BCI. To demonstrate the feasibility of the wearable embedded BCI, this thesis also implements a moving-average spectral analysis to the resultant component activations to continuously estimate subject’s task performance in near real time.
Chinese Acknowledgements
誌 謝
本論文的完成,首先要感謝指導教授林進燈博士這兩年來的悉心指 導,讓我學習到許多寶貴的知識,在學業及研究方法上也受益良多。另外 也要感謝口試委員們的建議與指教,使得本論文更為完整。 其次,感謝實驗室的學長鍾仁峰及學長柯立偉、曲在雯博士在研究上 的指導。同學孟修、尚文、柏銓、玠瑤、邱德正、青甫、煒忠、寓鈞、毓 婷、建昇,在過去兩年研究生活中同甘共苦、相互扶持,及學姐陳玉潔與林 君玲、學長黃騰毅、陳世安與趙志峰、學弟妹們哲睿、有德、家欣、介恩、 昕展,在研究過程中所給我的鼓勵與協助,以及碩士班新生璽文、佩瑄、 育航、志賢在過去兩個月的幫忙。尤其是柯立偉學長、鍾仁峰學長與美國 加州聖地牙哥大學的鍾子平教授,在理論及程式技巧上給予我相當多的幫 助與建議,讓我獲益良多。也同樣感謝實驗室助理在許多事務上的幫助。 感謝我的父母親對我的教育與栽培,並給予我精神及物質上的一切支 援,使我能安心地致力於學業。此外也感謝對我不斷的關心與鼓勵。 謹以本論文獻給我的家人及所有關心我的師長與朋友們。Contents
摘要...ii Abstract... iii 誌 謝 ...iv Contents ...v List of Tables...viiList of Figures... viii
Chapter 1 Introduction...1
1.1 Brain Computer Interface ...1
1.2 Previous Work...1
1.3 Motivation...4
1.4 Organization of Thesis ...4
Chapter 2 Material and Method...6
2.1 Introduction...6
2.2 Material ...6
2.2.1 Electroencephalogram...6
2.2.2 EEG signal acquisition...7
2.3 Methods of Data Analysis...9
2.3.1 Independent Component Analysis ...9
2.3.2 Power Spectrum Analysis ...15
Chapter 3 Hardware Frameworks of Portable Data Acquisition...17
3.1 Introduction...17
3.2 Portable Data Acquisition System ...17
3.2.1 Four-Channel Front-End Circuits ...18
3.2.2 Analog to Digital Converter...22
3.2.3 Digital Controller ...23
3.3 Wireless Transmission ...24
3.4 Data Processing Platform...25
Chapter 4 Real-Time ICA Signal Processing...28
4.2 EEG Data for ICA...28
4.3 Information Maximization ICA ...31
4.4 Real-Time Signal Processing ...34
4.4.1 Window-Based ICA...34
4.4.2 Verification of Window-Based ICA...35
4.4.3 Real-Time ICA...41
4.4.4 Verification of Real-Time ICA ...43
Chapter 5 Experiment Results...51
5.1 Introduction...51
5.2 ICA Verification on EEG Signal ...51
5.2.1 Description of EEG Data ...51
5.2.2 Signal Processing Procedure on Drowsy Estimation...54
5.3 Verification of Real EEG Signals ...55
5.3.1 Down Sampling ...55
5.3.2 Moving-Average Spectrum Analysis ...58
5.3.3 Real EEG Signal Result ...60
Chapter 6 Conclusions...64
List of Tables
Table 1 : Common band of EEG...7
Table 2: Specifications of NuAmps ...9
Table 3: Specification of ADC...23
Table 4 : Correlation table of window-based and offline ICA...40
Table 5 : Comparison of execution time ...42
Table 6 : Correlation table of window-based ICA in time domain ...45
Table 7 : Correlation table of window-based ICA in frequency domain ...47
Table 8 : Execution time of once window-based ICA ...49
Table 9 : Correlation table of final setting for window-based ICA ...50
List of Figures
Fig. 2-1: Diagram of Wireless Brain Computer Interface...6
Fig. 2-2: Schematic pictures showed the lateral (A) and top view (B) of international 10-20 system of electrode placement [31]. ...8
Fig. 2-3: Photo showed the setup of the physiological recording containing the NuAmps EEG amplifier and the electrode cap...9
Fig. 2-4: N mixed signals and N sources ...10
Fig. 2-5: Typical super Gaussian variables is spiky. For comparison, the normal Gaussian is given by a dashed line. The other is sub Gaussian. ...12
Fig. 2-6: Diagram of moving-average power spectral analysis ...16
Fig. 3-1: Diagram of wireless and portable module ...17
Fig. 3-2: Diagram of portable front-end system ...18
Fig. 3-3: Photo of portable front-end system ...18
Fig. 3-4: Circuits of preamplifier ...19
Fig. 3-5: High-pass filter circuits ...20
Fig. 3-6: Low-pass filter circuits...20
Fig. 3-7: Simulation results of band-pass filter...21
Fig. 3-8: Circuits of gain amplifier ...21
Fig. 3-9: Analog acquisition module...22
Fig. 3-10: Timing diagram of AD7575 ...23
Fig. 3-11: Digital controller ...24
Fig. 3-12: Photo of Bluetooth Module...25
Fig. 3-13: System diagram of the board...26
Fig. 3-14: Photo of the board (upside and downside)...27
Fig. 4-1: Diagram of wireless signal processing...28
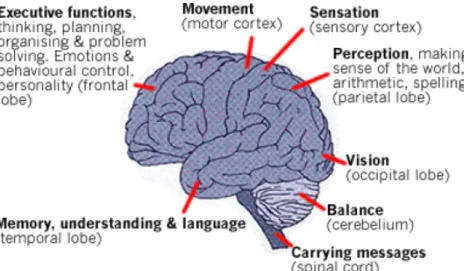
Fig. 4-2: Functions of brain’s area ...30
Fig. 4-3: EEG signal was recorded at one point which is a mixed signal...30
Fig. 4-4: Blind separation network for two-source mixtures...31
Fig. 4-5: Flowchart of Infomax ICA training...33
Fig. 4-6: Method of window-based and offline ICA ...35
Fig. 4-7: Original signals for ICA verification...36
Fig. 4-8: Mixed signals for ICA verification ...36
Fig. 4-9: Result of offline ICA component performed on PC platform...37
Fig. 4-10: Result of offline ICA component and spectrum performed on PC platform. ...37
Fig. 4-11: Result of window-based ICA component performed on PC platform. ...38
Fig. 4-12: Result of window-based ICA component and spectrum performed on PC platform...38
Fig. 4-13: Result of window-based ICA component performed on DSP platform...39
Fig. 4-14: Result of window-based ICA component and spectrum performed on DSP platform...39
Fig. 4-15: window-based ICA setting for real-time processing...43
Fig. 4-16: Result of window-based ICA Components performed on DSP (Setting 1 shown as the red line and Setting 2 shown as the blue one) ...44
Fig. 4-16: Result of window-based ICA Components performed on DSP (Setting 1 shown as the red line and Setting 3 shown as the blue one) ...45
Fig. 4-18: Results of window-based ICA Components performed on DSP: (left) 4-channel ICA components and (right) corresponding spectrum of Setting 1 (red line) and 2 (blue one). ...46
Fig. 4-19: Result of window-based ICA Components performed on DSP: (left) 4-channel ICA components and (right) corresponding spectrum of Setting 1 (red line) and 3 (blue one). ...46
Fig. 4-20: EEG signal results of window-based ICA Components use performed on DSP (Setting 1 shown as the red line and Setting 2 shown as the blue one) ...47
Fig. 4-21: EEG signal Results of window-based ICA Components use performed on DSP (Setting 1 shown as the red line and Setting 3 showed as the blue one) ...48
Fig. 4-22: Result of window-based ICA Components performed on DSP: (left) 4-channel ICA components and (right) corresponding spectrum of Setting 1 (red line) and final setting (blue one). ...50
Fig. 5-1: Overview of surrounded VR scene. The VR-based four-lane highway scenes are projected into surround screen with seven projectors processing...53
Fig. 5-2: Photo of the four-lane highway scene...53
Fig. 5-3: Diagram of EEG signal processing...54
Fig. 5-4: Diagram of EEG signal processing for verification...55
Fig. 5-5: Diagram of offline signal processing procedure ...56
Fig. 5-6: Correlation of ICA power and subject’s behavior ( Subject 1). Sample rate (left) is 250Hz and (right) 64Hz...57
Fig. 5-7: Correlation of ICA power and subject’s behavior (Subject 2). Sample rate (left) is 250Hz and (right) 64Hz...57
Fig. 5-8: Correlation of ICA power and subject’s behavior ( Subject 3). Sample rate (left) is 250Hz and (right) 64Hz...57
Fig. 5-9: Correlation of ICA power and subject’s behavior (Subject 4). Sample rate (left) is 250Hz and (right) 64Hz...58
Fig. 5-10: 5Hz signal (64Hz sample rate)...59
Fig. 5-11: Result of Moving-Average Spectrum Analysis on PC platform (5Hz signal) ...59
Fig. 5-12: Result of Moving-Average Spectrum Analysis on DSP platform (5Hz signal) ...60
Fig. 5-13: Diagram of real-time signal processing procedure ...61
Fig. 5-14: Correlation of ICA power and subject’s behavior (Subject 1) ...61
Fig. 5-15: Correlation of ICA power and subject’s behavior (Subject 2) ...62
Fig. 5-16: Correlation of ICA power and subject’s behavior (Subject 3) ...62
1 Chapter 1 Introduction
1.1
Brain Computer Interface
The Brain Computer Interface (BCI) system is a set of sensors and signal processing components that allows acquiring and analyzing brain activities with the goal of establishing a reliable communication channel directly between the brain and an external device such as a computer, neuroprosthesis, etc. Several existing brain monitoring technologies have been tested in BCI fields for acquiring data. They can be divided into two subcategories: i) noninvasive procedures such as the electroencephalogram (EEG), magnetoencephalography (MEG), functional magnetic resonance imaging (fMRI), positron emission tomography (PET), and near infrared spectroscopy (NIRS) and ii) invasive approaches such as the electrocorticography (ECoG) where the signal is recorded from intracranial microelectrodes[1]. Until now, majority of practical BCI systems exploit EEG signals and ECoG signals [1]. Indeed, since MEG, fMRI, and PET are expensive and bulky, and as fMRI, PET, and NIRS present long time constants, because they do not measure neural activity directly but rely on the homodynamic coupling between neural activity and regional changes in blood flow, they cannot be deployed as ambulatory BCI systems[2].
1.2
Previous Work
Over the past 15 years, BCI technology [2][3] is a research field that has emerged and grown rapidly. At the beginning, the purpose of BCI is
not only prosthesis but also is to help handicapped people [4], gradually. Because of the disability of muscle, handicapped people can not do things independently. For example, handicapped people cannot move, control devices without aid. Hence, to help these handicapped people, many researchers have devoted themselves to develop BCI. That is, as long as handicapped people are still cognitively healthy, they might able to move on an automatic wheel chair, and control the on/off switches of lamps via EEG recording and analysis. Through decades, it have been found in many studies that the cognitive state of a person can be extracted from brain activity [5][6]. More and more researchers are devoted to the study of BCI. BCI has helped handicapped to live independently. Recent studies in primates, human subjects of Serruya et al. [7] and Taylor et al. [8] have demonstrated that animals can learn to utilize their brain activity to control the displacements of computer cursors. Chapin et al. and Wessberg et al. also demonstrated that animals can learn to utilize their brain activity to control one- (1D) to three-dimensional (3D) movements of simple and elaborate robot arms [9][10]. However, many domestic researches were focusing on EEG data recording instead of EEG analysis [11]-[17]. Cheng et al. have developed wireless BCI based on steady-state visual evoked potential (SSVEP) [18]. They used twelve buttons illuminated at different rates on a computer monitor to simulate a telephone. Users could input phone numbers by gazing at these buttons. The frequency-coded SSVEP was used to judge which button the user attended to. Another study of Gao et al. used digital signal processor (DSP) to process EEG signals and wirelessly controlled appliances with visual evoked stimulus [19]. Pfurtscheller et al. have designed and
implemented an EEG-based communication device called “Virtual Keyboard” (VK). Classification of the EEG patterns was based on band power estimates and hidden Markov models (HMMs) [20][21]. Another research of Pfurtscheller et al. proposed an EEG-based Pocket BCI system that converted brain activity into control signals for left and right directions of a wheelchair [22]. Ashwin et al. described [23] a system that monitored EEG of epileptic patients to improve the quality of their lives and also helped healthcare providers to make a better diagnosis for patients with neurological disorders. The use of Bluetooth connectivity helps physicians to monitor patient activity while the patient resumes his or her normal activity.
Independent Component Analysis (ICA) [24], which had been widely studied during the last twenty years, is one of popular EEG signal separation tools. It is a novel statistical technique that aims at finding linear projections of data that maximize their mutual independence. Many groups are now actively engaged in exploring the potential of blind signal separation and signal deconvolution for revealing new information about the brain and body [25]. In general, most of ICAs are applied to feature extraction [2][26][27], such as blind source separation (BSS) with special emphasis on physiological data analysis and audio signal processing.
Hill et. al.[28][29][30], for example, demonstrated the use of ICA in an EEG-based BCI. However, in most of these studies, ICA and other signal-processing functions were performed offline on a personal computer, which hinders the wearability, portability and practical use of the systems in operational environments. Given the recent development
of embedded systems and signal processing techniques, it is now practical to implement these sophisticated algorithms in real-time embedded systems for online EEG monitoring and/or BCI. This study details the design and testing of a near real-time embedded BCI featuring window-based ICA and spectral analysis for continuously monitoring cognitive states of participants performing realistic driving tasks in a virtual reality-based dynamic driving environment.
1.3
Motivation
The BCI system, which allows acquiring and analyzing brain activities with the goal of establishing a reliable communication channel directly between the brain and an external device, is composed of sensors and signal processing components. In a practical BCI system, it is important to extract significant features of preprocessing recorded data and then to develop fast and reliable signal processing.
online artifact correction, feature extraction, and pattern recognition are essential to advance the BCI technology so as to be practical for real-world applications. The BCI system should also be a convenient size, light weighted, and have low power consumption to meet the requirements of wearability, portability, and durability. This thesis proposes and implements a moving-windowed Independent Component Analysis (ICA) on a battery-powered, miniature, embedded BCI.
1.4
Organization of Thesis
implemented in this thesis, which including Independent Component Analysis and power spectrum analysis. In Chapter3, it will introduce how to implement a wireless portable EEG signal acquisition in hardware design. In Chapter 4, it will explain the detail of ICA algorithm and how to accomplish the real-time ICA (Independent Component Analysis) signal processing; then the method of real-time ICA will be verified with test pattern and real EEG signal, the procedures and results of verification will be described in Chapter 5. Finally it will have conclusion in Chapter 6.
2
Chapter 2 Material and Method
2.1
Introduction
The purpose of this research is to implement the algorithm of independent component analysis for real-time processing applied on Electroencephalography signal analysis. In order to do this, it needs some database to test the practicability of algorithm; so it was divided into two parts to introduce in this chapter. One is how do we to get the data for signal processing in experimental environment, and the other is what kind of algorithm will be applied on the data processing system. The diagram of overview system was shown as Fig. 2-1.
Fig. 2-1: Diagram of Wireless Brain Computer Interface
2.2
Material
2.2.1
Electroencephalogram
Electroencephalography (EEG) is the measurement of electrical
activity produced by the brain as recorded from electrodes placed on the scalp. When measuring from the scalps, recorded the EEG signal is about 10-100uV for a typical adult human. And a common system reference electrode is connected to the other input of each different amplifier. These amplifiers amplify the voltage between the active electrode and the reference (typically 1,000–100,000 times, or 60–100 dB of voltage gain). The EEG is typically described in terms of rhythmic activity and transients. The rhythmic activity is divided into bands by frequency. The common band of EEG is shown as Table. 1.
Table 1 : Common band of EEG
Type Frequency (Hz) Delta Up to 3Hz
Theta 4 – 7Hz Alpha 8 – 13Hz
Beta 13 - 30Hz
2.2.2
EEG signal acquisition
An electrode cap was mounted on the subject’s head for signal acquisition as shown in Fig. 2-2. A standard for the placement of EEG electrodes proposed by Jasper in 1958, which is known as the 10-20 International System of Electrode Placement [31] is used in the electrode cap. An illustration of the 10-20 system is shown in Fig. 2-2, the electrodes are named according to the location of an electrode and the underlying area of cerebral cortex
A B
Fig. 2-2: Schematic pictures showed the lateral (A) and top view (B) of international 10-20 system of electrode placement [31].
The letters F, C, T, P, and O were refer to the frontal, central, temporal, parietal, and occipital cortical regions on the scalp, respectively. The term “10-20” means 10% and 20% of the total distance between specified skull locations. The percentage-based system allowed differences in skull locations. The physiological data acquisition used 30 sintered Ag/AgCl EEG/EOG electrodes with a unipolar reference at right earlobe.
The 34 electrodes including 34 EEG channels , and one 8-bit digital signal produced form VR scene were simultaneously recorded by the Scan NuAmps Express system (Compumedics Ltd., VIC, Australia) shown in Fig. 2-3. It was a high-quality 40-channel digital EEG amplifier capable of 32-bit precision sampled at 1000 Hz. Table 2 showed the specifications of the NuAmps amplifier. Before acquiring EEG data, the contact impedance between EEG electrodes and skin was calibrated to be less than 5kΩ by injecting NaCl based conductive gel. The EEG data were recorded with 16-bit quantization levels at a sampling rate of 500
Hz in this study. All EEG data were preprocessed using a low-pass filter with a cut-off frequency of 50 Hz in order to remove the power line noise and other high-frequency noise. Similarly, a high-pass filter with a cut-off frequency at 0.5 Hz was applied to remove baseline drifts.
Fig. 2-3: Photo showed the setup of the physiological recording containing the NuAmps EEG amplifier and the electrode cap.
2.3
Methods of Data Analysis
2.3.1
Independent Component Analysis
Independent component analysis (ICA) is a case of blind source separation, that is, we assume the signals may be mutually statistically
Table 2: Specifications of NuAmps
Analog inputs 40 unipolar (bipolar derivations can be computed)
Sampling frequencies 125, 250, 500, 1000 Hz per channel Input Range ±130mV
Input Impedance Not less than 80 MOhm
independent or de-correlated. The goal of ICA is to separate signals (components) from a set of mixed signals without the aid of information (or with very little information) from natural sources. It is a computational method for separating a multivariate signal into additive subcomponents supposing the mutual statistical independence of the non-Gaussian source signals. A familiar case of ICA is the “cocktail party problem”, where the underlying speech signals are separated from a sample data consisting of people talking simultaneously in a room. Usually the problem is simplified by assuming no time delays and echoes. An important note has been considered that if N sources are present, at least N observations (i.e. microphones) are needed to get the original signals. Fig. 2-4 shows that we have N sources and mix them with a mixing matrix to get observed signals.
Fig. 2-4: N mixed signals and N sources
Its linear equation is represented in equation 2-1, where A is described in equation 2-2. Where the s is unknown independent component or the element, and a is unknown mixing coefficient. The expression of Fig. 2-4 can be rewritten as equation 2-3, where the S is sources, and X is observed signals. This is called ICA model. After the
signal separation with ICA, the mixing matrix will be estimated; its inverse matrix is call un-mixing matrix as described in equation 2-4. Hence the original sources can be obtained via equation 2-5.
x1 = a11s1+ a12s2 + …+ a1n-1sn-1 + a1nsn (2-1) x2 = a21s1+ a22s2 + …+ a2n-1sn-1 + a2nsn . . xn-1 = an-1,1s1+ an-1,2s2 + …+ an-1,n-1sn-1 + an-1,nsn xn = an,1s1+ an,2s2 + …+ an,n-1sn-1 + an,nsn A = ⎥ ⎥ ⎥ ⎥ ⎥ ⎥ ⎦ ⎤ ⎢ ⎢ ⎢ ⎢ ⎢ ⎢ ⎣ ⎡ − − − − − − − − n n n n n n n n n n n n n n n n a a a a a a a a a a a a a a a a , 1 , 2 , 1 , , 1 1 , 1 2 , 1 1 , 1 , 2 1 , 2 22 21 , 1 1 , 1 12 11 M M L M M (2-2) X = AS (2-3) W = A-1 (2-4) A-1 X = A-1AS Æ S = W X (2-5)
One approach with some information on the statistical properties of the signal S is to use to estimate A and to find solution of equation 2-5. The statistical method finds the independent components (aka factors, latent variables or sources) by maximizing the statistical independence of the estimated components. Non-Gaussianity is motivated by the central
limit theorem, is one method for measuring the independence of the components with kurtosis or approximations of negentropy. Mutual information is another popular criterion for measuring statistical independence of signals. The kurtosis of y is classically defined by
kurt(y) = E{y4} – 3(E{y2})2 (2-6)
We assume that y is of unit variance, the equation can be simplified to E{y4} – 3. For a Gaussian y, the E{y4} equals 3(E{y2})2 . Thus, kurtosis is zero for a Gaussian random variables, kurtosis is nonzero for non-Gaussian random variables. Kurtosis can be negative and positive. Random variables that have a negative kurtosis are called sub Gaussian, and those with positive kurtosis are called super Gaussian. Super Gaussian has a spiky probability density function with heavy tail. For example, brain waves are super Gaussian variables while sinusoid and cosine waves are sub Gaussian variables.
Fig. 2-5: Typical super Gaussian variables is spiky. For comparison, the normal Gaussian is given by a dashed line. The other is sub Gaussian.
A second important measure of non-Gaussianity is given by negentropy. Negentropy is based on the information-theoretic quantity of entropy. Entropy H is defined for a discrete random variable Y as
H(Y) = -
∑
P(Y = ai)logP(Y = ai) (2-7)where ai are the possible values of Y. The differential entropy is
defined as
H(y) = -∫f(y)logf(y)dy (2-8)
Another often used version is called negentropy. Negentropy J is defined as follows
J(y) = H(ygauss) – H(y) (2-9)
The J can be simplified as equation 2-10 or 2-11.
J(y) 12 1 ≈ E{y3}2+ 48 1 kurt(y) 2 (2-10) J(y)
∑
= ≈P i 1 ki[E{Gi(y)}-E{Gi(v)}]2 (2-11)where ki are some positive constants, and v is a Gaussian variable of
zero mean and unit variance. G as common used is showed by equation 2-12, 2-13 and 2-14.
G1(u) = 1 1 a logcosha1u (2-12) G2(u) = -exp(-u2/2) (2-13) G3 = tanh(a1u), (2-14)
where 1≤ a1 ≤2 is some suitable constant.
Typical algorithms for ICA use centering, whitening and dimensionality reduction as preprocessing steps in order to simplify and reduce the complexity of the problem for the actual iterative algorithm. Without loss of generality, we can assume that both the mixture variables and the independent components have zero mean: If this is not true, then the observed signals can always be centered by subtracting the sample mean, which makes the model zero-mean. Whitening and dimension reduction can be achieved with principal component analysis or singular value decomposition. Whitening ensures that all dimensions are treated equally a priori before the algorithm is run. Algorithms for ICA include Infomax, FastICA and JADE, but there are many others also.
Most ICA methods are not able to extract the actual number of source signals, the order of neither the source signals, nor the signs or the scales of the sources. ICA is important to blind signal separation and has many practical applications. It is closely related to (or even a special case of) the search for a factorial code of the data, i.e., a new vector-valued representation of each data vector such that it gets uniquely encoded by
the resulting code vector (loss-free coding), but the code components are statistically independent.
2.3.2 Power Spectrum Analysis
Analysis of changes in spectral power and phase can characterize the perturbations in the oscillatory dynamics of ongoing EEG. Applying such measures to the activity time courses of separated independent component sources can avoid the confounds caused by misallocation of positive and negative potentials from different sources to the recording electrodes, and by misallocation to the recording electrodes activity that originates in various and commonly distant cortical sources. The spectral analysis for each ICA component decomposed from multi-channel of the EEG signals.
The time-frequency analysis, or alternatively short-time Fourier transform (STFT), which is a Fourier-related transform used to determine the sinusoidal frequency and phase content of local sections of a signal as it changes over time. The FFT processes for each ICA component data decomposed from multi-channel of the EEG signals and the processes are described as following Fig. 2-6.
Fig. 2-6 shows the diagram of moving-average power spectral analysis [32] for a Each 32-point window was extended to 64 points by zero-padding to calculate its power spectrum by using a 64-point fast Fourier transform (FFT), resulting in power-spectrum density estimation with a frequency resolution near 1 Hz. Then we averaged the power spectrum of all the subepochs within each epoch. Previous studies [33]
[34] show that the transient amplitudes of EEG power spectrum involved in wake-sleep regulation are very different. The cortex produces low amplitude and fast oscillations during waking, and generates high-amplitude, slow cortical oscillations during the onset of sleep. Their reports also showed that the EEG spectral amplitudes correlated with the wake-sleep transition more linearly in the logarithmic scale than in the linear scale. The previous study [35] based on the same task and empirical results also confirm this phenomenon. Therefore, the averaged power spectrum of each epoch was normalized to logarithmic scale to linearize these multiplicative effects. The resultant power-spectrum time series of single ICA component consisted 25 frequency bins (from 0.98 to 39.1 Hz) stepping at 2 seconds time intervals.
3
Chapter 3
Hardware Frameworks of
Portable Data Acquisition
3.1
Introduction
In our experimental environment, a portable acquisition system is used to record EEG signals of human and to transmit the data to PC via Bluetooth wireless(Fig. 3-1). The hardware framework of portable data acquisition is divided into four parts as (1) four-channel front-end circuits, (2) analog to digital converter, (3) digital controller, and (4) wireless transmission to achieve the portability and facility.
Fig. 3-1: Diagram of wireless and portable module
3.2
Portable Data Acquisition System
The portable data acquiring system has been used to demonstrate the feasibility of building the BCI system. The functions of the BCI system include amplifier, filter, analog-to-digital converter, wireless controller, and data encoding. The total gain is about 5000 times and the bandwidth is 1~50Hz in this system, which depend on the feature of EEG signal,
EEG Signal
resolution of analog-to-digital converter and the range of operating voltage. The diagram of the portable front-end circuit system is shown as Fig. 3-2 and Fig. 3-3 shows the demo board of portable data acquisition system.
Fig. 3-2: Diagram of portable front-end system
Fig. 3-3: Photo of portable front-end system
3.2.1 Four-Channel Front-End Circuits
The function of this front-end system in the analog part is to amply the EEG signal which can be converted to digital signal operatively. So the gain of this system is set to 5,000 times. First, the EEG signal was operated by Instrumental Amplifier which is regarded as preamplifier, and the output signal is operated by two operational amplifiers which are regarded as band-pass filter, finally, the EEG signal is operated by an operational amplifier which is regarded as gain amplifier.
a. Preamplifier:
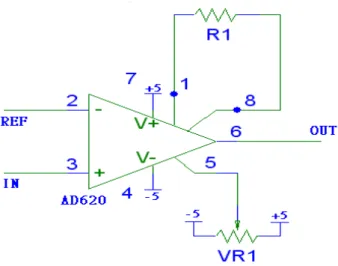
Instrumental Amplifier (IA) is a differential amplifier and which has a high common-mode rejection ratio (CMRR). A high CMRR is important in applications where the signal of interest is represented by a small voltage fluctuation superimposed on a (possibly large) voltage offset, or when relevant information is contained in the voltage difference between two signals. Thus, AD620 is chosen as the Instrumental amplifier, and it also can provide the function of gain. The IA circuit design is shown in Fig. 3-4. The R1 decides the gain of preamplifier, and the gain is set to 10 times.
Fig. 3-4: Circuits of preamplifier b. Band-Pass Filter
In this thesis, it designs to use two operational amplifiers to achieve the function of band-pass filter, and OPA4137 was chosen to be the amplifier. OPA4137 can be supplied by single (+4.5V to +36V) or dual (±2.25 to ±18V) power. In the high-pass filter, the cutoff frequency is 1Hz and was decided by passive components R2, R3, C1
and C2, and the 3dB cutoff frequency 2 3 1 2 1 2 L f R R C C π = .
Fig. 3-5: High-pass filter circuits
For a band-pass filter, the low-pass filter is designed as shown in Fig. 3-6. The passive components R7, R8, C3, and C4 decide the 3dB cutoff frequency 7 8 3 4 1 2 H f R R C C π
= and thinking about the effect of AC 60Hz and the frequency range of EEG signals which this research want to observe, the 3dB cutoff frequency is set to be 50Hz. It combines the high-pass and low-pass filter to be a band-pass filter, and their simulation results of circuits are shown as Fig. 3-7
Fig. 3-7: Simulation results of band-pass filter c. Gain Amplifier
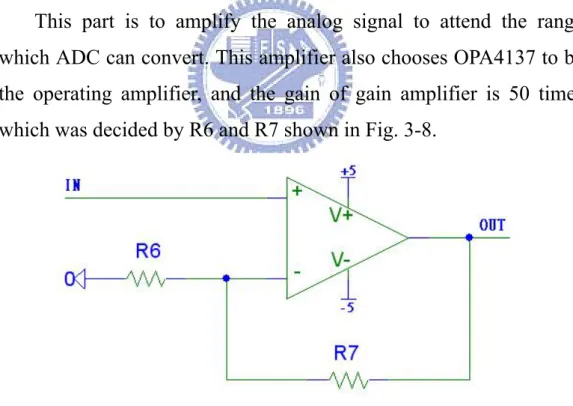
This part is to amplify the analog signal to attend the range which ADC can convert. This amplifier also chooses OPA4137 to be the operating amplifier, and the gain of gain amplifier is 50 times which was decided by R6 and R7 shown in Fig. 3-8.
Fig. 3-8: Circuits of gain amplifier -3dB
46.895Hz 1.000Hz
Fig. 3-9: Analog acquisition module
3.2.2 Analog to Digital Converter
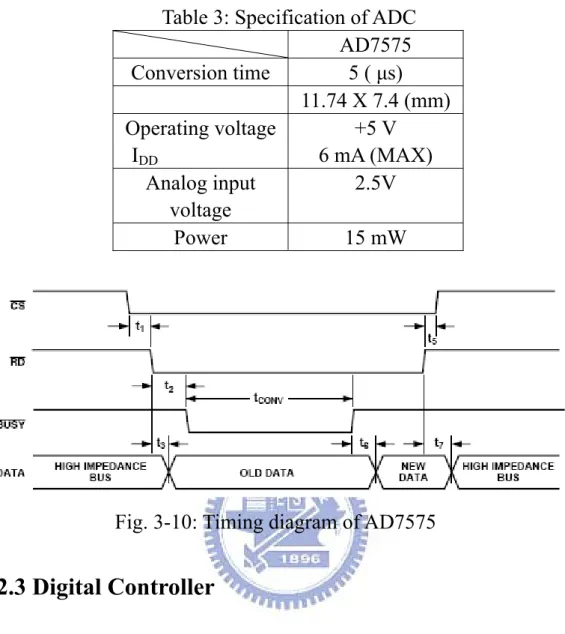
In this system, by passing the signal through wireless, it needs an analog to digital converter to convert the continuous signal to discrete number. To suit with the filtered and amplified signal from front-end circuit, AD7575 was chosen to be an ADC converter on this data acquisition system. The AD7575 is a high speed 8-bit ADC with a built-in track/hold functions. The successive approximation conversion technique is used to achieve a fast conversion time of 5 ms, while the built-in track/hold allows full-scale signals up to 50 kHz (386 mV/ms slew rate) to be digitized, the specification of AD7575 is shown as Table 3. The AD7575 is designed for easy interfacing to all popular 8-bit microprocessors using standard microprocessor control signals (CS and RD) to control starting of the conversion and reading of the data. It provides two kinds of fast digital interface to allow the AD7575 to interface easily to the fast versions of most microprocessors. The interface timing diagram used in this thesis is shown as Fig. 3-10.
Table 3: Specification of ADC AD7575 Conversion time 5 ( μs) 11.74 X 7.4 (mm) Operating voltage IDD +5 V 6 mA (MAX) Analog input voltage 2.5V Power 15 mW
Fig. 3-10: Timing diagram of AD7575
3.2.3 Digital Controller
For the data acquisition system, it needs a controller to organize the working of ADC and encode the digital data to wireless transmission which received from ADC. Complex Programmable Logic Device (CPLD) was a programmable logic device with complexity between that of PALs and FPGAs. The building block of a CPLD is the macro cell, which contains logic implementing disjunctive normal form equations and more specialized logic operations. In this research, EPM7128STC100-7 [36] which is a product of ALTERA was selected as the main controller of this system. It provides high-performance, EEPROM-based programmable logic devices (PLDs) based on
second-generation MAX® architecture. It has Built-in JTAG boundary-scan test (BST) circuitry with 128 macro cells. Complete EPLD family with logic densities 2,500 usable gates. EPM7128STC100-7 can supply 5ns pin-to-pin logic delays with up to 175.4MHz counter frequencies (including interconnect) and PCI-compliant devices.
Fig. 3-11: Digital controller
3.3
Wireless Transmission
For a portable device, wireless communication is an important issue to resolve great inconvenience of using with wire transmission. Bluetooth is a wireless protocol utilizing short-range communication technology to facilitate data transmission over short distances from fixed and/or mobile devices. The intent behind the development of Bluetooth was the creation of a single digital wireless protocol, capable of connecting multiple devices and overcoming issues arising from synchronization of these devices. This thesis chooses BM0203 to be Bluetooth module; BM0203 is an integrated Bluetooth module to ease the design gap and uses CSR BuleCore4-External [37] as the major Bluetooth chip. CSR BlueCore4-External is a single chip radio and baseband IC for Bluetooth
2.4GHz systems including enhanced data rates (EDR) to 3Mbps. It interfaces to 8Mbit of external Flash memory. When used with the CSR Bluetooth software stack, it provides a fully compliant Bluetooth system to v2.0 of the specification for data and voice communications. All hardware and device firmware of BM0203 is fully compliant with the Bluetooth v2.0+EDR specification.
Fig. 3-12: Photo of Bluetooth Module
3.4
Data Processing Platform
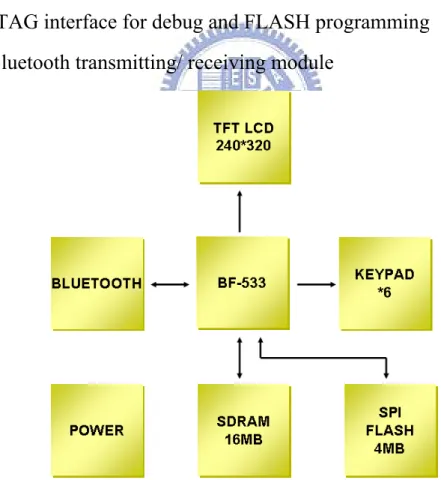
In this data processing platform, the selected core processor is ADSP-BF533 (Blackfin 533) developed by Analog Devices Inc. [38]. The system diagram of the board we designed is shown in Fig. 3-13 and the photo of the board is shown in Fig. 3-14. The Blackfin processor provides both microcontroller (MCU) and DSP functionality in a unified architecture, allowing flexible partitioning between the needs of control and signal processing. If the application demands, the Blackfin processor can act as 100% MCU (with code density on par with industry standards), 100% DSP (with clock rates at the leading edge of DSP technology), or a combination of the two. The maximum high performance of BF533 processor can be up to 500MHz. It has two 16-bit MACs, two 40-bit
ALUs, four 8-bit video ALUs, and 40-bit shifter. One of its features is RISC-like register and instruction model for ease of programming and compiler-friendly support. The board is designed to support the development and porting of open-source μClinux applications and includes the full complement of memory along with serial and network interfaces. Besides an ADSP-BF533 500 MHz Blackfin processor, the board includes:
16 MB SDRAM (64M x 16 bits) and 4 MB FLASH memory: RS-232 serial interface
6 Keypads and 240*320 pixels LCD
JTAG interface for debug and FLASH programming Bluetooth transmitting/ receiving module
Fig. 3-13: System diagram of the board
4
Chapter 4
Real-Time ICA Signal Processing
4.1
Introduction
In this chapter, it was to describe why EEG signals use ICA, what kind of ICA was implemented, and how to approach real-time and window-based signal process on the EEG-based BCI system (Fig. 4-1). First, checking if window-based ICA method is correct is needed and at the same time makes sure window-based ICA does achieve real-time.
For the real-time ICA implementation, both the iteration and the convergence tolerance of training weights have to be limited through the following methods. Finally, it will obtain the execution time and iteration running on DSP, and the information of execution time and iteration will help to find out the boundary of setting in real-time operation.
Fig. 4-1: Diagram of wireless signal processing
4.2
EEG Data for ICA
It considers electrical recordings of brain activity as given by an electroencephalogram (EEG). The EEG data recorded by electrical
Window-based and Real-time Signal
potentials on the scalp consists of many signals in different locations. These signals are presumably generated by mixing some underlying components of brain activity, so if want to monitor the physiology state of subject, the corresponding component will be found (Fig. 4-2). This situation is similar to the cocktail-party problem: If there are some microphones were put around the place, and the voice which was recorded by microphones will be the mixed signal which maybe mix with the conversation of people, jazz music and so on. So the observed signal from microphone is like to the EEG signal recorded by electrode, and the target was to separate the observed signal into several independent components, such as conversation, music and so on in the cocktail-party; and component in the brain which have physiology pattern, such as the reaction of visual stimulus, sensorymotor stimulus, drowsiness and attention focus. In order to find out the original components of brain activity, ICA can resolve the problem of blind source separation, and can also reveal interesting information on brain activity by its independent components.
As shown in Fig. 4-3 the brain activity recorded at one electrode on the scalp is the mixture of electrical potentials from many different locations in the brain.
Fig. 4-2: Functions of brain’s area
Cocktail Party
Fig. 4-3: EEG signal was recorded at one point which is a mixed signal
CSF
4.3
Information Maximization ICA
Information Maximization ICA is also called Infomax ICA. Information maximization theory is an optimization principle for neural networks and other information processing systems. First, Jeanny Herault and Christian Jutten [39] proposed a feedback architecture for independent component analysis from neural network in 1986, and ICA was most clearly stated by Pierre Comon [24] in 1994. Infomax-based ICA was described by Bell and Sejnowski [40] in 1995, they derived a new self-organizing learning algorithm that maximizes the information transferred in a network of nonlinear units. The algorithm does not assume any knowledge of the input distributions, and is defined here for the zero-noise limit.
Single layer feed-forward neural network in Fig. 4-4, was proposed by Bell and Sejnowski [40] to learn the separating matrix W by minimizing the mutual information between components of y(t)=g(u(t)), where g is a nonlinear function approximating the cumulative density function (CDF) of the sources. They formulated blind source separation algorithms in terms of information maximization.
Fig. 4-4: Blind separation network for two-source mixtures.
that the output y of a neural network processor and with its input vector x. This is shown as
]
|
[
]
[
]
,
[
x
y
H
y
H
y
x
I
=
−
(4-1) Where H[y] is the entropy of equation 4-2 can be differentiated as follows, with respect to a parameter, w, involved in the mapping from x to y:) ( ) , ( H y w x y I w ∂ ∂ = ∂ ∂ . (4-2) The joint entropy of the outputs is
)]
(
[ln
|]
|
[ln
)]
(
[ln
)
(
y
E
P
y
E
J
E
P
x
H
=
−
=
−
(4-3) Weights can be adjusted to maximize H(y). As before, they only affect theE[ln |J|] term above:
∏
= ∂ ∂ + ∂ ∂ = ∂ ∂ = ∂ ∂ Δ n i i y W W W J W W y H W 1 ' | | ln | det | ln | | ln ) (α
(4-4)The resulting learning rules are familiar in equation 4-5.
T T
x
y
W
W
∝
[
]
1+
(
1
−
2
)
Δ
− (4-5) But this learning rule is too complex to calculate because of the inverse matrix. Multiplied by WTW change the rescale of the rule, the new learning rules as follow:
W u u I W u y I W = ( +(1−2 ) T ) = ( +
ϕ
( ) T ) Δ (4-6)Thus, the simplification much uncomplicated than before, and this learning rule is suitable to separate blind sources. The update rule for W
in discrete time t ← t+1 defined in equation as follows:
W
l
t
W
t
W
(
+
1
)
=
(
)
+
Δ
. (4-7) The flowchart of Infomax ICA is shown asFig. 4-5. Centering the data can simplify the ICA algorithm, and the mean can be added back to the data. Whitening means that we remove any correlations in the data, i.e. the different channels are forced to be uncorrelated. Then initialize the weight, and after random permutation, find the maximization entropy output. If the weight change is smaller than the desired weight change then the training is stopped.
Centering
Whitening
Initialize weight
Random permutation of data
Apply weight change
Weight converged? ICA components N Y Start End Centering Whitening Initialize weight
Random permutation of data
Apply weight change
Weight converged? ICA components N Y Start End
4.4
Real-Time Signal Processing
4.4.1 Window-Based ICA
Real-time signal processing is convenient to embedded BCI system; it makes the system to give some information in time. For common use of ICA in signal processing, it gathers a period of data, from several minutes even to an hour to get ICA components. In that way, it shows the system can not get instant results. And this type of using wastes the time, the quantity of data was too large to real time process. The more data to run ICA, the more time will the processor execute. So the window-based and real-time ICA processing was proposed; it will improve the facility and efficiency of portable embedded BCI system.
For window-based signal processing, it uses a concept of window and overlap on ICA algorithm to shorten the execution time in one time of ICA algorithm running on embedded BCI system, and keeps the previous information in present ICA training that will make ICA components still hold on the order. There are more data to execute with ICA algorithm, it takes more time to get ICA components; but if there is less data, it would not decompose the observed signal well to get clear source. So the time length of ICA window is set to five seconds, the time length of overlapping is three seconds, in this manner, every two seconds will get ICA components on time. Fig. 4-6 displays the different of window-based and common-use ICA method (which is called offline ICA in this thesis).
Fig. 4-6: Method of window-based and offline ICA
4.4.2 Verification of Window-Based ICA
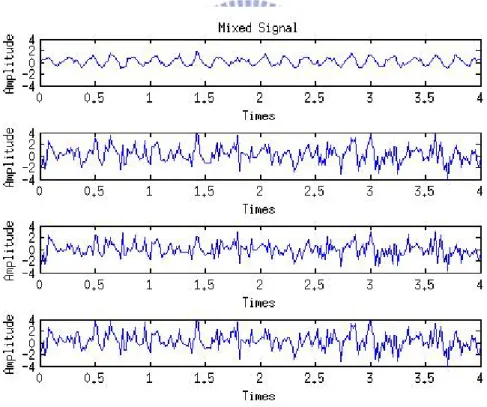
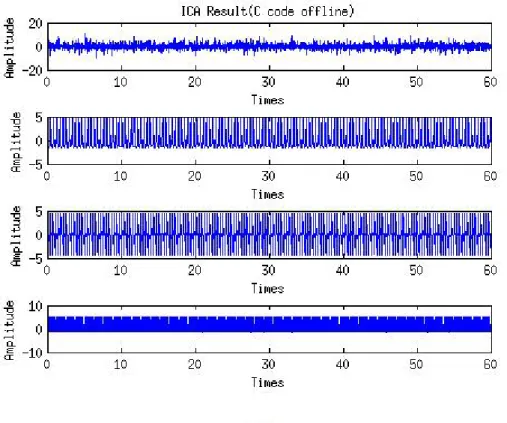
To verify the method proposed in this thesis, it uses four mixed signals which randomly mixed three super-Gaussian signal and one random signal. Fig. 4-7 shows the original signal for verification of window-based ICA. The four random mixed signals were displayed on Fig. 4-8. The sample rate of these mixed and original signals is 64Hz, and the total time length of them is 1 minute. These mixed signals are the input of ICA algorithm which was separately executed on a PC platform using an offline method and a window-based method; and on an embedded BCI system platform using window-based method. Fig. 4-10, Fig. 4-12 and Fig. 4-14 show the ICA components obtained from the PC platform, offline and window-based, and from the DSP platform with window-based, respectively. In the figures it also shows the corresponding power spectrum to ICA components. And the total length of ICA components is displayed in Fig. 4-9, Fig. 4-11 and Fig. 4-13, respectively.
Data
ICA (Window: 5s , Overlap :3s) Times
…...
ICA Times Data Offline Window -BasedEvery 2s updates ICA result 2s
5s 3s
Fig. 4-7: Original signals for ICA verification
Fig. 4-9: Result of offline ICA component performed on PC platform
Fig. 4-10: Result of offline ICA component and spectrum performed on PC platform.
Fig. 4-11: Result of window-based ICA component performed on PC platform.
Fig. 4-12: Result of window-based ICA component and spectrum performed on PC platform.
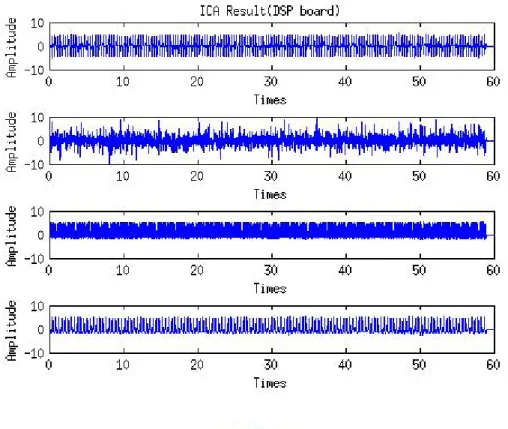
Fig. 4-13: Result of window-based ICA component performed on DSP platform
Fig. 4-14: Result of window-based ICA component and spectrum performed on DSP platform
Table 4 : Correlation table of window-based and offline ICA Correlation Different type Different platform
platform PC PC and DSP
Type window-based and offline window-based
Domain Time Frequency Time
Component 1(red) 0.1621 0.9632 0.8761 Component 2(pink) -0.0769 0.9799 0.9998 Component 3(green) -0.2791 0.999 0.9995 Component 4(yellow) 0.5746 0.9536 0.9998
For window-based ICA, the window concept is applied and that is different with offline ICA. The results of ICA components will not change in offline ICA (Fig. 4-9), because it only has one window to process. But also in window-based ICA, the ICA components will not change each other by the window updated (Fig. 4-11 and Fig. 4-13).
The verification of window-based ICA and offline ICA is in the same platform, there is not high correlation between window-based ICA and offline ICA running on the PC platform in time domain (Table 4), but in the Fig. 4-10 and Fig. 4-12, it shows that property of signal is decomposed and it is easy to identify the four signals, and the responding correlations are above 95% in frequency domain (Table 4). Because of cutting the window and fewer information of data, it makes the component have a negative sign different between window-based and offline processing. The figures also exhibit the corresponding power spectrum to ICA components, it presents that they have similarity
between their spectrum analysis of window-based and offline ICA running in PC platform. On the comparison of different platform, the result of ICA components has high correlation, their property was decomposed, and their spectrum analyses are almost the same. No matter window-based ICA running on the PC platform or DSP platform, the correlation of ICA components are high to 87%. Regardless of window-based and offline ICA processing on both platform, the ICA components will be identified clearly and the property of power spectrum is changeless. So this window-based ICA method will be applied on an embedded BCI system and it also will obtain good ICA components.
4.4.3 Real-Time ICA
Due to the window-based ICA was accomplished for an embedded BCI system, the next concern problem was execution time, whether the ICA algorithm can be run in the limited time to get ICA components. Table 5 shows that the execution time on the embedded BCI system with DSP in once ICA training loop is 10.275 seconds, and it means that DSP would not finish the ICA training inside two seconds.
Table 5 : Comparison of execution time
DSP(BF533) ARM[52] ARM and DSP[52]
CPU 528MHz 168Hz ARM:168MHz
DSP:192MHz ICA version Infomax ICA Fast ICA Fast ICA
Channel 4 2 2
Test Signal 4 super-Gaussian Super-Gaussian & random signal
As Left
Sample Rate 64 - -
Length 5s - -
Total Data Length 1280 points 256 points 256 points
Processing Time 10.275s 29.548805s 2.297103s
To get window-based ICA components in real-time operation, the training flow of Infomax ICA algorithm (Fig. 4-5) was reviewed; considering changeless of ICA algorithm for precise ICA components, the executed iteration and the convergence tolerance of the training loop can be limited. First, the condition of convergence tolerance was limited. In the ICA training loop, this thesis sets up three settings, and make them run on DSP to get their execution time for real-time operation. Fig. 4-15 shows the three setting, the setting 1 is normal setting, which means that the setting was the same with above simulation which was descried in 4.4.2. And the weight error tolerance of setting 2 and 3 is set as shown in Fig. 4-15. To do this, every setting will obtain the execution time and iteration running on DSP, the information of execution time and iteration will help to find out the boundary of setting in real-time operation.
Window-based ICA Simulated Data
(3 super-Gaussian & 1 random signal)
Result & Time
(Compare 3 Settings)
Window-based ICA
Setting 1 Setting 2 Setting 3 Weight error tolerance 0.00002 (normal) 0.0002 0.002 Window-based ICA
Setting 1 Setting 2 Setting 3 Weight error
tolerance
0.00002 (normal)
0.0002 0.002
Set up the weight error-tolerance to stop learning
Fig. 4-15: window-based ICA setting for real-time processing
4.4.4 Verification of Real-Time ICA
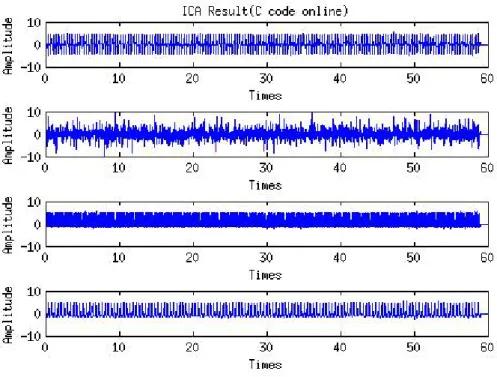
For testing the three window-based ICA settings, the test pattern as previously shown in Fig. 4-8 and EEG signal are used to obtain their ICA components. The sample rate of data is also 64Hz and the total data length is 1 minute. This thesis regards Setting 1 as the control group, and Setting 2 and 3 as the experimental groups, and the variation was error tolerance of convergence (Fig. 4-15). The result of ICA components which work on DSP were shown from Fig. 4-16 to Fig. 4-19. In the figures, the pink line represents Setting 1, and the blue line represents Setting 2 (Fig. 4-16、Fig. 4-18) and 3 (Fig. 4-17、Fig. 4-19), respectively.
Fig. 4-16 and Fig. 4-17 illustrate the total ICA components of one minute. Fig. 4-18 and Fig. 4-19 display ICA components of six seconds and corresponding spectrum to ICA component of total length. The testing results of EEG signals are shown as Fig. 4-20 and Fig. 4-21.
In the situation of weight error tolerance limited, the ICA components will not change each other by the time passed in Setting 2
and 3 (Fig. 4-16 and Fig. 4-17). In the Table 6, there are 3 ICA components which were obtained from Setting 2 is similar with that which were obtained from Setting 1; their correlations are up to 87% in time domain. In Setting 3, the correlation of 2 ICA components is up to 93.7% in time domain.
Fig. 4-16: Result of window-based ICA Components performed on DSP (Setting 1 shown as the red line and Setting 2 shown as the blue one)
Fig. 4-17: Result of window-based ICA Components performed on DSP (Setting 1 shown as the red line and Setting 3 shown as the blue one)
Table 6 : Correlation table of window-based ICA in time domain Correlation with Setting 1 Setting 2 Setting 3 Platform DSP Type Window-based Domain Time Component 1(red) 0.5481 0.5343 Component 2(purple) 0.8717 0.5765 Component 3(green) 0.9839 0.9397 Component 4(yellow) 0.9952 0.9801
And the corresponding spectrum analysis of Setting 2 and 3 are almost the same as that of Setting 1 (Fig. 4-18 and Fig. 4-19). In frequency domain (Table 7), the correlations of 4 ICA components are up to 90.4% in Setting 3 and setting 2.
Fig. 4-18: Results of window-based ICA Components performed on DSP: (left) 4-channel ICA components and (right) corresponding spectrum of
Setting 1 (red line) and 2 (blue one).
Fig. 4-19: Result of window-based ICA Components performed on DSP: (left) 4-channel ICA components and (right) corresponding spectrum of
Table 7 : Correlation table of window-based ICA in frequency domain Correlation with Setting 1 Setting 2 Setting 3 Platform DSP Type Window-based Domain Frequency Component 1(red) 0.9987 0.9955 Component 2(purple) 0.9909 0.9579 Component 3(green) 0.9674 0.9049 Component 4(yellow) 0.9964 0.9871
Fig. 4-20: EEG signal results of window-based ICA Components use performed on DSP (Setting 1 shown as the red line and Setting 2 shown
Fig. 4-21: EEG signal Results of window-based ICA Components use performed on DSP (Setting 1 shown as the red line and Setting 3 showed
as the blue one)
For executing time and iteration, three testing setting of window-based ICA are tested by two kinds of signals (Test pattern and EEG). The Setting 2 and Setting 3 also give good result of ICA component as above, and then how long will they operate on DSP is concerned. The results of test pattern is the same with above (Fig. 4-8), and the testing result to the two types of signals is shown in Table 8. From Table 8, it is found that there is no difference between test pattern and EEG in execution time and iteration.
Table 8 : Execution time of once window-based ICA window-based ICA Setting 1 Setting 2 Setting 3
Average Time 10.275s 3.782s 0.7s Test pattern (1 min) Platform :DSP Average Iterations 47 18.7 3 Average Time 8.7798s 3.2896s 0.7654s EEG signal (1 min) Platform :DSP Average Iterations 48.8571 17.89 3.6429
Finally, to achieve window-based and real-time ICA processing, in this condition of the five iterations limited, the average execution time was 1.06 seconds which is under two seconds. So the variables to control the executing time and performance of ICA components were that the restricted iteration is five steps and the weight error tolerance is 0.0002 which is the same as Setting 2. The result is shown in Fig. 4-22, and Table 9 shows the correlation result in time domain and frequency domain. The correlation between normal setting (Setting 1) and final setting in time domain, there are the 2 ICA components up to 94%. And that in frequency domain, there are 4 ICA components up to 91%, it means that after test pattern are processed by real-time window-based ICA; the ICA components still have same property with that was processed by normal ICA.
Fig. 4-22: Result of window-based ICA Components performed on DSP: (left) 4-channel ICA components and (right) corresponding spectrum of
Setting 1 (red line) and final setting (blue one).
Table 9 : Correlation table of final setting for window-based ICA Correlation with Setting 1 Time Domain Frequency Domain
Platform DSP Type Window-based
Iteration Limit 5
Weight Error Tolerance 0.0002 Average Execution Time 1.06s
Component 1(red) 0.5378 0.9963 Component 2(purple) 0.5563 0.9675 Component 3(green) 0.9489 0.9156 Component 4(yellow) 0.9832 0.989
5
Chapter 5 Experiment Results
5.1
Introduction
This thesis uses two settings to test ICA which was proposed in the previous chapter. One is test signal and the other is real EEG signal. The result of test signal was presented in Chapter 4; this chapter will present the result of real EEG signal. There are four subjects who have good drowsiness performance during task experiment to verify that the window-based and real-time ICA applied on this signal procedure, the final result would be similar to that of offline signal procedure on PC platform.
5.2
ICA Verification on EEG Signal
5.2.1 Description of EEG Data
There were three major parts of the architecture: (1) a 3D highway driving scene based on the VR technology, (2) a real vehicle mounted on a 6-DOF motion platform, (3) a physiological signal measurement system with 36-channel EEG/EOG/ECG sensors. The subjects were asked to sit in a real car mounted on the 6-DOF motion platform with their hands holding the steering wheel to control the simulated car in the VR scene.
Subjects participated in a Virtual-Reality (VR)-based highway driving experiment (Fig. 5-1), in which they were instructed to put forth their best effort to keep their lane position. An actual automobile was mounted on a 6- DOF Stewart platform, which provides translational and
rotational movement and vibratory feedback to simulate actual driving conditions. The 360o projection of driving scenery is updated synchronously with deviations caused by wheel/paddle movement by the subjects or by road conditions. Every 3-7 seconds the car was linearly pulled towards the curb or into the opposite lane, with equal probability. Subjects were instructed to compensate for the drift by steering a vehicle wheel. The EEG data were recorded at Fp1, Fpz, Fp2 and midway between Fpz and nasion, referentially against a right-mastoid reference by a Neuroscan amplifier (Fig. 2-3). The EEG data were sent to a PC for further analysis. Driving performance was measured by the distance of lane deviation (Fig. 5-2), which was small when the subject was alert, and vice versa. The driving parameters (lane position and wheel rotation) were in sync with the EEG acquisition system.
Under this experiment, the signal procedure was shown in Fig. 5-3. The final result will show the correlation between the ICA power and subject’s behavior, the red color represent positive correlation and the blue color represent negative correlation. Finally, several subjects have presented that ICA power spectra at theta (4~7Hz) band and/or alpha (8~11 Hz) band are associated with human drowsiness, and the relationship between EEG log power and subject task performance is largely linear.
Fig. 5-1: Overview of surrounded VR scene. The VR-based four-lane highway scenes are projected into surround screen with seven projectors
processing.
Fig. 5-3: Diagram of EEG signal processing
5.2.2 Signal Processing Procedure on Drowsy Estimation
In this experiment, the EEG signals gathered from NuAmps(Fig. 2-3), their sample was 250 Hz. And to implement the window-based and real-time ICA in this case, the sample rate performs on EEG-based BCI was 64 Hz. So it is to prove that the drowsiness phenomenon still exist even the sample rate was from 250 Hz down to 64Hz.
The diagram of the signal processing is shown in Fig. 5-4. The 4-channel EEG data was first recorded via NuAmps. Then change the
Correlation Analysis
Independent Component Analysis
Spectrum Analysis The EEG signal of subject
The behavior of subject
Frequency (Hz)
0
Component
sampling rate to 64Hz. It consists of down sampling, independent component analysis, moving-average spectrum analysis and correlation analysis. The independent component analysis is applied to the down sampled EEG signals to obtain the independent components. The moving-average power spectrum was to calculate the frequency response of ICA components. Finally, the correlation coefficients between the subjects’ driving error and the power spectra of all ICA components at each frequency band were calculated to assess the relationship between subject performance and EEG log spectra.
Fig. 5-4: Diagram of EEG signal processing for verification
5.3
Verification of Real EEG Signals
5.3.1 Down Sampling
There was four subjects participated in a VR(virtual-Reality)-based highway driving experiment. Their EEG data was recorded at Fp1, Fpz,
4 channel EEG data Sample Rate:64Hz
Independent Component Analysis (Window-based, Infomax, 320
points/channel)
Moving-Average Spectrum Analysis ( 64-points Short Time FFT)
The Power of Theta band The behavior of subject For real-time processing:
1. Weight Error-tolerance limit 2. Iteration limit
Fp2 and midway between Fpz and nasion, referentially against a right-mastoid reference by a NuAmps. Their EEG data have good drowsiness phenomenon at sample rate 250Hz, it means that their EEG power spectra at theta (4~7Hz) band, and /or alpha (8~12Hz) band were associated with human drowsiness, and the relationship between EEG power and subject task performance was largely high. Fig. 5-5 illustrates the signal procedure was run with Matlab on PC platform. The correlation results of ICA component power and subject’s behavior were shown in Fig. 5-6-Fig. 5-9. These figures represent the correlation between ICA power and subject’s behavior. The results indicate that it still has good drowsiness phenomenon when the data sample is 64 points per second.
Fig. 5-5: Diagram of offline signal processing procedure
EEG Raw Data ( 250Hz or 64Hz)
ICA (offline)
Moving-Average Spectrum Analysis (Window:3s , Overlap :1s)
Times
Power 1 Power 2 Power 3
…...
2s 3s
Fig. 5-6: Correlation of ICA power and subject’s behavior ( Subject 1). Sample rate (left) is 250Hz and (right) 64Hz.
Fig. 5-7: Correlation of ICA power and subject’s behavior (Subject 2). Sample rate (left) is 250Hz and (right) 64Hz.
Fig. 5-8: Correlation of ICA power and subject’s behavior ( Subject 3). Sample rate (left) is 250Hz and (right) 64Hz.
Fig. 5-9: Correlation of ICA power and subject’s behavior (Subject 4). Sample rate (left) is 250Hz and (right) 64Hz.
5.3.2 Moving-Average Spectrum Analysis
First, the function of moving-average spectrum analysis was verified in different platform, pc and DSP platform. The test signal is 5 Hz sin wave generated by Matlab (Fig. 5-10), which sample rate is 64 Hz and data lengths are 5 minutes. Fig. 5-11 and Fig. 5-12 show the result on PC and DSP platform separately. From the result of moving-average spectrum analysis, there are no differences between the function performed on PC and DSP platform by time passed.
Fig. 5-10: 5Hz signal (64Hz sample rate)
Fig. 5-11: Result of Moving-Average Spectrum Analysis on PC platform (5Hz signal)
Fig. 5-12: Result of Moving-Average Spectrum Analysis on DSP platform (5Hz signal)
5.3.3 Real EEG Signal Result
In this part, the real-time ICA setting (Table 9) will apply on real-time ICA processing (Fig. 5-13) in this drowsiness signal procedure (Fig. 5-4). And the purpose is to verify that the EEG signals processed by real-time ICA, and the results of ICA components will still have drowsiness pattern as same as offline analysis. Fig. 5-14-Fig. 5-17 show that the ICA setting can extract the interesting pattern of drowsiness index, it represents that it will have high correlation with subject’s behavior in theta band (4-7 Hz) or alpha band (8-12 Hz). No matter what kind of drowsy patterns (alpha or theta patterns) will have high correlation with subject’s behavior (Table 10).
Fig. 5-13: Diagram of real-time signal processing procedure
Fig. 5-14: Correlation of ICA power and subject’s behavior (Subject 1)
EEG Raw Data (Sample Rate : 64Hz)
Real –Time ICA (Window: 5 s, Overlap 3s ) : Iteration limit is 5
Tolerance of weight error is 0.002
Moving-Average Spectrum Analysis (Window: 3 secs , Overlap :1 secs)
Times
…...
Power 1 Power 2 Power 3
…...
2s 5s