Review
Enhanced detectability in proteome studies
夽
Supawadee Sriyam
a,b, Supachok Sinchaikul
a, Payungsak Tantipaiboonwong
b,
Ching Tzao
c, Suree Phutrakul
b, Shui-Tein Chen
a,d,∗aInstitute of Biological Chemistry and Genomics Research Center, Academia Sinica, Taipei 11529, Taiwan bDepartment of Chemistry, Faculty of Science, Chiang Mai University, Chiang Mai 50200, Thailand cDivision of Thoracic Surgery, Tri-Service General Hospital, National Defense Medical Center, Taipei 114, Taiwan
dInstitute of Biochemical Sciences, College of Life Science, National Taiwan University, Taipei 10617, Taiwan Received 7 June 2006; accepted 27 October 2006
Available online 30 November 2006
Abstract
The discovery of candidate biomarkers from biological materials coupled with the development of detection methods holds both incredible clinical potential as well as significant challenges. However, the proteomic techniques still provide the low dynamic range of protein detection at lower abundances. This review describes the current development of potential methods to enhance the detection and quantification in proteome studies. It also includes the bioinformatics tools that are helpfully used for data mining of protein ontology. Therefore, we believe that this review provided many proteomic approaches, which would be very potent and useful for proteome studies and for further diagnostic and therapeutic applications.
© 2006 Elsevier B.V. All rights reserved.
Keywords: Proteome; Proteomic analysis; Detection; Limitation; Sample preparation
Contents
1. Introduction . . . 92
2. Limitation and essential factors of proteomic analysis . . . 92
3. Sample preparation . . . 92
3.1. General sample preparation methods . . . 92
3.2. Advanced preparation methods . . . 93
3.2.1. Enrichment of low abundant proteins . . . 93
3.2.2. Removal of carbohydrate moiety . . . 94
3.2.3. Sequential preparation methods . . . 94
4. Proteomic analysis . . . 96
4.1. Protein separations . . . 96
4.1.1. General protein separation: chromatography and electrophoresis . . . 96
4.1.2. Multidimensional proteomic approach . . . 97
4.2. Protein detection and quantification . . . 98
4.3. Protein identification by mass spectrometry . . . 101
5. Bioinformatics tools for data mining . . . 101
5.1. Database search of protein ontology . . . 101
5.2. Development of in-house bioinformatics tools . . . 102
夽 This paper is part of a special volume entitled “Analytical Tools for Proteomics”, guest edited by Erich Heftmann.
∗Corresponding author at: Institute of Biological Chemistry (R707), Academia Sinica, 128 Yen Chiu Yuan Road, Sec. II, Nankang, Taipei 11529, Taiwan. Tel.: +886 2 27855696x7071; fax: +886 2 27883473.
E-mail address:[email protected](S.-T. Chen).
1570-0232/$ – see front matter © 2006 Elsevier B.V. All rights reserved. doi:10.1016/j.jchromb.2006.10.065
6. Conclusion and future perspectives . . . 103 Acknowledgements . . . 103 References . . . 103
1. Introduction
Proteomics defined in its most broad terms is the under-standing of the protein expressed from biological compartments such as cell, tissue, or organisms in term of identification, quan-tify, post-translational modification, protein–protein interaction, sub-cellular localization activities and their biological functions. The complexity of any proteome makes all proteome analysis technically challenging. For example, human serum and plasma proteomes are estimated to be composed of more than 10,000 different proteins at a dynamic range of protein concentration, and most of which would be present at very low relative abun-dances[1,2]. Interestingly, proteomics is entering into the field of biomedicine with declared hopes for the identification of new pathological markers and therapeutic targets [3]. Determina-tion of proteins in either small or large cells requires methods for separation of protein mixtures into their individual compo-nents. Currently, proteomic approaches based on the analysis of protein pattern have emerged that may provide a more effec-tive evaluated profiling protein for diagnostic purposes, such as two-dimensional polyacrylamide gel electrophoresis (2DE)
[4], surface-enhanced laser desorption ionization (SELDI)[5], matrix-assisted laser desorption ionization (MALDI)[6], liquid chromatography (LC) [7], capillary electrophoresis (CE) [8], followed by computational image analysis and protein iden-tification using mass spectrometry [9]. The use of combined proteomic techniques for protein identification is a powerful approach that can give a better understanding about the mech-anism of disease in which proteins play major role [10,11]. Although many powerful techniques for protein separation are used, there are some common problems and limitations in pro-teomic analysis. Herein, the purpose of this review is to describe the proper way to reduce the limitations in proteome studies by improving the appropriate sample preparation method for obtaining the good result and to enhance the detectability and quantification in proteomic research for optimizing the high throughput methodology. We believe that this review may pro-vide a useful guideline and introduce some potent approaches for proteome studies and for the diagnostic and therapeutic appli-cations.
2. Limitation and essential factors of proteomic analysis
Although the proteomic approach using various analytical techniques has been successfully used for protein expression analysis, screening, identification and characterization of pro-tein, some techniques have certain limitations and need to consider the essential factors for solving these problems. Com-position of the proteome and analytical methods are the most of limitations in the proteomic analysis. In fact, each sample contains the vast diversity of proteins, which show different
characteristics and complexation. The sample preparation is the most important factor in the first step of proteomic analysis, in which each sample preparation method can differentially capture the entire proteome for a given biological system. Reliable and effective methods of sample preparation and fractionation pro-cess are the keys to the sucpro-cess of proteomic research. Ineffective steps can lead to loss of valuable samples, time and cost. How-ever, the sample preparation methods can be affected by some essential factors, such as sample extraction, protein solubiliza-tion, protease inhibitors, protein concentrasolubiliza-tion, and non-protein contamination.
On the other hand, the limitations of the analytical methods are the detection and the quantification of the proteins. Due to the difficulty in detection of low abundant proteins in biolog-ical materials, proteomics is simultaneously trying to increase the low quantity of the low abundant proteins to allow an effi-cient detection, and to apply the proper analytical methods to visualize all proteins of a mixture. So, the quantity of low abun-dant proteins in sample is one of essential factors that occur in low abundance levels and cannot be readily detected during the analysis of total proteins. In addition, some techniques of pro-teomic analysis show the problems of reproducibility, sensitivity and accuracy. For example, 2DE mostly shows the problems of non-reproducibility, poor resolution of separation, and hardly detection of low abundant proteins [12]. Mass spectrometry (MS) has different kinds of analysis platform, which based on physicochemical principles, and also provided the MS results with different separation and accuracy upon machinery use[13]. Therefore, those of techniques are also dependent on sample property, sample preparation, and proper use of techniques[14].
3. Sample preparation
3.1. General sample preparation methods
Due to the vast diversity of sample components, the sample preparation is absolutely essential in many successful exper-iments and is the most important factor in the first step of proteomic analysis because the biological materials contain either protein of interest or other interfering substances, such as salts, small ionic molecules, ionic detergent, charged molecules, lipid, and non-protein components, and the protein of interest must be isolated by the proper preparation method. Those sub-stances in the sample may lead to difficulty in protein separation and also disturb the detection and identification in proteome studies, so sample preparation is necessary to deplete or entirely remove the interfering substances in the biological samples prior to analysis. Depending on the type of sample, there are vari-ous ways to prepare protein sample for further analysis. The general sample preparation methods of greatest interest in pro-teomics study are prefractionation and enrichment of protein
prior to further protein separation by preparative electrophoresis or chromatography[15]. The basic methods, including precipi-tations, dialysis, ultrafiltration and gel filtration, can employ to concentrate the sample and to separate the proteins from poten-tially interfering substances. Precipitation methods, relying on different chemical principles, can be performed by ammonium sulfate precipitation, trichloroacetic acid (TCA) precipitation, TCA in acetone precipitation, ethanol precipitation, and ace-tone precipitation [16]. Although many protein precipitation methods have the advantages for concentrating and eliminat-ing interferences, they also have the disadvantages of protein irreversible denaturation and protein insolubilization. Dialysis is an old established procedure for reducing the salt concentra-tion in samples and its separaconcentra-tion based on principles of diffusion that allows the low molecular weight contaminant removal from sample solutions. Using dialysis method can reduce the max-imal interfering substances, but it may have lost the protein in sample, get the high volume of interchanged buffer, need to be concentrated and spend more time than other desalting techniques [17]. In the meanwhile, ultrafiltration can remove
high molecular weight polysaccharides and salts with a short time and avoid precipitation[18,19]. Although the removal of low molecular weight proteins or interferences can concentrate the protein concentration, but some of high molecular weight interferences are also concentrated that is the disadvantage of this technique. Therefore, each sample preparation method has advantage and disadvantage upon the sample composition and the proper preparation method used.
3.2. Advanced preparation methods 3.2.1. Enrichment of low abundant proteins
The effort of disease biomarker discovery in biological sam-ples generally observes in the extraordinary range of high abundant proteins while the low abundant proteins cannot be readily detected during the analysis of total proteins. The pres-ence of high abundant proteins reasonably obscures the amount of low abundant proteins that may act as disease biomarkers
[20]. Due to diverse characteristics of biological samples, the optimization of the protein preparation method can reduce the
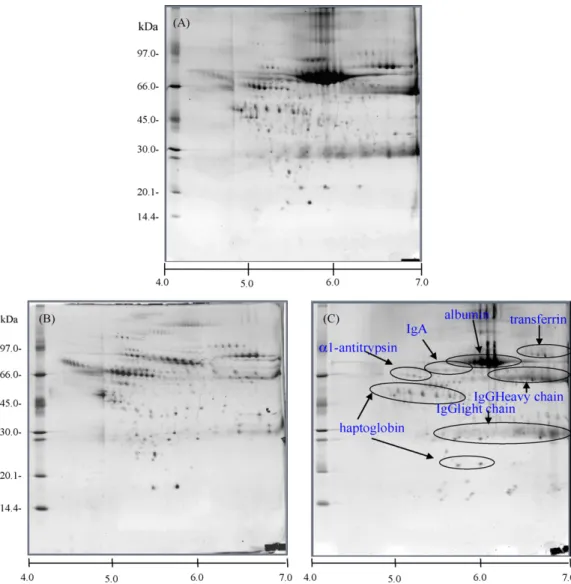
Fig. 1. 2DE protein profiles of whole serum proteins and depleted high abundant proteins in normal serum sample. Four high-abundant proteins, namely alpha 1-antitrypsin, IgA transferrin, and haptoglobin, were depleted by immunoprecipitation against theirs antibodies and albumin and IgG proteins were subsequently depleted by removal kit. Labels: (A) untreated neat serum; (B) six abundant proteins depleted normal human serum; (C) bound proteins.
complexity of protein samples and would be a fundamental first step in the proteomic analysis. There are many reports about the removal of high abundant proteins that enrich the low abundant proteins and enable to increase the quantity of protein iden-tification [21–23]. In the case of human blood proteome, the bulk of the serum and plasma comprised of several proteins and their isoforms, in which the protein content of human blood is dominated by the high abundant proteins, such as albumin, transferrin, haptoglobulin, immunoglobulins and lipoproteins. The presence of high amounts of these proteins creates techni-cal difficulties for identifying minor components. Particularly, albumin and immunoglobulin (Ig) are the carrier or transporter proteins that bind with other important entities in blood, and con-sequently albumin or Ig depleting from serum or plasma samples risk loosing the proteins of other constituent important species
[24,25]. However, the important points for protein separation are expected in term of high binding and specificity, minimal disruption to native condition of samples, simple procedure and reproducible results.
Currently, the detection of specific low abundant protein has been studied to increase the dynamic concentration range avail-able for the identification and characterization of serum proteins by employing commercial removal kits coupled with immuno-precipitaion technique in different types of antibodies. In our study, we used the immunoprecipitaion method to specifically remove four high abundant proteins, such as alpha-1 antitrypsin, immunoglobulin A (IgA), tranferrin, haptoglobin and followed by depletion of albumin and IgG by using removal kit. The combination of removal techniques enabled the enrichment of low abundant proteins and reached a loading sufficient to detect trace proteins, whereas many proteins were less abundant or undetectable (Fig. 1). Moreover, we also removed the high abun-dant proteins of albumin and IgG in hepatocellular carcinoma (HCC) serum samples before and after tumor resection in order to investigate the low abundant protein markers in HCC serum. The 2D gel patterns of depleted serum samples showed the significant increase in intensity of protein spot and the differ-entially expressed proteins among two samples of HCC serum (Fig. 2). The usefulness of depletion strategy for proteomic application is to significantly enhance the detection of protein resolved by proteomic analysis, and to compare the low abundant protein patterns between serum samples before and after subtrac-tion. In addition, an immobilized metal affinity chromatography (IMAC) is a separation technique that uses covalently bound chelating compounds on solid chromatographic supports to entrap metal ions, which serve as affinity ligands for various pro-teins or peptides, making use of coordinative binding of some amino acid residues exposed on the surface[26]. Initially, IMAC was generally used for separating proteins and peptides with nat-urally present, exposed histidine residues, which are primarily responsible for binding to immobilized metal ions, and is also particularly suitable for isolating the protein target from complex extracts and biofluids. This technique has not only proven to be one of the most effective approaches, which is one way of reduc-ing sample complexity to further enrich the target proteins, but also used for isolating and selective enriching the phosphopro-teins or phosphopeptides from complex mixture prophosphopro-teins[27].
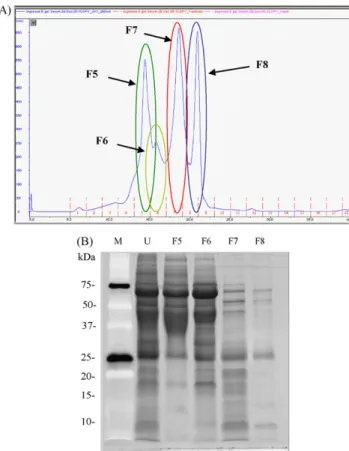
However, the complete removal of such proteins, which will trap with other proteins and lost proteins, should be considered. On the other hand, an alternative enrichment approach of low abundant proteins is the gel filtration chromatography that sep-arates the proteins based on size exclusion. This technique was used to separate the high and low molecular weight urinary pro-teins from the urine sample mixtures and the result showed a good separation of proteins (Fig. 3). It also provided several sig-nificant advantages to selective fractionation of proteins upon molecular weight and to reduce the complexity of the protein mixtures.
3.2.2. Removal of carbohydrate moiety
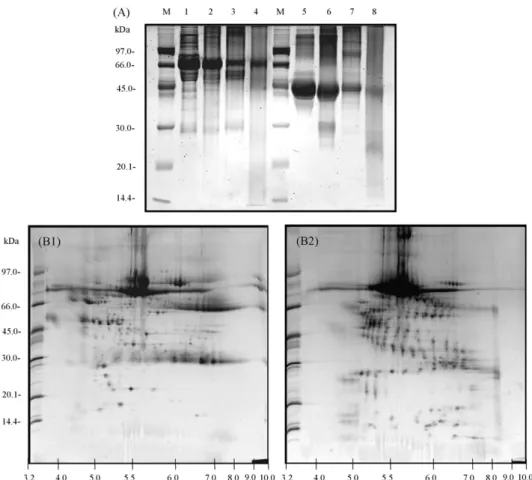
Proteins from natural sources often retain carbohydrate chains which are connected by either O- or N-glycosidic link-ages to proteins and these modifications play a critical role in the biological system and in disease progression[28]. In gen-eral, the N-glycosidic linkage is through the amide group of asparagines while the O-glycosidic linkage is to the hydroxyl of serine or threonine. More than half of total proteins in the human blood serum have carbohydrate molecules, know as O-linked and N-linked glycoproteins[29,30]. Moreover, deglycosylation of glycoproteins can be achieved by either enzymatic or chemi-cal method that can reduce the complexity of proteome samples by glycosylation[28]. Enzymatic methods include the use of a variety of endoglycosidase (peptide N-glycosidase F) and endo-alpha-N acetylgalactosaminidase (O-glycosidase) enzymes able to release glycans from glycoprotein. The successful enzymatic method is dependent on the substrate specificity of enzyme and the choice of hydrolytic condition. Otherwise, chemical methods for deglycosylating glycoprotiens with anhydrous hydrazine, trifluoromethanesulphonic acid (TFMS) and anhydrous hydro-gen fluoride (HF) effectively remove peripheral sugars from the oligosaccharide side chains of glycoproteins [31–33]. In addition, an alternative procedure for deglycosylation using hydrogen fluoride (HF) has been employed with removal of car-bohydrates or polysaccharides from glycoprotein. In our study, we also used the HF anhydrous to deglycosylate the glycan groups of glycoproteins in normal human serum for studying the effect of chemical deglycosylation method on reduction of sample complexity by removal of carbohydrate moieties that possess the post-translational modifications, known as N- and O-linked glycosylations. The results showed the different pro-tein patterns of deglycosylated serum proteome with distinctly shifting molecular weights and pI values of proteins (Fig. 4). Removing all oligosaccharides that attached to proteins by HF deglycosylation method may be applied to analyze the protein markers in human disease serum, which contain in the complex-ity of glycoproteome samples.
3.2.3. Sequential preparation methods
Challenges associated with the efficient and effective sam-ple preparation methods are crucial to achieving good protein recovery and enable quantitative proteomic measurements due to a common problem is that a variety of biological sources and lack of standardization of influence of sample processing to minimize sample losses. The decision to employ a sample
Fig. 2. 2DE protein profiles of normal and HCC patient serum before and after depletion of albumin and IgG proteins. Labels: (A) normal serum; (B) depleted normal serum; (C) HCC serum; (D) depleted HCC serum; (E) narrow range of target region in depleted HCC serum with identified proteins and NCBI accession numbers. The proteins were visualized with modified silver stain. Boxed and circled regions indicate the differentially expressed proteins after depleted albumin and IgG proteins.
preparation method depends on the type of sample and the exper-imental design. The basic methods of sample preparation, such as dialysis, ultrafiltration, lyophilization and protein precipita-tion, used for protein concentration and separation of diverse small molecules, can provide the different quality of proteomics
results. Each preparation method has advantages and disad-vantages in the same time. However, some samples cannot be prepared in once step and are probably required by an alternative method for protein concentration and/or desalting more than one step, in order to get the high quality of sample.
Fig. 3. Separation of high abundant urinary proteins by FPLC analysis using Superose 6 gel filtration chromatography. (A) FPLC chromatogram of urinary proteins flowed through size exclusion chromatography (SEC) using Superose 6 prep grade gel, column size of 1 cm× 30 cm, 50 mM Tris-HCl buffer pH 7.5 containing 50 mM NaCl and 0.025% NaN3, flow rate of 0.3 mL/min, UV280 nm. (B) SDS-PAGE gel stained with SYPRO Ruby staining to analyzed each fraction (indicate by circle) eluted from FPLC column. The samples in the different lanes represent: standard protein markers (lane 1, M), total urinary protein (lane 2, U), eluted fraction no. 5, 6, 7, and 8 from Superose 6 column (lane 3, F5; lane 4, F6; lane 5, F7; lane 6, F 8), respectively.
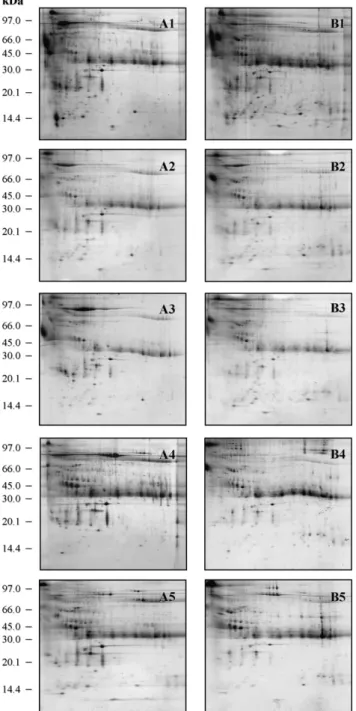
In the presence, the combination of sample preparation meth-ods is helpfully used to isolate the high amount of proteins in the mixture of biological samples. For example, the human urine samples contain a high amount of interferences, such as salts, metabolic wastes, small molecules and a few of proteins, which give the difficulty to separate the proteins. So, the removal of interferences in human urine samples is very important and needs to do as the first priority and follow by other preparation methods to remove the remaining interferences and to enrich the protein concentration. In our study, the urine samples were passed first through a gel filtration column to remove high salts and subsequently concentrated by ultrafiltration or four precipi-tation methods[34]. The results of 2DE showed more distinctly different protein patterns and the sequential preparation of uri-nary proteins by gel filtration and ultrafiltration could retain most urinary proteins which demonstrated the highest protein spots on 2D gels and able to identify preliminary protein mark-ers related to cancer (Fig. 5). After protein identification by MALDI-Q-TOF analysis, GM2 activator protein (GM2AP) is one of most interesting proteins that showed high expression level in lung cancer urine sample, and acted as an essential
cofac-tor for hydrolyzation of terminal-hexaminidase A (Hex A). Although sequential preparation of urine samples by gel filtra-tion and protein precipitafiltra-tion methods resulted in low amounts of protein spots on 2D gels, the high molecular weight pro-teins were easily detected. Therefore, the sequential preparation methods are alternative choices for urinary sample preparation for studying the urinary proteome and identifying protein mark-ers important for further preclinical diagnostic and therapeutic applications.
4. Proteomic analysis 4.1. Protein separations
4.1.1. General protein separation: chromatography and electrophoresis
Chromatography and electrophoresis have been used for cen-turies as a means of protein separation. Due to many diverse properties of samples, many techniques have been developed taking advantage of differences in chemistry, biology, size, shape, charge, hydrophobicity and biochemistry of the molecu-lar to separate the molecumolecu-lar forms found in biological samples
[35]. Chromatography is usually used to separate different com-pounds in a mixture and to determine the exact amount of each compound. It is a powerful analytical technique because it can be used both qualitative and quantitative. Many types of available matrix used for column chromatography are usually packed in the column in the form of small beads and provided the different protein profiles of each separation. Affinity chromatography is usually used for purifying the target protein with high affinity binding upon the matrix used; for example, a molecule of anti-body or enzyme substrate directed interact a specific protein is attached to the bead. Otherwise, the lectin-agarose affinity chro-matography based on lectin specificity on carbohydrate moiety is also used to bind specific sugars for depletion of carbohy-drate moieties or enrichment of glycoproteins prior to proteomic analysis [36]. Gel filtration chromatography is used to sepa-rate proteins or peptides on the basis of size. Smaller molecules diffuse further into the pores of the beads and therefore move through the bed more slowly, while larger molecules enter less or not at all and thus move through the bed more quickly. Both molecular weight and three-dimensional (3D) shapes of proteins contribute to the degree of retention. Gel filtration chromatogra-phy can also be used for analysis of molecular size, separation of target protein in a mixture, and salt removal or buffer exchange from a preparation of marcromolecules. Ion-exchange chro-matography relied on charge–charge interactions between the proteins in sample and the charges immobilized on the resin can be subdivided into cation- and anion-exchange chromatogra-phy. Cation-exchange chromatography binds positively charged ions, while anion-exchange chromatography binds negatively charged ions. However, the utility of chromatography meth-ods as the sole separation technique are used to isolate proteins before mass spectrometry analysis.
Electrophoresis is a method that separates macromolecules either nucleic acids or proteins on the basis of size, electric charge, and other physical properties. Separation of charged
Fig. 4. Deglycosylation of glycoproteins in normal human serum by chemical method, (A) SDS-PAGE gel of deglycosylated proteins in serum samples. (M: protein markers; 1, normal human serum (NS); 2, NS + HF (anhydrous); 3, NS + HF (48–51%); 4, NS + TFMS; 5, ovalbumin (O); 6, O + HF (anhydrous); 7, O + HF (48–51%); 8, O + TFMS). (B) 2DE gel images of normal human serum before (B1) and after HF deglycosylation (B2).
molecules is based on their migration in an applied electric field. For instance, polyacrylamide gel electrophoresis (PAGE), since the pores in a PAGE gel are excluded the size of pro-teins, molecular sieving contributes to the resolving power of PAGE. Consequently, PAGE is a high-resolution method and one of the best available for separating complex mixtures of proteins, which require a small gel pore size for retardation. High throughput technique has been developed which utilize protein separation by 1D or 2DE. The 2DE analysis of proteins is currently the highest-resolution analytical technique avail-able for the study of protein expression pattern and capavail-able of resolving thousands of protein in one experiment. The promi-nent point of 2DE as a separation technique is the orthogonality of the two-dimensional separation, based on vertically pI and horizontally molecular weight. The procedure has become the core technology to visualize the global change in protein expres-sion for proteome analysis with subsequent protein identification by mass spectrometry [37,38]. Since the high sensitivity and throughput of mass spectrometry were the main characteris-tic that provided the best methodology to identify protein of interest, the mass spectrometry has been widely recognized as a cornerstone of proteomic research.
4.1.2. Multidimensional proteomic approach
Many proteomic approaches have been attempted to increase the overall resolution of protein separation by combining
differ-ent techniques. Up-to-date, the first approach is still 2DE that used to characterize the complex protein mixtures, followed by trypsin proteolysis of visible proteins spots, and subse-quent analyzed the individual digested peptide by MALDI-MS
[39–41]. Although the 2DE provides excellent resolving power, the dynamic range of this technique is still limited for detection of low abundant proteins. Some technical limitations are differ-ently in accomplishing reproducible separation and identifying separated proteins. Thus, the separation of such large number of component is not possible by only a single chromatographic or electrophoretic run[42,43]. The use of several independent dimensions significantly increases resolution of a separation. Therefore, the combination of two or more orthogonal separation procedures dramatically improves the results in a larger number of protein or peptide being identified from complex proteome digests.
Alternative ways of multidimensional approaches employing liquid chromatography (LC) can potentially overcome some of the limitation of 2DE in proteomic analysis and are proposed as a way to separate protein and peptide with development of highly effective methods for peptide separation. The most current liquid phase separation methods can be achieved by using high performance liquid chromatography (HPLC), capil-lary isoelectric focusing (CIEF) and/or capilcapil-lary electrophoresis (CE). The protein analysis can combine two different separa-tion processes, chromatography or electrophoresis [40,44,45].
Fig. 5. 2DE patterns of pooled urine samples from normal (A) and lung cancer (B) by using different techniques of sample preparation. The urine samples were prepared by using ultrafiltration (A1, B1); acetone precipitation (A2, B2); ACN/TFA precipitation (A3, B3); methanol/chloroform/water precipitation (A4, B4) and TCA in acetone precipitation, respectively.
For example, the protein analysis can use ion-exchange HPLC followed by reverse phase-HPLC (RP-HPLC) followed by CE or CIEF, and can also be coupled with different detection sys-tems, such as 2DE, MS or laser-induced fluorescence (LIF), to enhance the detectability and identification. Recently, a novel multiplexed microcapillary liquid chromatography system has been developed for automated and high throughput separation of complex protein/peptides sample in RP-LC subsequently fol-lowed by MALDI analysis[44]. This strategy allows a four-fold increase in sample throughput and relies on both MS and MS/MS analysis for quantitative and qualitative analysis of protein
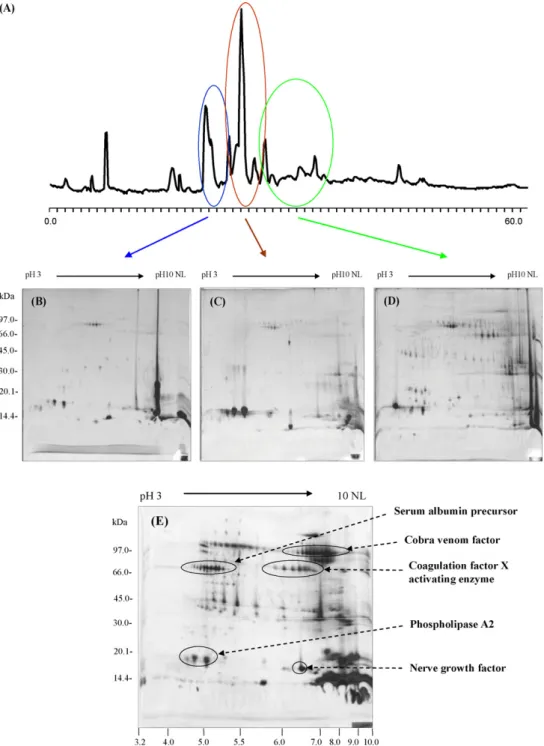
mix-tures. The combination of liquid chromatography with different separation principle makes multidimensional chromatography more attractive technology. In addition, we also used the mul-tidimensional chromatographic methods using RP-HPLC and 2DE to separate the protein component of Naja naja kaouthia venom (Fig. 6). The 2DE images of the three RP-HPLC peaks demonstrated broad distribution of molecular weights and pI values. The 2DE result of one peak from the RP-HPLC elution contained many protein components that include protein aggre-gates, isoforms, or protein–protein interactions having the same hydrophobic property. Many trains of spots are presumed to be protein isoforms, due to post-translational modifications, as well as homologues with similar amino acid compositions. Using multidimensional chromatographic methods to prefractionate and analyze the snake venom proteome, the obtained protein patterns, protein identifications, and unique markers are very important and useful for further diagnostic and pharmaceutical applications.
4.2. Protein detection and quantification
The differential protein expression on gel electrophoresis including 1D and 2DE is analyzed by the shape, size, and inten-sity of the corresponding band or spot of proteins. The first stage in protein quantification is image acquisition and the method used depending on how the proteins were stained. The most popular and widely used methods of protein staining that are applied to reveal all the protein bands or spots are Coomassie colloid solution[46], Silver nitrate[47,48]and SYPRO®Ruby
[49]. Coomassie and silver gel stains can be scanned with charge-coupled device (CCD) camera, while SYPRO®Ruby gel stain or fluorescently labeled proteins must be scanned using fluorescent image scanner, such as Typhoon 9200 series scanner (Amersham Bioscienes). Two dimensional difference in-gel electrophoresis (2D DIGE) is a relatively new technique in 2DE for multiplex quantitative analysis of the component proteins of related but different protein samples[50,51]. This technique allows label-ing protein mixtures with different fluorescent cyanine dyes, such as Cy2, Cy3 and Cy5 maleimides. These CyDyes are struc-turally similar, but spectrally different (Cy2,λem= 520 nm; Cy3,
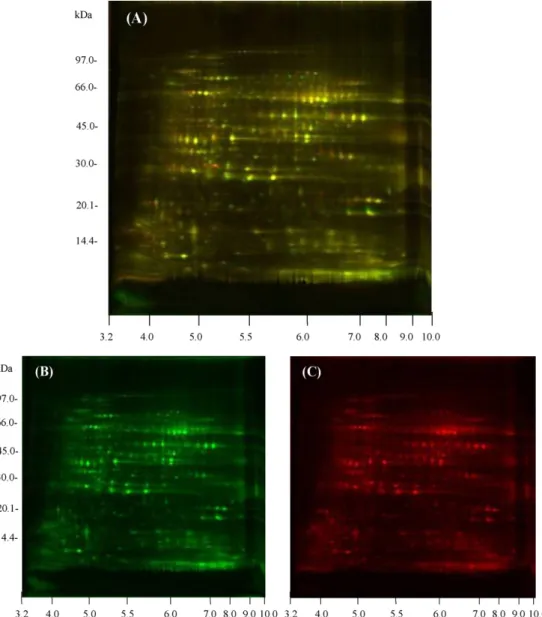
λem= 580 nm; Cy5,λem= 670 nm) fluorophors undergo nucle-ophilic substitution reaction with the thiol group of cysteine residues of proteins via a thioether linkage. The 2DE image shows the different protein spots with different fluorescent col-ors of labeled CyDyes on one gel image and the fluorescent intensity can be compared to allow quantification of each pro-tein spot. In our study, we employed 2D DIGE to investigate differentially expressed proteins in rice samples. For each of sample, Cy3-labeled proteins from CNT1 rice sample were com-bined with Cy5-labeled proteins from KMDML105 rice sample and separated by 2DE analysis (Fig. 7). Special image analysis software can be used to match the images, to quantitative the spots, to normalize the signals, and to provide the difference of expression of any set of two proteins by comparison. Com-pared with conventional 2DE, the co-migration of proteins on 2D DIGE can generate reproducible data and has the potential for high-throughput analysis.
Fig. 6. Multidimensional chromatography of Naja naja kaouthia venom using RP-HPLC and 2DE analysis. (A) RP-HPLC fractionation of N. naja kaouthia; (B), (C), and (D) are 2DE images of fractionation of peak area eluted from RP-HPLC; and (E) 2DE image of whole proteins from N. naja kaouthia venom.
In addition, the post-translational modifications of phospho-proteins and glycophospho-proteins can be directly detected by different staining methods[52–55]. Pro-Q Diamond phosphoprotein stain is a phosphoprotein specific fluorescence-dye that is available from Molecular Probes, and can be used to detect phospho-rylated tyrosine, serine, or threonine residues of proteins on SDS-PAGE and 2DE [53]. Otherwise, a recently developed approach for the detection of glycosylated proteins relies upon the utilization of a fluorescent hydrazide. Pro-Q Emerald 488 glycoprotein gel stain provides an attractive alternative to the labeling with radioactive sugars that conjugated to
glycopro-tein by periodic acid Schiff’s mechanism to use for specific glycoprotein detection[56]. Gels stained with both Pro-Q Dia-mond phosphoprotein stain and Pro-Q Emerald 488 glycoprotein stain can also be post-stained with SYPRO®Ruby dye, which allows sequential detection of total protein profile in the same gel. Furthermore, several labeling strategies have been devel-oping, based on the metabolic labeling for incorporation of a light or heavy form to the different experimental protein sample. Recently, the stable isotope labeling is used for quantification of proteins[57,58]. One of most popular methods for isotope labeling is ICATs (isotope coded affinity tagging), based on two
Fig. 7. Separation of proteins in CNT1 and KDML105 rice samples on 2D difference in-gel electrophoresis (2D DIGE). Equal volumes of the two fluorescent dye-labeled samples were mixed, separated on 2DE by isoelectric focusing (IEF) followed by SDS-PAGE. The IEF was performed in an 18 cm Immobiline DryStrip with a pH range of 3–10 NL. The protein were further separated by SDS-PAGE on a 12.5% polyacrylamide gel, and scanned using the Typhoon 9200 series imager. (A) Comparative protein expression profiling in CNT1 and KDML105 rice samples by 2D DIGE. (B) The CNT1 proteins were labeled with Cy3 (green color). (C) The KDML105 proteins were labeled with Cy5 (red color).
principles: (i) a short sequence of contiguous amino acids con-tains a sufficient information to identify that unique protein, and (ii) pairs of peptides tagged with the light and heavy ICAT reagents are chemically identical and therefore serve as ideal mutual internal standards for accurate quantification [59,60]. Another isotope tagging method is stable isotope labeling with amino acids in cell culture (SILAC) that has also widely used method to identify and quantitate complex protein samples[61]. Using SILAC approach involves growing cells two different bio-logical condition on normal and stable-isotope labeled media that supplemented with light or heavy isotope containing amino acids, the isotope labeled samples are then combined in equal ratios and subsequent analyzed quantification of proteins or peptides by MS. These labeling strategies employ mass spec-trometry to obtain quantitative information, which can determine the relative abundance for each peptide-pair. Any peptide-pairs
that are significantly different can be further sequenced using MS/MS and the relative amounts of the isotopic peaks can be determined on the basis of the intensities of the light and heavy peptides. It allows comparison samples to be combined and treated as a single sample throughout subsequent purification and analyses[61–63]. Although the strength of these techniques lies in its ability to allow quantification and identification within a single analysis, there is some limitation of each technique. In one limitation of isotopic labeling techniques, SILAC requires no chemical labeling or affinity purification steps because it relies on the normal biosynthetic machinery of cells, whereas ICAT uses a chemical, only cysteine containing peptides are retrieved non-specific binding to stable isotope mass tags. Thus, the strategies for protein quantification in proteomics depend on the use of general staining or labeling of particular classes of proteins, which is a significant component of proteomics.
4.3. Protein identification by mass spectrometry
Mass spectrometry has become an important tool for protein identification, peptide sequencing, identification and location of post-translational modifications of proteins[64–66]. In gen-eral, the mass spectrometer can be thought of as two distinct components of the ionization source and the mass analyzer. The ionization source is the region of the instrument in which the sample of interest is ionized, with a positive or negative charge, and then desorbed into the gas phase. The mass ana-lyzer is where the gas phase ions created in the source region are guided through the instrument to the detector, where their mass-to-charge (m/z) ration is measured. Two ionization sources of electrospray ionization (ESI) and matrix-assisted laser des-orption/ionization (MALDI) are currently the principal methods for peptide/protein ionization. ESI is the choice of identifica-tion method for proteins, oligonucleotides and metal complexes, which can produce molecular ions directly from samples in solution and transfer into the gas phase. However, the effi-cient of ionization is directly impacted by the solution phase chemistry of the various peptides that varies in accordance to their physicochemical properties, including pKa value,
polar-ity, hydrophobic or hydrophilic index and ionization potential, and by the concentration and type of peptides infused into the ionization source. MALDI coupled with time-of-flight (TOF), known as MALDI-TOF, has been developed for the ionization of relatively large polypeptides and proteins and its application has widened to incorporate glycoproteins, oligonucleotides and complex carbohydrate[67,68]. It is used predominantly for the analysis of simple peptide mixtures, such as the peptide obtained from an interest of single spot that separated on 2DE. Also, it has been used to analyze the large m/z range mass used for protein identification by means of peptide fingerprinting but it was suitable for analysis of material obtained from organisms with known complete nucleotide sequence of genome[69–71].
However, MALDI-TOF still has a limitation in the analysis of low molecular mass proteins that delivered few peptides, and the identification is often based on a low number of matches. Although identification of small proteins by MALDI-TOF is not efficient, the combination of MS/MS technologies, such as TOF/TOF, hybrid quadrupole time-of-flight (Qq-TOF), or LC–MS/MS, may be useful and more advantageous for peptide sequencing[72–74].
5. Bioinformatics tools for data mining 5.1. Database search of protein ontology
The bioinformatics tools of proteome studies enable the anal-yses of complex sample and organization of the data in a useful biological context. Due to the numerous data in proteomics analyses and the lack of well data interpretation and organi-zation, these tools are needed to emerge many software and database systems to automate these higher-level organizational tasks. Database of 2DE maps and programs for the image pro-cessing of their maps are developed to be the integrated software that are available during search by connecting to other database via active links[75,76]. The partial list of 2DE gel map databases is presented inTable 1, which ties directly to a proteome database of species with completed genome information. Several gel databases are able to zoom into any region of the 2DE gel pattern with the corresponding MW and pI scale automatically updated and its can be searched by organism, sample type and anno-tation. SWISS-2DPAGE is the most well-known database and its data used to be stored as separate text file, which are very convenient to obtain consistent, and facilitate data integration from external sources. Also, there are two special catalogues of numerous databases of 2DE maps; WORLD-2DPAGE (http://www.expasy.ch/ch2d/2d-index.html) and 2DWG Image Meta-database (http://www-lecb.ncifcrf.gov/2dwgDB)[77].
Table 1
Partial list of 2DE gel image databases including material image sources and web location
Organization Material images Websites (URL)
ExPASy SWISS 2DPAGE Liver, plasma, HepG2, HepG2SP, RBC, lymphoma, CSF, macrophage-CL, platelet, yeast, Escherichia coli, colorectal, etc.
http://www.expasy.ch
Argonne Protein Mapping Group
Mouse liver, human breast cell lines, pyrococcus http://www.anl.gov/BIO/PMG/
Joint Protein Structure Lab Human colorectal-CL, placental lysosomes http://www.ludwig.edu.au/jpsl/jpslhome.html
Yeast 2D gel DB, Bordeaux Yeast http://www.ibgc.u-bordeaux2.fr/YPM
IPS/LECB, NCI/FCRDC Phosphoprotein, prostate, phosphoprotein, breast cancer drug screen, FAS (plasma), Cd toxicity (urine), leukemia
http://www.lecb.ncifcrf.gov/ips-databases.html
Washington Univ. Inner Ear Protein Database
Human: inner ear http://oto.wustl.edu/thc/innerear2d.htm
Protein Project of Cyanobacteria
Cyano2Dbase-Synechocystis sp. PCC6803 http://www.kazusa.or.jp/cyano/cyano2D/
Lab. de Biochimie et Tech. des Proteines, Bobigny
Human leukemia cell lines
http://www-smbh.univ-paris13.fr/lbtp/biochemistry/biochimie/bque.htm
Siena2D-PAGE Chlamydia trachomatis L2, Caenorhabditis elegans, human breast ductal carcinoma and histologically normal tissue, human amniotic fluid
http://www.bio-mol.unisi.it/2d/2d.html
BALF 2D AGE Mouse, human broncho-alveolar lavage fluid http://www.umh.ac.be/∼biochim/BALF2D.html
PHCI-2DPAGE Parasite host cell interaction, IFN-gamma induced HeLa cells http://www.gram.au.dk/
Table 2
Some software for protein identification by peptide mass fingerprint (PMF), sequence query and MS/MS ions
MS data Source (Websites)
PMF
1. Mascot http://www.matrixscience.com/search form select.html
2. MS-FIT (protein prospector) http://prospector.ucsf.edu/ucsfhtml4.0/msfit.htm
3. PeptideSearch http://www.mann.embl-heidelberg.de/GroupPages/PageLink/peptidesearch/Services/Peptide Search/ FR PeptideSearchFormG4.html 4. ProFound http://bioinformatics.genomicsolutions.com/service/prowl/profound.html 5. PeptIdent http://us.expasy.org/tools/peptident.html 6. ProteinLynx http://www.waters.com 7. IonIQ http://www.proteomesystems.com Sequence query
1. Mascot http://www.matrixscience.com/search form select.html
2. MS-Seq (protein prospector) http://prospector.ucsf.edu/ucsfhtml4.0/msseq.htm
3. Multident (TagIdent, etc.) http://www.expasy.or/tools/multildent/
4. PeptideSearch http://www.mann.embl-heidelberg.de/GroupPages/PageLink/peptidesearch/Services/PeptideSearch/ FR PeptidePatternFormG4.html
5. PepSea http://www.unb.br/cbsp/paginiciais/pepseaseqtag.htm
MS/MS ions
1. Mascot http://www.matrixscience.com/search form select.html
2. MS-Tag (protein prospector) http://prospector.ucsf.edu/ucsfhtml4.0/mstagfd.htm
3. Omssa http://pubchem.ncbi.nlm.nih.gov/omssa/index.htm
4. Phenyx http://www.phenyx-ms.com
5. X!Tandem http://thegpm.org/TANDEM/index.html
6. Sequest http://www.thermo.com
7. PepFrag (Prowl) http://prowl.rockefeller.edu/PROWL/pepfragch.html
8. GutenTag http://fields.scripps.edu/GutenTag/index.html
Study of proteomes becomes important not only to iden-tify what genes a protein came from, but also what particular form the proteins has taken on in the particular biological cir-cumstances. The major protein identification of each program displays a match between experimentally collected MS data and protein sequence database using mass spectrometry for iden-tifying the protein sample [78]. There are three proven ways of using mass spectrometry data for protein identification. The first of these is known as a peptide mass fingerprint (PMF). This was the original method to be developed, and used the molecular weights of the peptides resulting from digestion of a protein by a specific enzyme[79,80]. The second method of using MS data for protein identification is a sequence query in which mass values combined with amino acid sequence or composition data. MS/MS ion search is the third category that searched uninterpreted MS/MS data from single peptide or from a complete LC–MS/MS run[81-85]. Some existing software for protein identification by PMF, sequence query and MS/MS ions is presented in Table 2. A fundamental difference come from the database used to make the comparison and the most popular databases used for a reference protein identification are NCBI
[86]and SWISS-PROT[87], which contain assisted informa-tion of both proteins and genes, and also provide a high level of annotated entries for all species.
5.2. Development of in-house bioinformatics tools
We have developed in-house bioinformatic tools for facilitat-ing the search for protein description, protein ontology, category classification and interactive pathways. Bulk Gene Search
Sys-tem (BGSS) is one of the protein search engines, which is composed of the UniGene, LocusLink and Proteome databases, and can be easily used to find the associated protein functions and related information in the worldwide databases by applying only protein name or accession number. The BGSS program is available at http://servx8.sinica.edu.tw/bgss-cgi-bin/protein.pl, and has been used for analyzing the proteomes of human myeloid leukemia cells[88]and thermophilic bacterium
Bacil-lus stearothermophiBacil-lus[89]. It will be useful for analyzing the other proteomes in the nearly future. On the other hand, the clas-sification of gene expression can be processed by Bulk Gene Search System for Java (BGSSJ);http://bgssj.sourceforge.net/) program, which is a searching system accomplished by open database connectivity, UniGene database, and Gene Ontology knowledgebase. It is also able to correlate gene identifying from cDNA microarray with their protein functions, which are coop-erated with BGSS program. The combination of both search engine programs is very useful and effective for correlating proteome and genome information, which provides more under-standing of systems biology.
In addition, we also developed an interactive tool, GeneNet-work, which is based on the gene expression data from DNA microarray experiments and available on http://genenetwork. sbl.bc.sinica.edu.tw [90]. GeneNetwork displays the gene reg-ulatory network of gene interactions at the level of gene expression and enables the visualization of large and complex data sets of genetic networks. It supports three data inter-polation approaches and four reverse engineering models to visually reconstruct the genetic networks, which also uses the genetic algorithm to fit the gene regulation matrix from the data.
GeneNetwork is an alternatively tool for further understanding a biological system through organizing functional sub-networks, inferring the overall regulation pathways and generating the biological hypotheses and meanings.
6. Conclusion and future perspectives
The proteomic approaches using many strategies and tech-nologies show certain limitations of detectability in proteomic studies while the efforts of reducing these limitations and enhancing detectability are increasingly continued. The most success of proteomic analysis depends on the complexity of sam-ples, sample preparation method and analytical method, which should be considerably selective used for each individual sam-ple. Currently, the identifying biologically relevant proteins in the whole proteomes are possible and the combination of pro-teomic tools, such as sequential sample preparation methods and multidimensional protein separation methods, become the pop-ular strategy that able to solve the limitations in proteome studies and to helpfully separate the interested protein from biological materials. In addition, the technical development in the fields of protein separation, protein identification, and bioinformatics can be integrated to solve the limitations in proteome studies and to improve the effective proteomic approaches for determining the differentially expressed proteins or novel biomarkers and for a better understanding of protein structure, biological function, and organization in complex signaling and regulatory net-works. Moreover, the up-to-date proteomic approaches are very important and helpfully used to decode complicated diseases. Comparison of the protein expression levels between disease and normal and the result of significantly changed proteins may provide more understanding of disease progression and obtain the biomarkers that are very important for diagnostic and thera-peutic applications. Although the challenges are great for global analysis of proteomes, the proteomic approaches for reduction of limitations and enhancement of proteomic detectability are alternative used for investigating the biomarkers and providing a greater understanding of disease-specific biomarkers in the application of proteomics to clinical application.
Acknowledgements
This work is part of the Royal Golden Jubilee Ph.D. project from Ms. Supawadee Sriyam supported by the Thailand Research Fund (Bangkok, Thailand). This work is also sup-ported by the Graduate School, Chiang Mai University (Chiang Mai, Thailand), and by the Academia Sinica (Taipei, Taiwan). We also gratefully acknowledge the provision of serum and urine samples from Lampang Regional Cancer Center (Thailand).
References
[1] N.L. Anderson, M. Polanski, R. Pieper, T. Gatlin, R.S. Tirumalai, T.P. Conrads, T.D. Veenstra, J.N. Adkins, J.G. Pounds, R. Fagan, A. Lobley, Mol. Cell. Proteomics 3 (2004) 311.
[2] R. Pieper, C.L. Gatlin, A.J. Makusky, P.S. Russo, C.R. Schatz, S.S. Miller, Q. Su, A.M. McGrath, M.A. Estock, P.P. Parmar, M. Zhao, S.T. Huang,
J. Zhou, F. Wang, R. Esquer-Blasco, N.L. Anderson, J. Taylor, S. Steiner, Proteomics 3 (2003) 1345.
[3] J.D. Wulfkuhle, L.A. Liotta, E.F. Petricoin, Nat. Rev. Cancer 3 (2003) 267. [4] Z. Xiao, D. Prieto, T.P. Conrads, T.D. Veenstra, H.J. Issaq, Mol. Cell.
Endocrinol. 230 (2005) 95.
[5] R. Chen, S. Pan, T.A. Brentnall, R. Aebersold, Mol. Cell. Proteomics 4 (2005) 523.
[6] K.K. Challapalli, C. Zabel, J. Schuchhardt, A.M. Kaindl, J. Klose, H. Herzel, Electrophoresis 25 (2004) 3040.
[7] C.P. Paweletz, M.C. Wiener, J.R. Sachs, R. Meurer, M.S. Wu, K.K. Wong, N.A. Yates, R.C. Hendrickson, Proteomics 6 (2006) 2101.
[8] S.M. Lin, R.P. Haney, M.J. Campa, M.C. Fitzgerald, E.F. Patz, Cancer Inform. 1 (2005) 32.
[9] I. Beer, E. Barnea, T. Ziv, A. Admon, Proteomics 4 (2004) 950. [10] J.R. Veraart, H. Lingeman, U.A.Th. Brinkman, J. Chromatogr. A 856 (1999)
483.
[11] M.L. Nielsen, M.M. Savitski, R.A. Zubarev, Mol. Cell. Proteomics 4 (2005) 835.
[12] R.M. Twyman, Principles of Proteomics, Cromwell Press, 2004, p. 30. [13] T.C.W. Pon, T.T. Yip, A.T.C. Chen, C. Yip, V. Yip, T.S.K. Mok, C.C.Y.
Lee, T.W.T. Leung, S.K.W. Ho, P.J. Johnson, Clin. Chem. 49 (2003) 752. [14] V. Santoni, M. Molluy, T. Rabilloud, Electrophoresis 21 (2000) 1054. [15] M. Zellner, W. Winkler, H. Hayden, M. Diestinger, M. Eliasen, B.
Gesslbauer, I. Miller, M. Chang, A. Kungl, E. Roth, R. Oehler, Elec-trophoresis 26 (2005) 2481.
[16] L. Jiang, L. He, M. Fountoulakis, J. Chromatogr. A 1023 (2004) 317. [17] L.L. Manza, S.L. Stamer, A.J.L. Ham, S.G. Codreanu, D.C. Liebler,
Pro-teomics 5 (2005) 1742.
[18] R.S. Tirumalai, K.C. Chen, D.A. Prieto, H.J. Issaq, T.P. Conrads, T.D. Veenstra, Mol. Cell. Proteomics 2 (2003) 1096.
[19] R.G. Haper, S.R. Workman, S. Schuetzner, A.T. Timperman, J.N. Sutton, Electrophoresis 25 (2004) 1299.
[20] L.F. Steel, M.G. Trotter, P.B. Nakajima, T.S. Mattu, G. Gonye, T. Block, Mol. Cell. Proteomics 2 (2003) 262.
[21] L.A. Echan, H.Y. Tang, N. Ali-Khan, K.B. Lee, D.W. Speicher, Proteomics 5 (2005) 3292.
[22] A.I. Mehta, S. Ross, M.S. Lowenthal, V. Fusaro, D.A. Fishman, E.F. Pet-ricoin, L.A. Liotta, Dis. Mark. 18 (2002) 1.
[23] H.L. Huang, T. Stasyk, S. Morandell, M. Mogg, M. Schreiber, I. Feuerstein, C.W. Huck, G. Stecher, G.K. Bonn, L.A. Huber, Electrophoresis 26 (2005) 2843.
[24] J.N. Adkins, S.M. Varnum, K.J. Auberry, R.J. Moore, N.H. Angell, R.D. Smith, D.L. Springer, J.G. Pounds, Mol. Cell. Proteomics 1 (2002) 947. [25] N. Zolotarjova, J. Martosella, G. Nicol, J. Bailey, B.E. Boyes, W.C. Barrett,
Proteomics 5 (2005) 3304.
[26] V. Gaberc-Porekar, V. Menart, J. Biochem. Biophys. Methods 49 (2001) 335.
[27] R. K˚ange, U. Selditz, M. Granberg, U. Lindberg, G. Ekstrand, B. Ek, M. Gustafsson, J. Biomol. Tech. 16 (2005) 91.
[28] E.F. Hounsell, Glycoanalysis Protocols, Humana Press Inc., Totowa, New Jersey, 1998.
[29] L.S. Grogan, M.R. Pratt, L.A. Marcaurella, C.R. Bertozzi, Annu. Rev. Biochem. 71 (2002) 593.
[30] H. Zhang, X.J. Li, D.B. Martin, R. Aebersold, Nat. Biotechnol. 21 (2003) 660.
[31] N.L. Wilson, B.L. Schulz, N.G. Karlsson, N.H. Packer, J. Proteome Res. 1 (2002) 521.
[32] B. Classen, S.L. Mau, A. Bacic, Planta Med. 71 (2005) 59. [33] A.S.B. Edge, Biochem. J. 376 (2003) 339.
[34] P. Tantipaiboonwong, S. Sinchaikul, S. Sriyam, S. Phutrakul, S.T. Chen, Proteomics 5 (2005) 1140.
[35] H.J. Issaq, T.P. Conrads, G.M. Janini, T.D. Veestra, Electrophoresis 23 (2002) 3048.
[36] H. Brzeski, R.A. Katenhusen, A.G. Sullivan, S. Russel, A. George, R.I. Somiari, C. Shirver, Bio. Techniq. 35 (2003) 1128.
[37] H. Wang, S. Hanash, Mass Spectrom. Rev. 24 (2005) 413.
[38] P.L. Ferguson, R.D. Smith, Annu. Rev. Biophys. Biomol. Struct. 32 (2003) 399.
[39] L.J. Zimmerman, G.R. Wernke, R.M. Caprioli, D.C. Liebler, J. Proteome Res. 4 (2005) 1672.
[40] P.L. Ferguson, R.D. Smith, Annu. Rev. Biophys. Biomol. Struct. 32 (2003) 399.
[41] T.J. Griffin, R. Aedersold, J. Biol. Chem. 276 (2001) 45497. [42] H. Wang, S. Hanash, Mass Spectrom. Rev. 24 (2005) 413.
[43] E. Vanrobaeys, R.V. Coster, G. Dhondt, B. Devreese, J.V. Beeumen, J. Proteome Res. 4 (2005) 2283.
[44] S. Shen, D. Chen, J.E. Van Eyk, Mol. Cell. Proteomics 5 (2005) 26. [45] A.K. Ottens, F.H. Kobeissy, R.A. Wolper, W.E. Haskins, R.L. Hayes, N.D.
Denslow, K.K.W. Wang, Anal. Chem. 77 (2005) 2283.
[46] V. Neuhoff, N. Arold, D. Taube, W. Ehrhardt, Electrophoresis 9 (1988) 255. [47] M.V. Nesterenko, M. Tilley, S.J. Upton, J. Biochem. Biophys. Meth. 28
(1994) 239.
[48] A. Shevchenko, M. Wilm, O. Vorm, M. Mann, Anal. Chem. 68 (1996) 850. [49] J.X. Yan, R.A. Harry, C. Spibey, M.J. Dunn, Electrophoresis 21 (2000)
3657.
[50] G. Zhou, H. Li, D. DeCamp, S. Chen, H. Shu, Y. Gong, M. Flaig, J.W. Gille-spie, N. Hu, P.R. Taylor, M.R. Emmert-Buck, L.A. Liotta, E.F. Petricoin, Y. Zhao, Mol. Cell. Proteomics 1 (2002) 117.
[51] A. Alban, S.O. David, L. Bjorkesten, C. Andersson, E. Sloge, S. Lewis, I. Currie, Proteomics 3 (2003) 36.
[52] C.T. Walsh, S. Garneau-Tsodikova, G.J. Gatto, Angew. Chem. Int. Ed. 44 (2005) 7342.
[53] T.H. Steinberg, B.J. Agnew, K.R. Gee, W.Y. Leung, T. Goodman, B. Schulenberg, J. Hendrickson, J.M. Beechem, R.P. Haugland, W.F. Patton, Proteomics 3 (2003) 1128.
[54] T. Stasyk, S. Morandell, R. Bakry, I. Feuerstein, C.W. Huck, G. Stecher, G.K. Bonn, L.A. Huber, Electrophoresis 26 (2005) 2850.
[55] C. Hart, B. Schulenberg, T.H. Steinberg, W.Y. Leung, W.F. Patton, Elec-trophoresis 24 (2003) 588.
[56] J. Wu, N.J. Lenchik, M.J. Pabst, S.S. Solomon, J. Shull, I.C. Gerling, Electrophoresis 26 (2005) 225.
[57] S.E. Ong, M. Mann, Nat. Chem. Biol. 1 (2005) 252.
[58] P.A. Everley, J. Krijgsveld, B.R. Zetter, S.P. Gygi, Mol. Cell. Proteomics 3 (2004) 729.
[59] S.P. Gygi, B. Rist, S.A. Gerber, F. Turecek, M.H. Gelb, R. Aebersold, Nat. Biotechnol. 17 (1999) 994.
[60] R.M. Hewick, Z. Lu, J.H. Wang, in: F.M. Ricards, D.S. Eisenberg, J. Kuriyan (Eds.), Advances in Protein Chemistry: Proteomics in Drug Dis-covery, Academic Press, Elsevier Science, USA, 2003, p. 309.
[61] S.E. Ong, B. Blagoev, I. Kratchmarova, D.B. Kristensen, H. Steen, A. Pandey, M. Mann, Mol. Cell. Proteomics 1 (2002) 376.
[62] P.A. Everley, J. Krijgsveld, B.R. Zetter, S.P. Gygi, Mol. Cell. Proteomics 3 (2004) 729.
[63] R. Amanchy, D.E. Kalume, A. Pandey, Sci. STKE. 2005 (2005) pl2.
[64] A.M. Salzano, M. Crescenzi, Ann. Ist. Super. Sanit`a. 41 (2005) 443. [65] W.J. Henzel, T.M. Billeci, J.T. Stults, S.C. Wong, C. Grimley, C. Watanabe,
Proc. Natl. Acad. Sci. U S A 90 (1993) 5011.
[66] A. Shevchenko, M. Wilm, O. Vorm, M. Mann, Anal. Chem. 68 (1996) 850. [67] R. Bakhtiar, R.W. Nelson, Mol. Pharmacol. 60 (2001) 405.
[68] P.L. Ferguson, R.D. Smith, Annu. Rev. Biophys. Biomol. Struct. 32 (2003) 399.
[69] V.M. Govorun, A.I. Archakov, Biochem. Mosc. 67 (2002) 1109. [70] M.A. Baldwin, Mol. Cell. Proteomics 3 (2004) 1.
[71] W.J. Henzel, C. Watanabe, J. Am. Soc. Mass. Spectrom. 14 (2003) 931. [72] J.E. Melanson, K.A. Chisholm, D.M. Pinto, Rapid Commun. Mass
Spec-trom. 20 (2006) 904.
[73] J.M. Koomen, L.N. Shih, K.R. Coombes, D. Li, L.C. Xiao, I.J. Fidler, J.L. Abbruzzese, R. Kobayashi, Clin. Cancer. Res. 11 (2005) 1110.
[74] I. Feuerstein, M. Rainer, K. Bernardo, G. Stecher, C.W. Huck, K. Kofler, A. Pelzer, W. Horninger, H. Klocker, G. Bartsch, G.K. 71onn, J. Proteome Res. 4 (2005) 2320.
[75] R.D. Apple, A. Bairoch, J.C. Sanchez, J.R. Vargas, O. Golaz, C. Pasquali, D.F. Hochstrasser, Electrophoresis 17 (1996) 540.
[76] S. Orchard, H. Hermjakob, R. Apweiler, Proteomics 3 (2003) 1374. [77] P.F. Lemkin, Electrophoresis 18 (1997) 2759.
[78] D.C. Chamrad, G. K¨orting, K. St¨uhler, H.E. Meyer, J. Klose, M. Bl¨uggel, Proteomics 4 (2004) 619.
[79] M.R. Wilkins, E. Gasteiger, C.H. Wheeler, I. Lindskog, J.C. Sanchez, A. Bairoch, R.D. Appel, M.J. Dunn, D.F. Hochstrasser, Electrophoresis 19 (1998) 3199.
[80] W. Zhang, B.T. Chait, Anal. Chem. 72 (2000) 2482.
[81] J.K. Eng, A. McCormack, J. Yates, J. Am. Soc. Mass Spectrom. 5 (1994) 976.
[82] D. Perkins, D. Pappin, D. Creasy, J. Cottrell, Electrophoresis 20 (1997) 3551.
[83] K.R. Clauser, P. Baker, A.L. Burlingame, Anal. Chem. 71 (1999) 2871. [84] D.J.C. Pappin, P. Hojrup, A.J. Bleasby, Curr. Biol. 3 (1993) 327. [85] J.A. Taylor, K.A. Walsh, R.S. Johnson, Rapid Commun. Mass Spectrom.
10 (1996) 679.
[86] K.D. Pruitt, K.S. Katz, H. Sicotte, D.R. Maglott, Trends Genet. 16 (2000) 44.
[87] B. Boeckmann, A. Bairoch, R. Apweiler, M.C. Blatter, A. Estreicher, E. Gasteiger, M.J. Martin, K. Michoud, C. O’Donovan, I. Phan, S. Pilbout, M. Schneider, Nucl. Acids Res. 31 (2003) 365.
[88] H.F. Juan, J.Y.C. Lin, W.H. Chang, C.Y. Wu, T.L. Pan, M.J. Tseng, K.H. Khoo, S.T. Chen, Electrophoresis 23 (2002) 2490.
[89] S. Sinchaikul, B. Sookkheo, S. Topanuruk, H.F. Juan, S. Phutrakul, S.T. Chen, J. Chromatogr. B 771 (2002) 261.
[90] C.C. Wu, H.C. Huang, H.F. Juan, S.T. Chen, Bioinformatics 20 (2004) 3691.