行政院國家科學委員會專題研究計畫 成果報告
第二型糖尿病患之自我評估健康狀態與死亡間之相關-某醫
院門診病患之五年前瞻性研究
計畫類別: 個別型計畫 計畫編號: NSC93-2320-B-039-011- 執行期間: 93 年 08 月 01 日至 94 年 07 月 31 日 執行單位: 中國醫藥大學中國醫學研究所 計畫主持人: 李采娟 共同主持人: 林正介 報告類型: 精簡報告 報告附件: 出席國際會議研究心得報告及發表論文 處理方式: 本計畫可公開查詢中 華 民 國 94 年 10 月 31 日
中文摘要 背景 過去許多研究顯示身體功能、自我評估之健康狀態和社會支持等生活 品質指標之層面與死亡有所關係,此關係甚至在控制了其他客觀之健康指標後 依然存在,自我評估健康狀態指標之價值建立於這些研究之發現。然而目前國 內少有此類之追蹤性研究,包括糖尿病病人的研究,尤其是糖尿病的照護包含 了飲食行為控制、減重、藥物與血糖控制等複雜的治療方式,如何在不可避免 的疾病管理下又可兼顧病人的需要和慾望,以達到最佳之生活品質乃是糖尿病 照護的最終目標,因此,生活品質為糖尿病照護相當重要的照護結果指標之一, 然而此指標是否能預測死亡呢?此乃本研究將要回答的研究問題。 目的 本研究目的主要探討控制了性別、年齡與糖尿病於研究起始點之狀態 後,一般性生活品質量表與死亡間之相關。 方法 本研究將採五年之前瞻性追蹤研究設計,被追蹤之人口為 1998 年自台 中市中國醫藥大學附設醫院網羅之 510 位第二型糖尿病患者所做之健康相關生 活品質調查。以受訓之訪員進行面訪為資料收集方式,所收集之資料包括 SF-36、 慢性病數與人口因子等,血糖控制情形和併發症之資料則摘要於病歷。SF-36 八 個操作型向量分別為身體活動功能(簡稱身體活動)、活動功能限制情況(簡稱活動 限制)、身體疼痛程度(簡稱身體疼痛)、個人評估身體健康之程度(簡稱自評健 康)、活力狀態、社交情況、心理健康狀態(簡稱心理健康)及心理健康限制生活程 度(簡稱心理限制)。死亡狀態將由衛生署之死亡資料庫所獲得。統計分析方法為 Cox’sProportionalHazard model。
結果 整體五年死亡率為 10.9%,考量年齡、性別、血糖控制情形和併發症後, SF-36 之身體活動、自評健康、活力、心理健康和心理綜合指標為顯著和死亡之 相關因素,糖尿病衝擊測量量表之症狀、安寧狀態和總分為顯著預測因子,但當 疾病別和一般性生活品質量表同時考量,只有糖尿病衝擊測量量表之症狀和角色 扮演情形為顯著之預測因子;在症狀方面,第二和第三個二十五百分位(較差之 狀態)之病患有較高之死亡危險性(第二和第三個二十五百分位之 RR 分別為: 13.10, 95% confidence interval [CI]: 2.75-62.50 和 5.49, 95% CI: 1.50-20.09);在角 色扮演情形方面,第二和第三個二十五百分位之病患有較高之死亡危險性(第二 和第三個二十五百分位之 RR 分別為: 6.18, 95% CI: 1.10-34.87 和 RR:6.53, 95% CI: 1.40-30.57)。此疾病別生活品質測量和死亡間之相關獨立於血糖控制和併發 症對死亡的解釋。
Abstract
Objective. To examine the predictive value of generic and disease-specific quality of
life measures on mortality, independently of age, gender, diabetic control and complications in diabetic patients. Methods. A five-year prospective, longitudinal study with in-person interviews was conducted. A total of 420 diabetic patients were recruited from the outpatient clinics of a medical center. At baseline, the generic measure of the Short Form 36 (SF-36), the disease-specific measure of the Diabetes Impact Measurement Scales (DIMS), and clinical and biological marker variables were measured. DIMS domains included symptoms, diabetes-related morale, social role fulfillment, and well-being. Complications consisted of stroke, heart disease, visual impairment, amputations, kidney disease, cognitive impairment, and incontinence. Mortality data were collected from the national mortality register using personal identification numbers. Multivariate Cox’s proportional hazards models were used. Results. The overall five-year mortality was 10.9%. The SF-36 scales of
physical functioning, general health, vitality, mental health, and MCS were significant predictors of mortality, while the DIMS scales of symptoms, well-being, and the total score were significantly associated with mortality, independent of age, gender, and complications. When the SF-36 and DIMS were simultaneously considered, only symptom and social role fulfillment of the DIMS exerted a significant effect on mortality. Patients in the categories of the 2nd and 3rd quartile (worse status) had significantly increased risk compared to those in the category of the 4th quartile (best status) (for the symptom scale, RR: 13.10, 95% confidence interval [CI]: 2.75-62.50; RR: 5.49, 95% CI: 1.50-20.09, respectively; for the social role fulfillment scale, RR: 6.18, 95% CI: 1.10-34.87; RR:6.53, 95% CI: 1.40-30.57). The unique contribution of the HRQOL to mortality was independent of more objective health measures, such as complications.
Key words
Short Form 36 (SF-36), Diabetes Impact Measurement Scales (DIMS), mortality
Introduction
The medical world has recognized the importance of the centrality of the patient point of view in monitoring the quality of medical care outcomes. Health-related quality of life (HRQOL) focuses on the impact of a perceived health state on the ability to live a fulfilling life (1), for people with diabetes can be influenced by a complex diabetes treatment regimen that includes dietary behavior, exercise, medication, glucose monitoring, and safety and preventive measures. Patients frequently feel that their lives are negatively affected due to diabetes, partly because they have to integrate and coordinate the various components of the treatment regimen into their normal life activities (2). On the contrary, as the disease progresses, the effect of diabetic complications and the resultant risk of adverse drug experiences would have an impact on the medical outcomes of these patients (3). To maximize the quality of life for people with diabetes is to attempt to strike a balance between an individual patient’s needs and desires and the imperatives of disease management.
A growing body of research shows that self-perceptions of health are linked to mortality,even when more“objective”health measures, such as morbidity (4,5), social support (5), and health behaviors (6), are controlled. A great value of the self-assessment of health lies in these findings. The unique contribution of health perceptions to mortality is substantial for both the general population (7-10) and adult-onset diabetes (11). These studies used a single indicator measuring the self-assessment of health, and some of them, a wide range of psychosocial and well-being measures. Prior studies exploring the relationship between HRQOL and mortality have focused on patients with asthma or chronic obstructive pulmonary disease (12-13), congestive heart failure (14), coronary heart disease (15-16), kidney disease (17), and advanced age (18). For a population with a specific disease, a disease-specific instrument should be more capable of detecting subtle improvements in health resulting from treatment while a generic instrument is more applicable when measuring the complete spectrum of function, disability, and disease that is relevant to quality of life. Generally, the use of both generic and disease-specific measures in quality of life studies is preferable. To our knowledge, none of the previous studies have simultaneously examined the effects of generic and disease-specific quality of life measures on mortality in diabetic patients. The objective of the present study was to examine the effects of generic and disease-specific quality of life measures on mortality in a Taiwanese, outpatient-based, diabetic sample.
3
Methods
Study SubjectsDuring the period 1998-2000, a Diabetes HRQOL study was conducted, consisting of 510 diabetes outpatients recruited from China Medical University Hospital (CMUH). Outpatients with a diagnosis of DM (International Classification Disease, Ninth Revision, Clinical Modification, abbreviated as ICD-9-CM; Code of 250) were included in this study. Predominantly, subjects received oral hypoglycemic agents as treatment. Those who agreed to participate signed the consent forms and were interviewed by our trained interviewers during their outpatient visits. Their mean age was 62.98 years, with a standard deviation of 9.95 years, and 67.25% of them were female. Information regarding hemoglobin A1C, blood glucose levels before and after meals, creatinine, urine protein, electrocardiogram readings, conduction deficit, and brain computed tomography (CT), was abstracted from hospital records.
HRQOL Measures
The Diabetes Impact Measurement Scale (DIMS) is a measure of HRQOL in type I and type II adult diabetic patients. The scale was developed after a literature review, and its domains included symptoms, diabetes-related morale (attitude towards managing the disease), social role fulfillment, and well-being. The scale requires 15-20 minutes to complete. Items are scored according to the selected response, with high values representing less severe or less frequent symptoms, greater morale, greater social role fulfillment, and greater well-being. Item responses were simply summed. The processes used in the translation of the Chinese version DIMS have been reported (19). Validation of the DIMS in our baseline survey suggests that Chinese DIMS is a reliable and valid instrument, and appropriate in clinical settings for Chinese with diabetes.
The SF-36 is a short questionnaire with 36 items measuring eight multi-item variables: physical functioning (PF, 10 items), social functioning (SF, 2 items), role limitations due to physical problems (RP, 4 items), role limitations due to emotional problems (RE, 3 items), mental health (MH, 5 items), vitality (VT, 4 items), bodily pain (BP, 2 items), and general perception of health (GH, 5 items) (20). A further unscaled single item measures changesin respondent‘health over the past year. For each variable item, scores are coded, summed, and transformed to a scale from 0 (worst possible health state measured by the questionnaire) to 100 (best possible health state). For the SF-36, a high score indicates a better health state. In addition, the SF-36 Physical (PCS) and Mental (MCS) Component Summary scales were derived following the standard SF-36 scoring algorithms (21).
The Vital Status Ascertainment of all patients through December 2003 was determined via yearly linkage with the National Death Index (1998-2003). The precise date of death along with the date of entry was used to calculate the event time. Those who did not die were defined as censored.
Diabetes Status at Baseline
The baseline diabetes status was determined by the information abstracted from hospital records within 4 months of entry date. The information consisted of a physical examination by a clinic physician, a blood sample by venipuncture from an antecubital vein, and measurement of the blood pressure. Individuals with signs and symptoms of cardiac or peripheral neuropathic abnormalities, an exercise or resting electrocardiogram, and echocardiogram were evaluated.
Blood chemistry analyses were performed in the Clinical Laboratory of CMUH by a biochemical autoanalyser (Beckman Coluter, Lx-20, USA). Diabetic
control was measured by hemoglobin A1C (glycosylated hemoglobin), using Boronate affinity and high-performance liquid chromatography (HPLC) (reference range 4.6-6.5%). The inter- and intra-assay coefficients of variation (CV) for HbA1C were 2.91% for a normal level, 1.79% for an intermediate level, and 1.09% for a high level. Urinary creatinine (Jaffe’s kinetic method) and albumin (colorimetyl BCP) were also measured on the autoanalyser. The inter-assay precision CV was <3.0% for both creatinine and albumin concentrations. The lowest detection limit was <10 mg/dL for urinary creatinine and <1 g/dL for albumin. Blood pressure measurements were obtained using mercury manometers. Duration of diabetes was defined as the time interval between the time point of first diagnosis and the time point of being recruited.
The electrocardiogram (EKG) readings (Cardiovit AT10, Schiller, Switzerland) determined ischemic change. Ischemic change was defined as: EKG readings of an abnormal ST-T wave (or non-specific ST-T change); elevation or depression of the isoelectric segment following ventricular depolarization and preceding ventricular repolarization, measured from the end of the QRS complex to the beginning of the T wave; left ventricular hypertrophy (LVH) with strain, manifesting primarily as an increase in voltage (height of R wave) in those EKG leads that reflect left ventricular potentials; suspected ischemia; old myocardial infarction (MI) (code 412.00 from ICD-9), with a negative Q wave in those EKG leads; and acute myocardial infarction (AMI) (code 410.90 from ICD-9), with a negative Q wave and S-T segment elevation in those leads.
Neuropathy was determined by conduction deficit, which was measured by Nerve Conduction Velocity (Keypoint, Danfec, Denmark). Subjects classified as radiculopathy, mononeuropathy, and polyneuropathy were defined as having neuropathy. Retinopathy was evaluated by a fundus check-up by a physician. Skin ulcer was also determined by physician check-up.
Statistical Analysis
To assess the association of the DIMS and SF-36 scales, we used Cox’sproportional hazards models to estimate the relative risk of mortality. First, we calculated the quartiles of the DIMS and SF-36 scales (RP, SF, and RE scales of the SF-36 were dichotomized due to having the same values for some quartiles) and evaluated the crude risk of mortality separately for each scale, using Cox’s proportional hazards models, then, added age, gender, glucose control and complication (retinopathy, neuropathy, nephropathy, skin ulcer, and ischemic change). Second, we used the continuous variables of the DIMS and SF-36 scales to test linear trends. Finally, we examined simultaneously the association of the DIMS and two SF-36 summary scales to mortality. The PHREG of SAS 8.02 was used to fit the proportional hazards
models.
Results
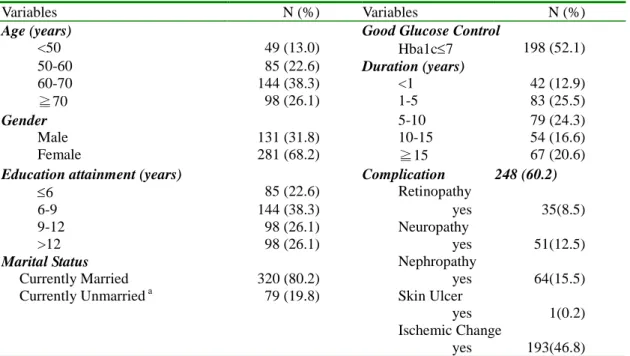
From August 1998 to March 2000, 510 patients were enrolled in the study. Since a personal identification number was needed to link with the National Death Index, those who didn’t provide a personal identification number or had missing information on the DIMS or SF-36 were excluded (n=90). The characteristics of 412 patients are shown in Table 1. A plurality of the study population was aged 60-70 years old (38.3%), and the group was predominantly female (68.2%). About half of them had good glucose control (52.1%) and 37.2% had more than 10 years of diabetes.
Overall complication prevalence was 60.2%. Specific complication conditions included retinopathy (8.5%), neuropathy (12.5%), nephropathy (15.5%), skin ulcer
5
(0.2%), and ischemic change (46.8%).
Table 1. Distributions of age, gender, complications, glucose control and co-morbidity in the study sample.
Variables N (%) Variables N (%)
Age (years) Good Glucose Control
<50 49 (13.0) Hba1c7 198 (52.1) 50-60 85 (22.6) Duration (years) 60-70 144 (38.3) <1 42 (12.9) ≧70 98 (26.1) 1-5 83 (25.5) Gender 5-10 79 (24.3) Male 131 (31.8) 10-15 54 (16.6) Female 281 (68.2) ≧15 67 (20.6)
Education attainment (years) Complication 248 (60.2)
6 85 (22.6) Retinopathy
6-9 144 (38.3) yes 35(8.5) 9-12 98 (26.1) Neuropathy
>12 98 (26.1) yes 51(12.5)
Marital Status Nephropathy
Currently Married 320 (80.2) yes 64(15.5) Currently Unmarrieda 79 (19.8) Skin Ulcer
yes 1(0.2) Ischemic Change
yes 193(46.8)
a
Currently unmarried category includes single, separate or divorce, and windowed. We documented 44 all-cause deaths during 16748 person-months (15760 for survivors and 988 for decreased participants) of follow-up from 1998 to 2003. For the SF-36, PF, BP, GH, VT, MH, PCS and MCS scales at baseline were used to classify patients into 4 categories, based on their quartiles, and RP, SF, and RE scales into binary categories. PF, GH, VT, SF, MH, and MCS scales were strong univariate predictors of all-cause mortality (Table 2). After controlling for age, gender, glucose control, and complication, GH, and MH had a significant graded relationship with an increasing risk of all-cause mortality. Compared with patients whose scores were higher than the third quartile, those whose scores were below or equal to the first quartile had a relative risk (RR) of 3.60 (95% confidence interval [CI], 1.17-11.07; p for trend 0.02) for GH and 3.62 (95% CI, 1.18-11.05; p for trend 0.03) for MH.
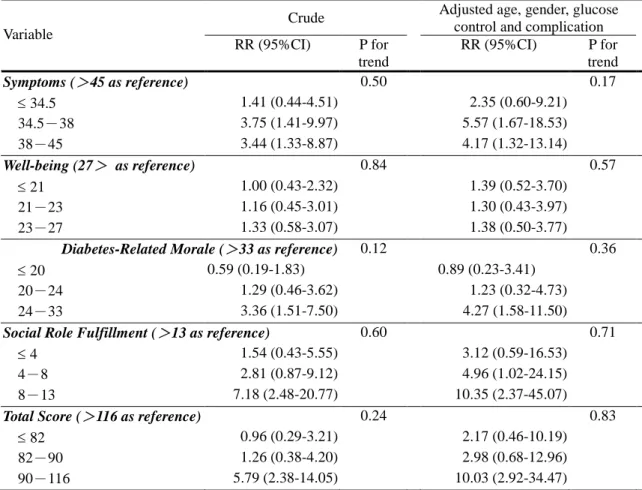
Similarly, symptoms, well-being, diabetes-related morale, social role fulfillment, and total score of the DIMS were categorized into 4 categories, based on their
quartiles. Symptoms, diabetes-related morale, social role fulfillment, and total score were significant predictors of mortality. After adjustment, they remained significant predictors. Compared with patients whose symptom scores were greater than 45, those whose symptom scores were 34-38, and 38-45 had RRs of 5.57 (95% CI, 1.67-18.53), and 4.17 (95% CI, 1.32-13.14), respectively; compared with patients whose diabetes-related morale scores were greater than 33, those whose
diabetes-related morale scores were 24-33 had a RR of 4.27 (95% CI, 1.58-11.50); compared with patients whose social role fulfillment scores were greater than 13, those whose social role fulfillment scores were 4-8, and 8-13 had RRs of 4.96 (95% CI, 1.02-24.15), and 10.35 (95% CI, 2.37-45.07), respectively; and compared with patients whose total scores were greater than 116, those whose total scores were 90-116 had RR of 10.03 (95% CI, 2.92-34.47).
Table 2. Crude and adjusted relative risks of five-year mortality for 10 scales of the Short-Form 36 amongst individuals with non-insulin-dependent diabetes
mellitus.
Crude Adjusted age, gender, glucose control and complication Variable
RR (95%CI) P for trend
RR (95%CI) P for trend
PF (>95 as reference) 0.01 0.04 70 3.02 (1.13-8.05) 3.19 (0.84-12.12) 70-85 1.05 (0.34-3.20) 1.43 (0.34-5.97) 85-95 1.22 (0.43-3.52) 1.51 (0.39-5.82) RP (=100 as reference) 0.43 (0.06-3.13) - 0.49 (0.07-3.67) -BP (=100 as reference) 0.64 0.56 72 1.12 (0.59-2.11) 0.77 (0.36-1.66) 72-84 1.12 (0.42-2.99) 1.11 (0.36-3.40) 84-99 0.31 (0.04-2.31) 0.49 (0.06-3.72) GH (>65 as reference) 0.00 0.02 GH35 4.12 (1.55-10.96) 3.60 (1.17-11.07) 35-53.5 1.37 (0.43-4.32) 1.44 (0.38-5.47) 53.5-65 1.82 (0.63-5.24) 1.95 (0.60-6.38) VT (>75 as reference) 0.02 0.17 VT50 3.65 (1.25-10.64) 3.10 (0.89-10.83) 50-60 2.26 (0.68-7.51) 1.31 (0.29-5.88) 60-75 2.57 (0.82-8.08) 2.91 (0.80-10.51) SF (>75 as reference) - -75 1.84 (1.02-3.33) 1.33 (0.67-2.67) RE (=100 as reference) 1.47 (0.71-3.06) - 1.25 (0.52-3.05) -MH (>88 as reference) 0.02 0.03 60 3.00 (1.20-7.47) 3.62 (1.18-11.05) 60-76 0.93 (0.31-2.76) 1.12 (0.30-4.19) 76-88 1.59 (0.58-4.38) 2.06 (0.63-6.72) PCS (> 53.0230 as reference) 0.10 0.60 40.5040 2.01 (0.90-4.52) 1.20 (0.45-3.18) 40.5040-47.6129 0.86 (0.33-2.23) 0.90 (0.31-2.61) 47.6129-53.0230 1.06 (0.43-2.60) 0.82 (0.28-2.40) MCS (> 56.8353 as reference) 0.04 0.07 46.6206 2.77 (1.14-6.70) 2.45 (0.95-6.33) 46.6206-52.2940 1.37 (0.51-3.70) 1.41 (0.49-4.06) 52.2940-56.8353 1.75 (0.68-4.54) 1.43 (0.50-4.13)
To examine further whether the relationship between DIMS and mortality is independent of SF-36, or the relationship between SF-36 and mortality is independent of DIMS, we performed a multivariate proportional hazards model by simultaneously including two summary scales of the SF-36 and 4 scales of the DIMS (Table 4). The SF-36 scales of GH and MH that were significant in previous analyses, were not statistically significant at this analysis, therefore, two summary scales of the SF-36 were entered into the final model, instead of the GH and MH scales. Symptoms and social role fulfillment were significant independent predictors of mortality. Compared with patients whose symptom scores were greater than 45, those whose symptom scores were 34-38, and 38-45 had RRs of 13.10 (95% CI, 2.75-62.5) and 5.49 (95% CI, 1.50-20.09), respectively. The corresponding RRs were greater than the previous ones, suggesting that the increase in risk was mainly due to the elimination of confounding by the SF-36 scales. Compared with patients whose social role fulfillment scores were greater than 13, those whose social role fulfillment scores
7
were 4-8 and 8-13 had RRs of 6.18 (95% CI, 1.10-34.87) and 6.53 (95% CI, 1.40-30.57), respectively.
Table 3. Crude and adjusted relative risks of five-year mortality for 4 scales and total score of the Diabetes Impact Measurement Scale amongst individuals with non-insulin-dependent diabetes mellitus.
Crude Adjusted age, gender, glucose control and complication Variable RR (95%CI) P for trend RR (95%CI) P for trend Symptoms (>45 as reference) 0.50 0.17 34.5 1.41 (0.44-4.51) 2.35 (0.60-9.21) 34.5-38 3.75 (1.41-9.97) 5.57 (1.67-18.53) 38-45 3.44 (1.33-8.87) 4.17 (1.32-13.14) Well-being (27> as reference) 0.84 0.57 21 1.00 (0.43-2.32) 1.39 (0.52-3.70) 21-23 1.16 (0.45-3.01) 1.30 (0.43-3.97) 23-27 1.33 (0.58-3.07) 1.38 (0.50-3.77)
Diabetes-Related Morale (>33 as reference) 0.12 0.36
20 0.59 (0.19-1.83) 0.89 (0.23-3.41) 20-24 1.29 (0.46-3.62) 1.23 (0.32-4.73) 24-33 3.36 (1.51-7.50) 4.27 (1.58-11.50)
Social Role Fulfillment (>13 as reference) 0.60 0.71
4 1.54 (0.43-5.55) 3.12 (0.59-16.53) 4-8 2.81 (0.87-9.12) 4.96 (1.02-24.15) 8-13 7.18 (2.48-20.77) 10.35 (2.37-45.07)
Total Score (>116 as reference) 0.24 0.83
82 0.96 (0.29-3.21) 2.17 (0.46-10.19) 82-90 1.26 (0.38-4.20) 2.98 (0.68-12.96) 90-116 5.79 (2.38-14.05) 10.03 (2.92-34.47)
Discussion
This study shows that generic and disease-specific quality of life measures strongly predicted mortality in a cohort of persons with diabetes. After adjustment for age, gender, diabetic control, and complication status, the groups with the lowest quality of life quartile had a 260% to 935% higher risk of death than the reference group.
These associations for generic measures were explained by disease-specific measures while disease-specific measures remained significant predictors after generic
measures were taken into account. Clear downward J-shaped relationships were found for disease-specific measures from “worst”through “middle”to “best”quality of life in relation to all-cause mortality.
The association between the symptom scale of the DIMS and mortality might be due to this symptom measure capturing a variation of disease severity that glucose control and complication could not capture. As for the association between the social role fulfillment scale of the DIMS and mortality, certain conditions limit one’s social role fulfillment, and these conditions can also lead to mortality. However, after adjusting for glucose control and complication, something still seems
unexplained.
Table 4. Multivariate relative risks of five-year mortality for two summary scales of the Short Form 36 and 4 scales of the Diabetes Impact Measurement Scale amongst
individuals with non-insulin-dependent diabetes mellitus.
Adjusted age, gender glucose control and complications
Variable
RR (95%CI) P for trend
PCS (> 56.7005 as reference) 0.98 50.3259 0.29 (0.09-0.95) 50.3259-54.6471 0.40 (0.13-1.27) 54.6471-56.7005 0.47 (0.14-1.51) MCS (> 55.0791 as reference) 0.11 46.7003 0.73 (0.23-2.32) 46.7003-51.8617 0.68 (0.21-2.17) 51.8617-55.0791 1.22 (0.38-3.90)
Scores of the DIMS
Symptoms (>45 as reference) 0.23 34 5.42 (0.99-29.69) 34-38 13.10 (2.75-62.50) 38-45 5.49 (1.50-20.09) Well-being (27> as reference) 0.60 21 0.67 (0.21-2.15) 21-23 0.88 (0.23-3.34) 23-27 0.67 (0.22-2.08)
Diabetes-Related Morale (>33 as reference) 0.03
20 0.21 (0.04-1.19) 20-24 0.32 (0.06-1.64) 24-33 2.37 (0.71-7.91)
Social Role Fulfillment (>13 as reference) 0.43
4 3.30 (0.48-22.50) 4-8 6.18 (1.10-34.87) 8-13 6.53 (1.40-30.57)
The persistent effect of disease-specific quality of life measures on mortality amongst persons with diabetes, despite extensive disease severity controls, may be due to the inability of medical and social science to adequately model the complex, chronic, multiple interacting illnesses. The findings of our study do provide evidence that quality of life measures add finer-graded information about health related to survival. The predictive power of these measures confirms the importance of the centrality of the patient point of view - that is, what people say about themselves to health professionals - in monitoring the quality of medical care outcomes.
A number of limitations should be noted in interpreting the results of this study. The diabetic patients in this study were recruited during their office visits and had relatively better glucose control. The predictive ability of the DIMS might be less in a diabetic population representing a more severe spectrum of disease. This might limit the generalizability of the results, but should not affect the internal validity. In addition, there exists the possibility of a SF-36 and DIMS measurement error. This kind of measurement error might be random or differential. If such a measurement error is independent of mortality, i.e., due to random error, the biased results in the effect may be toward the null, a lesser threat to validity. If the errors are not
independent of mortality, i.e., differential error, the bias will result in an exaggeration or underestimation of an effect. However, there is no strong likelihood for assuming that the measurement error of the SF-36 or DIMS is differential, thus the possibility of measurement error jeopardizing the validity of our results should be small.
In conclusion, HRQOL provides additional clinical information regarding disease course and outcome that is not captured by traditional indexes of clinical
9
status. Scales of SF-36 and DIMS were strong predictors of mortality amongst persons with diabetes, and their predictive power was only slightly explained by age, gender, glucose control, and complication. When both SF-36 and DIMS scales were considered, only symptom and social role fulfillment scales exerted an independent effect on mortality. The results show the clinical importance of the HRQOL and may facilitate interpretation by clinicians.
References
1. Bullinger M, Anderson R, Cella D, and Aaronson N. Developing and evaluating cross-cultural instruments from minimum requirements to optimal models.
Quality of Life Research, 1993; 2:451-9.
2. Hanestad BR, Albrektsen G. Quality of life, perceived difficulties in adherence to a diabetes regimen, and blood glucose control. Diabetic Med 1991; 8:
759-764.
3. O’ConnorPJ,Jacobson AM. Functionalstatusmeasurementin elderly diabetic patients. Clin Geriatr Med 1990;6:865-882.
4. Menec VH, Chipperfield JG, Perry RP. Self-perceptions of health: A prospective analysis of mortality, control, and health. Journal of Gerontology: Psychological
sciences 1999; 54B (2): 85-93.
5. McCallum J, Shadbolt B & Wang D. Self-rated health and survival: A 7-year follow-up study of Australian elderly. American Journal of Public Health 1994; 84, 1100-1105.
6. Borawski EA, Kinney JM & Kahana E. The meaning of older adults’health appraisals: Congruence with health status and determinant of mortality. Journal of Gerontology: Social Sciences, 1996; 51B, S157-S170.
7. Grant MD, Piotrowski ZH, Chappell R. Self-reported health and survival in the Longitudinal Study of Aging, 1984-1986. J Clin Epidemiol 1995; 48:375-87. 8. Miilunpalo S, Vuori I, Oja P, et al. Self-rated health status as a health measure:
the predictive value of self-reported health status on the use of physician
services and on mortality in the working-age population. J Clin Epidemiol 1997; 50:517-28.
9. Sundquist J, Johannson SE. Self reported poor health and low educational level predictors for mortality: a population-based follow-up of 39,156 people in Sweden. J Epidemiol Community Health 1997;51:35-40..
10. Heistaro S, Jousilahti P, Lahelma E, Vartiainen E, Puska P. Self-rated health and mortality: a long-term prospective study in eastern Finland. J Epidemiol
Community Health 2001; 55:227-232.
11. Dasbach EJ, Klein R, Klein BE, et al. Self-rated health and mortality in people with diabetes. Am J public Health 1994;84:1775-9.
12. Sprenkle MD. Niewoehner DE. Nelson DB. Nichol KL. The Veterans Short Form 36 questionnaire is predictive of mortality and health-care utilization in a population of veterans with a self-reported diagnosis of asthma or COPD. Chest 2004; 126(1):81-9.
13. Domingo-Salvany A. Lamarca R. Ferrer M. Garcia-Aymerich J., et al. Health-related quality of life and mortality in male patients with chronic
obstructive pulmonary disease. American Journal of Respiratory & Critical Care Medicine. 2002; 166(5):680-5.
14. Konstam V. Salem D. Pouleur H. Kostis J, Gorkin L, et al. Baseline quality of life as a predictor of mortality and hospitalization in 5,025 patients with congestive heart failure. SOLVD Investigations Studies of Left Ventricular Dysfunction Investigators. Am J of Cardio 1996; 78(8):890-5.
15. Bosworth HB. Siegler IC. Brummett BH. Barefoot JC, et al. The association between self-rated health and mortality in a well-characterized sample of coronary artery disease patients. Medical Care. 1999; 37(12):1226-36. 16. Rumsfeld JS, MaWhinney S, McCarthy M Jr., Shroyer AL, VillaNueva CB,
O’Brien M et al. Health-related quality of life as a predictor of mortality following coronary artery bypass graft surgery. Participants of the Department of Veterans Affairs Cooperative Study Group on Processes, Structures, and Outcomes of Care in Cardiac Surgery. JAMA 1999, 281:1298-1303.
17. Mapes DL. Lopes AA. Satayathum S. McCullough KP. Goodkin DA. Locatelli F, et al. Health-related quality of life as a predictor of mortality and hospitalization: the Dialysis Outcomes and Practice Patterns Study (DOPPS). Kidney
International. 2003; 64(1):339-49.
18. Dominick KL, Ahern FM, Gold CH, Heller DA. Relationship of health-related quality of life to health care utilization and mortality among older adults. Aging-Clinical & Experimental Research. 2002; 14(6): 499-508.
19. Li, T.C., Lin, C.C., Li, C.I. Validation of the Chinese-version Diabetes Impact Measurement Scales Among People with Diabetes. Quality of Life Research 2003; 12 (12): 804.
20. Ware JE., Snow K.K., Kosinski M. and Gandek B. SF-36 Health Survey.
Manual and Interpretation Guide. New England Medical Center, Boston,
1993.
21. Ware JE. SF-36 Physical and Mental Health Summary Scales: A User’s Manual. Boston: Health Assessment Lab, New England Medical Center; 1994, 5th
printing.
22. Eisdorfer,Carland FrancisWilkie.“Stress, Disease, Aging, and Behavior.”In James E. Birren and K. Warner Schaie (Eds), Handbook of the Psychology of Aging. New York: Van Nostrand Reinhold.
計畫成果自評
本研究原計畫之目的主要探討控制了性別、年齡與糖尿病於研究起始點之 狀態後,一般性生活品質量表與死亡間之相關,此目的完全符合原來計畫書之目 的,達到預期目標情況,不僅如此,並將糖尿病疾病別之生活品質也一併納入考 量,使得在探討生活品質與死亡間相關之考量更加完整。