A novel method for estimating the focal size of two confocal
high-intensity focused ultrasound transducers
Wen-Shiang Chen
Department of Physical Medicine and Rehabilitation, National Taiwan University Hospital, Taipei 100, Taiwan and Department of Mechanical Engineering, National Taiwan University, Taipei 106, Taiwan
Ping-Mo Ma
Department of Mechanical Engineering, National Taiwan University, Taipei 106, Taiwan
Hao-Li Liu
Department of Electronic Engineering, Tung-Nan Institute of Technology, Taipei, Taiwan
Chih-Kuang Yeha)
Department of Electrical Engineering, Yuan Ze University, Taoyuan 320, Taiwan
Min-Shin Chen
Department of Mechanical Engineering, National Taiwan University, Taipei 106, Taiwan
Chein-Wei Chang
Department of Physical Medicine and Rehabilitation, National Taiwan University Hospital, Taipei 100, Taiwan
共Received 7 November 2004; revised 4 March 2005; accepted 15 March 2005兲
Estimating the focal size and position of a high-intensity focused ultrasound 共HIFU兲 transducer remains a challenge since traditional methods, such as hydrophone scanning or schlieren imaging, cannot tolerate high pressures, are directional, or provide low resolution. The difficulties increase when dealing with the complex beam pattern of a multielement HIFU transducer array, e.g., two transducers facing each other. In the present study we show a novel approach to the visualization of the HIFU focus by using shockwave-generated bubbles and a diagnostic B-mode scanner. Bubbles were generated and pushed by shock waves toward the HIFU beam, and were trapped in its pressure valleys. These trapped bubbles moved along the pressure valleys and thereby delineated the shape and size of the HIFU beam. The main and sidelobes of 1.1- and 3.5 MHz HIFU beams were clearly visible, and could be measured with a millimeter resolution. The combined foci could also be visualized by observing the generation of sustained inertial cavitation and enhanced scattering. The results of this study further demonstrate the possibility of reducing the inertial cavitation threshold by the local introduction of shock wave-generated bubbles, which might be useful when bubble generation and cavitation-related bioeffects are intended within a small region in vivo. © 2005 Acoustical Society of America. 关DOI: 10.1121/1.1904283兴
PACS numbers: 43.58.Vb, 43.25.Cb, 43.35.Ei关RR兴 Pages: 3740–3749
I. INTRODUCTION
The minimally invasive nature of high-intensity focused ultrasound 共HIFU兲 has been a focus of several recent thera-peutic applications, especially tumor ablation.1–5 The tem-perature of the target tissue at the focus of a HIFU transducer can increase to more than 65 °C within seconds, thus causing protein denaturing and cell death. However, the success of HIFU tumor ablation largely depends on the knowledge of the focusing properties of the treatment system, making tech-niques for quantitatively measuring the focal position and size essential.
Typical tools for measuring the position and size of a HIFU transducer are hydrophone scanning and schlieren op-tical imaging.6A computer-controlled scanning system with
a needle or membrane hydrophone can accurately determine the position, size, and pressure amplitude of the main and sidelobes of a HIFU sound field. Although a very fine reso-lution can be achieved, the scanning process is time consum-ing and the alignment of the hydrophone to the HIFU trans-ducer is critical to the accuracy of the measurements. Moreover, the hydrophone is fragile and quickly saturated at high pressures, and the calibration of a hydrophone in a mul-tielement HIFU system becomes difficult due to the acoustic waves coming from several sources differing greatly in their incoming angles. Schlieren optic imaging provides an over-view of the shape and location of a HIFU focus as well as sidelobes and secondary foci. However, the resolution is low and thus the obtained results are more qualitative than quan-titative.
In this article we report a novel method for estimating the position and size of the focus of a 1.1 or 3.5 MHz HIFU transducer. The shapes and sizes of the main and sidelobes can be determined in a reasonably short time and with a high resolution. Furthermore, the changes in shape and pressures a兲For correspondence: Dr. Chih-Kuang Yeh, Department of Electrical
Engi-neering, Yuan Ze University, 135 Yuan-Tung Rd., Chung-Li, 320 Taoyuan, Taiwan. Telephone: 8800, ext. 2438 共voice兲; ⫹886-3-463-9355共fax兲; electronic mail: [email protected]
where the foci of the two transducers intersect are also de-termined.
II. EXPERIMENTAL MATERIALS AND METHODS A. Experimental setup
The experiments were performed in an acrylic tank 共23 cm L⫻15 cm W⫻15 cm H兲 filled with tap water. The ex-perimental system consisted of four transducers共1.1 and 3.5 MHz HIFU transducers; H-101 and SU-102, Sonic Concepts, Woodinville, USA兲, a shock wave transducer 共Piezoson 100 with a FB7 G2 probe, Richard Wolf, Knittlingen, Germany兲 for producing bubbles, and a diagnostic B-mode scanner 共Ti-tan with a L38 probe, Sonosite, Bothell, USA兲 for imaging. The L38 is a 5–10 MHz broadband transducer with a central frequency of 7.5 MHz. The focus of the probe used with the shock wave generator was 1.7 mm in diameter and 6.7 mm in length, while the focal length was 20 mm from the edge plane of the probe 共data from the manufacturer兲. The diam-eters and focal lengths of the 1.1 and 3.5 MHz transducers are listed in Table I. The 1.1 MHz HIFU and the shock wave transducers were positioned orthogonally on two adjacent walls of the water tank, as shown in Fig. 1. For experiments on the combined beam pattern of two HIFU transducers, the second HIFU transducer共3.5 MHz兲 was mounted on the wall
facing the 1.1 MHz HIFU transducer with their central axes parallel to each other but separated by about 4 mm. The B-mode probe scanned from the top of the water tank paral-lel to the axial direction of the shock wave transducer, i.e., cutting through the HIFU beam. The HIFU transducers were both mounted on 3-D positioners that allowed precise move-ment control.
The pressure values of the HIFU transducers were cal-culated from hydrophone 共Onda, Sunnyvale, USA兲 pressure measurements performed in water at low output amplitudes that were linearly extrapolated to higher outputs. The peak negative pressures at the focus of the 1.1 MHz transducer were 1.62 and 5.88 MPa for outputs of 100 and 400 mV from the function generator, respectively. The peak negative pres-sure of the 3.5 MHz transducer was around 3 MPa at the focal point. Two arbitrary function generators共33120A, Agi-lent, Palo Alto, USA; and DS345, Stanford Research Sys-tems, Sunnyvale, USA兲 and two power amplifiers 共150A250B and 150A100B, Amplifier Research, Souderton, USA兲 were used to drive the 3.5 and 1.1 MHz HIFU trans-ducers, respectively. The pulse repetition frequency 共PRF兲 was 500 Hz, and the pulse length was 100 cycles for both transducers. A clinical shock wave generator was used to induce inertial cavitation and generate bubbles, and was set to its highest output level 共20, the corresponding peak nega-tive pressure provided by the manufacturer was 19.0 MPa兲 and the highest PRF共4 Hz兲 for maximal bubble production. The beam-pattern images obtained by the diagnostic B-mode scanner were recorded on a VCR and off-line processed frame-by-frame using commercial software 共Premiere Pro 1.5, Adobe Systems, San Jose, USA; Matlab, The Math-Works, Natick, USA兲.
B. Experimental procedures
1. Series 1. Beam pattern of a single HIFU transducer In order to test the feasibility of using shock wave-generated bubbles to visualize the beam pattern of HIFU transducers, the 1.1 and 3.5 MHz transducers were first tested individually. The 1.1 MHz HIFU transducer was driven at either 100 or 400 mV and moved along its axial direction at a step size of 1 or 2 mm, respectively. The shock wave generator produced and pushed bubbles toward the HIFU beam while B-mode images were taken continuously. After finishing ‘‘slicing’’ along the HIFU beam, the B-mode imaging plane was aligned with the HIFU focal plane again, and B-mode and color Doppler images were both taken. The output of the 1.1 MHz HIFU transducer was increased until enhanced scattering due to inertial cavitation at the center of the HIFU beam was induced. The beam pattern of the 3.5 MHz transducer was determined in a similar way.
2. Series 2. Simulation
To understand the beam profiles obtained in the above experiments, simulations were performed by modeling the 1.1 MHz HIFU transducer as a collection of point sources in a grid. For any point on the destination plane共fixed z value兲, TABLE I. Simulation parameters.
Frequency共f兲 1.1 MHz 3.5 MHz
Transducer radius 32 mm 17.5 mm
Geometric focus共data from the manufacturer兲 62.64 mm 55 mm Attenuation 0 Np/cm 0 Np/cm Sound speed共c兲 1500 m/s 1500 m/s Wavelength共兲 1.364 mm 0.429 mm Grid size Field 0.1 mm 0.1 mm
Transducer (⌬x and ⌬y) 0.164 mm 0.164 mm
the following Rayleigh–Sommerfold integral7 was used to calculate the relative pressure amplitude contributed by each grid point of the source transducer:
p共x,y,z兲⫽ick 2
冕
Sue⫺ik共r⫺r⬘兲
r⫺r
⬘
dS, 共1兲where i⫽
冑
⫺1, ⫽tissue density, c⫽sound speed, k⫽wave number (k⫽2/, is the wavelength, and c⫽ f , where f is sound frequency兲, u⫽complex surface velocity of source, and r⫺r⬘
⫽distance between a certain point on the trans-ducer surface to a certain point in the acoustic field. For more efficient and convenient calculations, the above equation was simplified top共x,y,z兲⫽i AMP⌬x ⌬y
2
兺兺
e⫺ik共r⫺r⬘兲
r⫺r
⬘
. 共2兲 The amplitude of the simulated pressure field is relative when AMP is set to 1, and⌬x and ⌬y are the step sizes in the x and y directions. The parameters used in the simulation program are listed in Table I. The simulated results were then compared with the experimental results共see Sec. III兲. 3. Series 3. Combined beam pattern of two HIFU transducersThe major challenge in beam-pattern plotting is encoun-tered during the testing of a multielement transducer 共espe-cially when the elements are at large angles to each other兲. To demonstrate the advantages of our newly developed method, two HIFU transducers 共one 1.1 and the other 3.5 MHz兲 were arranged facing each other, but with a 4 mm distance between their parallel central axes on purpose. The 3.5 MHz transducer was turned on first since its focal pattern was small and difficult to determine. The obtained B-mode images of the overlapping beam pattern were recorded and analyzed offline.
III. RESULTS
A. Beam pattern of a single HIFU transducer
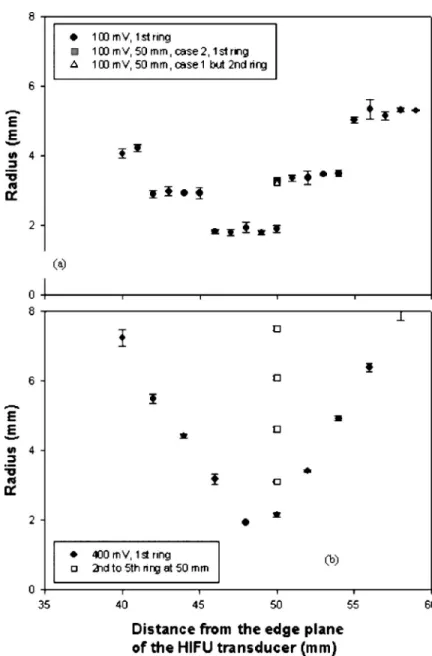
To rapidly determine the focal size and location of a HIFU beam, the HIFU transducer was moved along its axial direction while B-mode images were taken sequentially. Fig-ure 2共a兲 shows one of the recorded images near the focus of a 1.1 MHz HIFU beam. When bubbles produced by the shock wave transducer were pushed toward the HIFU beam, a few concentric rings共white rings兲 appeared where bubbles were trapped and moved along the rings, which clearly visu-alized the locations of the pressure valleys around the HIFU focus 共Fig. 3兲. The diameter of the central dark region was smaller for the 3.5 MHz transducer than for the 1.1 MHz transducer共Fig. 4兲. The radius of the first ring, which can be easily measured, was the radius of the first zero of the acous-tic beam, and thus was larger than the focal radius共usually defined as being 6 dB below the maximum pressure兲 of the HIFU beam. In other words, the focal radius should be smaller than the diameter of measured radius of the first ring, 1.6 mm in Fig. 5共a兲. The number of visible rings increased with the pressure level 关Fig. 2共b兲 and Fig. 5兴, whereas the diameter of the first ring was the same for low关Fig. 5共a兲兴 and
high 关Fig. 5共b兲兴 pressures. The minimum diameter of the central dark region occurred 48 mm from the edge plane of the 1.1 MHz HIFU transducer 关Figs. 5共a兲 and 5共b兲兴. At a low-pressure condition, ‘‘radius steps’’ were seen at a few positions, e.g., 40– 41, 42– 45, 46 –50, 50–54, and 55–59 mm 关Fig. 5共a兲兴. At the transition from one step to the next one, the measured radii could be either at the upper ‘‘step’’ 共case 2兲 or the lower ‘‘step’’ 共case 1兲. The radius of the second ring共white triangle兲 for case 1 coincided with that of the first ring for case 2 共gray square兲.
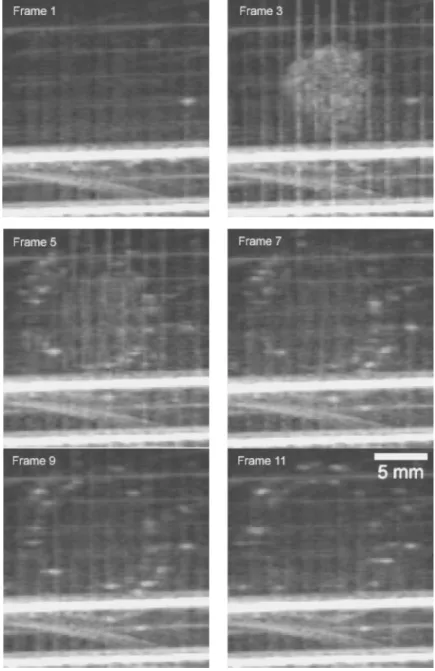
Bubbles for visualizing the beam pattern of a HIFU transducer can be provided by means other than a shock wave transducer. Figure 6 shows the bubbles generated at the center of the HIFU focus by inertial cavitation at higher pres-sure levels共frame 3兲 that visualize the first and second rings of the HIFU beam when they moved outward. However, compared to the bubbles generated by a shock wave trans-FIG. 2. 共a兲 A B-mode image of the beam pattern of a 1.1 MHz HIFU transducer near its focus. The output from the function generator is 100 mV 共producing a peak negative pressure of 1.62 MPa兲. The vertical white line was produced by a shock wave pulse.共b兲 A B-mode image of the beam pattern of a 1.1 MHz HIFU transducer at the same position as共a兲, but for a higher voltage output from the function generator 共400 mV, 5.88 MPa兲. More rings are clearly evident.
ducer, bubbles from the HIFU focus lasted for a shorter time and thus were probably smaller. Figure 7 shows a Doppler image of the bubbles generated by a HIFU transducer. An oscillating ball with rapidly changing color was evident at the focus of the HIFU transducer, which is indicative of the fast phase change in backscattered signals due to the genera-tion and collapse of bubbles by inertial cavitagenera-tion. This phe-nomenon was sometimes called the pseudo-Doppler shift and has been used to produce images of ‘‘stimulated acoustic emission.’’8
B. Matching experimental and simulated results In order to elucidate the physical meaning of the experi-mental results, the beam patterns of both 1.1 and 3.5 MHz HIFU transducers were simulated and compared to the rings evident on the B-mode images. In Fig. 8, it is clear that the white rings of the 1.1 MHz HIFU beam matched well with the location of the pressure valleys measured using a needle hydrophone. It is worth noting that the pressures at the val-leys were not zero. The measured pressure might be the sum FIG. 3. A group of bubbles共white solid arrow兲 is mov-ing along the third pressure valley共the third ring兲 of the 1.1 MHz HIFU beam. The acoustic parameters used in this test was 100 mV output from the function genera-tor, pulse length⫽100 cycles, and PRF⫽500 Hz. The B-mode imaging slice cut through the focal plane of the HIFU transducer 共48 mm from the transducer’s edge plane兲. In this figure, only frames 5, 7, 10, 14, 18, and 26 are shown for simplicity.
FIG. 4. The focal beam patterns of共a兲 1.1 MHz and 共b兲 3.5 MHz HIFU transducers. The B-mode imaging slice cut through the focal planes of both HIFU transducers. Comparing共a兲 and 共b兲, the focal beam size of the 3.5 MHz transducer is smaller than that of the 1.1 MHz one.
of transmitted and reflected waves from all directions. Fur-thermore, for the 1.1 MHz HIFU transducer, the locations of the dark rings in the images match well the locations of the simulated pressure peaks关Fig. 9共a兲兴. Similarly, the locations of the first white ring coincide well with the location of the second pressure valley for the 3.5 MHz HIFU transducer. The tiny inner ring in the simulation results cannot be seen in the experiment, probably because of the resolution limita-tions of B-mode images关Fig. 9共b兲兴.
C. The combined beam pattern of two HIFU transducers
To understand the beam pattern of two facing transduc-ers, the focal location of each transducer was determined first. The focus of the 1.1 MHz transducer was then moved by adjusting the 3-D positioner to make the focal planes of both the 1.1 and 3.5 MHz beams coincide. The two foci were separated by 4 mm distance on purpose.
The pressure levels of the 1.1 and 3.5 MHz HIFU trans-ducers were both below the pressure threshold to induce in-ertial cavitation of bubbles provided by shock waves.
There-fore, before turning both transducers on, no bubble was generated near the confocal plane of both transducers after the bubbles from the shock waves passed or dissolved. When two transducers were turned on simultaneously, the pressures of both transducers summed up and thus the peak pressure level near the focus of the 3.5 MHz transducer increased. The bubbles from the shock wave transducer probably acted as seeds of inertial cavitation and induced bubble generation. Continuous bubble generation was seen at the intersecting area and could persist up to a few minutes when bubbles from the shock wave generator disappeared for a long time. The enhanced scattering signals of the generated bubbles then clearly demonstrated the location of the intersecting area共Fig. 10兲.
IV. DISCUSSION
In this report we describe the results of a simple and novel method to determine the size and location of HIFU beams. The new method is particularly useful when analyz-ing a transducer array with a complex arrangement, for ex-ample, as used in the noninvasive ablation of a brain tumor FIG. 5. The radii of each ring at共a兲 low- 共100 mV兲 and 共b兲 high-pressure 共400 mV兲 output are shown. The minimum diameter of the 1.1 MHz HIFU transducer occurred 48 mm from the edge plane. At a low-pressure condition, ‘‘radius steps’’ were seen at a few positions, e.g., from 46 to 50 mm and from 50 to 54 mm. At the transition between two steps, e.g., at 50 mm, the mea-sured radii could be either at the upper ‘‘step’’共case 2, gray square兲 or the lower ‘‘step’’ 共case 1, black circle兲. The radius of the second ring共white triangle兲 for case 1 coincided with that of the first ring for case 2共gray square兲. The error bar indicates the size of the standard deviation. At least 3 measurements were performed for each data point.
FIG. 6. The beam pattern of a 1.1 MHz HIFU trans-ducer was visualized by bubbles generated by inertial cavitation 共frame 3兲. Two rings are clearly evident in frames 5–11共550 mV or P⫽8.09 MPa, 100 cycles, 500 Hz PRF兲. The vertical white lines in each frame were produced by the HIFU transducer itself. Only frames 1, 3, 5, 7, 9, and 11 are shown.
FIG. 7. The bubbles generated by inertial cavitation at the focus of a 1.1 MHz HIFU transducer looks like a ball changing in color rapidly共mosaic pattern兲 in a di-rectional color power Doppler image 共550 mV, 100 cycles, 500 Hz PRF兲.
using a transcranial ultrasound array. Arranging two trans-ducers from the bilateral temporal area of the skull—where the bone is thinner—may be preferable because the output from each transducer decreased and the possibility of over-heating the brain tissue outside the target reduced.
Unfortu-nately, the resulting beam pattern cannot be measured by a traditional needle hydrophone system. Furthermore, our pro-posed method can also be used to rapidly construct a 3-D beam pattern, in contrast to 3-D measurements with a needle hydrophone system usually taking many hours to complete. The proposed method is able to perform beam plotting of two facing transducers, and can construct a 3-D beam pattern in a relatively shorter time. However, the proposed method is not able to determine the absolute peak pressure or intensity, or the pressure profile of the focus. In addition, the resolution is limited by the frequency of the diagnostic ultrasound probe共in our case, a 7.5 MHz central frequency兲, and thus is not adequate for a focal size smaller than 1 mm. To clearly show a whole ring 共the first pressure valley兲 in the B-mode images, an area of about 1⫻1 mm2共or about 5⫻5 pixels兲 is necessary. The use of a diagnostic probe with a higher fre-quency would increase the resolution.
Before turning on both transducers, the output of each transducer was lower than the inertial cavitation threshold of the bubbles from the shock wave generator, and hence no enhanced scattering was seen. When the foci of two trans-ducers intersected, the peak pressure increased and exceeded these bubbles’ inertial cavitation threshold. Therefore, before introducing bubbles to the intersecting area, no inertial cavi-tation or enhanced scattering was detected. Seeding some FIG. 8. The white rings of the 1.1 MHz HIFU beam compared with the
location of the pressure valleys measured by a needle hydrophone.
FIG. 9. The comparisons between the simulation and experimental results are shown for共a兲 the 1.1 MHz and 共b兲 the 3.5 MHz HIFU transducers. For both transducers, the B-mode imaging planes were set at their focal planes. The scale of the simulation and experi-mental results are the same. For共a兲, dashed circles indicate the locations of the second and third pressure valleys for both simulation and experimental results. For共b兲, white dashed circles indicate the second and fourth pres-sure valleys.
bubbles by the shock wave transducer to the combined focus induced inertial cavitation, and the enhanced scattering was sustained for longer periods of time共up to a few minutes兲. In our case, the focal pressure of the 3.5 MHz transducer in-creased by summation with the pressure of the first sidelobe of the 1.1 MHz transducer, and exceeded the inertial cavita-tion threshold at 3.5 MHz. We believe that bubbles were generated, grew, and collapsed continuously at the intersect-ing area.
The schlieren imaging uses light to form images, which will not alter the sound field of the target transducer, and is pretty fast. However, the shlieren imaging method is basi-cally a semiquantitative measurement of the pressure profile of the ultrasound beam. The bright and dark patterns pro-jected on a screen can be used to determine the relative po-sitions of the focus and sidelobes. Moreover, an absolute value of the beam size cannot be easily obtained. Further-more, the schlieren imaging could be distorted easily at the presence of bubbles from inertial cavitation. The laser light diffracted while passing through moving bubbles and thus reduced the quality of the generated images. The new imag-ing method usimag-ing bubbles can be used to perform measure-ment quantitatively. The obtained image quality even im-proves at the presence of bubbles from inertial cavitation.
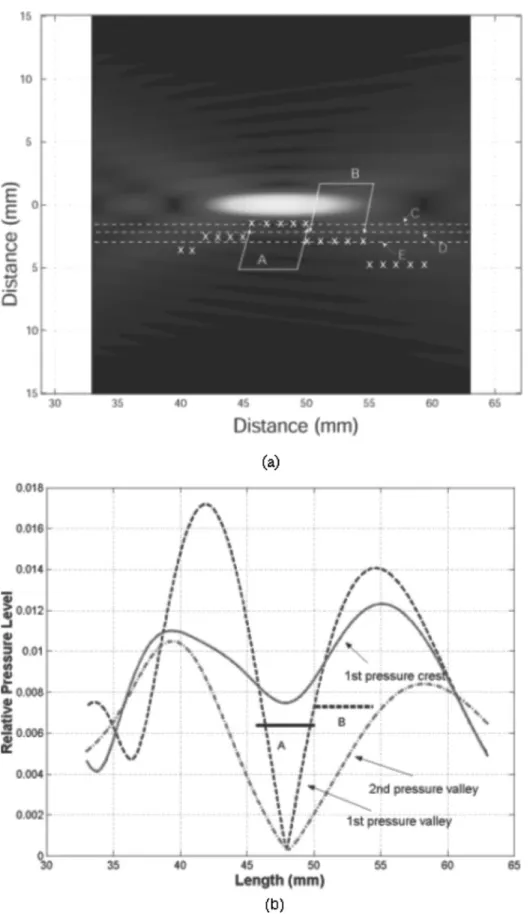
The ‘‘step’’ behavior seen in Fig. 5 represented the true pressure profile around the HIFU focus. As seen in Fig. 11共a兲, the bright parts represent the pressure crests 共peaks and saddles兲 while the dark parts are the pressure valleys. This background beam plot was created using the simulation equations described above. Bubbles tended to move to the low-pressure area and thus accumulated in the dark regions. The measured radii of the beam profile represented the inner most pressure valleys which bubbles could reach at different distances from the transducer surface. When the transducer’s output was low, the pressure at the saddle part 关A in Fig. 11共b兲兴 was low enough to allow bubbles to climb over it and stayed in the first pressure valley, the lowest ‘‘step’’共46–50 mm兲. The pressure gradually increased while the distance to the transducer increased, and prevented bubbles from further climbing over. Bubbles stayed in the second pressure valley and formed a higher step 共B, 50–54 mm兲. Ambiguity oc-curred at the transition between two steps. That is, bubbles can stay either in the lower or the higher pressure valley. Figure 11共b兲 shows the relative pressure amplitudes of the first pressure valley, the pressure crest, and the second pres-sure valley. However, when the output prespres-sure was high enough关Fig. 5共b兲兴, bubbles were more and more difficult to FIG. 10. The combined effect of the 1.1 and 3.5 MHz HIFU transducers is shown. The left column共a1, b1, and c1兲 is the original B-mode images taken at the confocal plane of the two transducers. Locations of the first rings of both transducers are shown by thick 共3.5 MHz兲 and thin 共1.1 MHz兲 dashed rings. When the 3.5 MHz HIFU trans-ducer is on but the 1.1 one is off, the first ring of its beam pattern is clearly seen共thin arrow in a1 and a2兲. After turning on the 1.1 MHz transducer and supplying the focal area with shock wave-generated bubbles, the focus of the 3.5 MHz transducer filled with high-scattering signals, most likely bubbles 共thick arrow in b1 and b2兲. The bubbles were generated and de-stroyed repeatedly at the focus of the 3.5 MHz beam. The moving direction of the shock wave-generated bubbles is indicated by the arrow heads 共b1 and b2兲. The bubble-like signals at the focus of the 3.5 MHz transducer can sustain for up to a few minutes after supplying ‘‘seed’’ bubbles generated by shock waves once. The c1 and c2 plots were taken after about a minute after stopping supplying bubbles from shock waves.
enter the inner pressure valleys and the measured radii thus increased rapidly.
Our observations indicate that shock waves can be used to provide nuclei to reduce the cavitation threshold and to locally induce inertial cavitation activity. The focal size of a shock wave is small 共1.7⫻1.7⫻6.7 mm兲, and thus a large amount of energy can be directed to a small region in vivo.
The negative pressure of the shock wave was sufficiently low to induce cavitation and create bubbles in the intrahepatic vessels and bile.9,10It is also possible for bubbles to be gen-erated in loose tissue such as liver parenchyma. The shock wave-generated bubbles can be used to provide bubble seeds for further cavitation activity, and thus may be used to facili-tate ultrasound-related bioeffects, such as drug delivery or FIG. 11.共a兲 Simulated pressure profile of the 1.1 MHz HIFU transducer near the transducer focus. ‘‘X’’ represents the positions where focal sizes were measured共see Fig. 5兲. ‘‘A’’ is the low-est pressure step at position 46 to 50 mm. The pressure ‘‘crest 共peak and saddle兲’’ outside A is low and bubbles can climb over and enter ‘‘A’’ to form the first ring. ‘‘B’’ is where the second pressure ‘‘step’’ locates共50 to 54 mm兲. The detailed pressure profiles of slice C共through step ‘‘A’’兲, D 共through first pressure crest兲, and E 共through step ‘‘B’’兲 are shown in 共b兲.
gene transfection, when used with a therapeutic ultrasound transducer.
ACKNOWLEDGMENTS
This research was supported by grants from the National Science Council No. 92-2312-B-002-019-, and the National Taiwan University Hospital No. 93N011.
1S. Vaezy, V. Y. Fujimoto, C. Walker, R. W. Martin, E. Y. Chi, and L. A. Crum, ‘‘Treatment of uterine fibroid tumors in a nude mouse model using high-intensity focused ultrasound,’’ Am. J. Obstet. Gynecol. 183, 6 –11 共2000兲.
2G. ter Haar, D. Sinnett, and I. Rivens, ‘‘High intensity focused ultrasound—a surgical technique for the treatment of discrete liver tu-mours,’’ Phys. Med. Biol. 34, 1743–1750共1989兲.
3
F. Wu, Z. B. Wang, W. Z. Chen, J. Z. Zou, J. Bai, H. Zhu, K. Q. Li, F. L. Xie, C. B. Jin, H. B. Su, and G. W. Gao, ‘‘High intensity focused ultra-sound for extracorporeal treatment of solid carcinomas: four-year Chinese clinical experience,’’ Proceedings of the International Symposium of
Therapeutic Ultrasound, 2002, pp. 34 – 43.
4R. Yang, C. R. Reilly, F. J. Rescorla, P. R. Faught, N. T. Sanghvi, F. J. Fry, T. D. Franklin, Jr., L. Lumeng, and J. L. Grosfeld, ‘‘High-intensity focused ultrasound in the treatment of experimental liver cancer,’’ Arch. Surg. 共Chicago兲 126, 1002–1009 共1991兲.
5J. Y. Chapelon, M. Ribault, F. Vernier, R. Souchon, and A. Gelet, ‘‘Treat-ment of localised prostate cancer with transrectal high intensity focused ultrasound,’’ Eur. J. Ultrasound 9, 31–38共1999兲.
6U. Schatzle, T. Reuner, J. Jenne, and A. Heilingbrunner, ‘‘Quality assur-ance tools for therapeutic ultrasound,’’ Ultrasonics 36, 679– 682共1998兲. 7H. T. O’Nell, ‘‘Theory of focusing radiators,’’ J. Acoust. Soc. Am. 21,
516 –526共1949兲. 8
M. Blomley, T. Albrecht, D. Cosgrove, V. Jayaram, J. Butler-Barnes, and R. Eckersley, ‘‘Stimulated acoustic emission in liver parenchyma with Levovist,’’ Lancet 351, 568共1998兲.
9M. Delius, R. Denk, C. Berding, H. G. Liebich, M. Jordan, and W. Bren-del, ‘‘Biological effects of shock waves: cavitation by shock waves in piglet liver,’’ Ultrasound Med. Biol. 16, 467– 472共1990兲.
10L. E. Forer, W. J. Davros, J. Goldberg, F. al Kawas, B. S. Garra, W. Hayes, and R. K. Zeman, ‘‘Hepatic cavitation. A marker of transient hepatocellu-lar injury during biliary lithotripsy,’’ Dig. Dis. Sci. 37, 1510–1516共1992兲.