DOI: 10.1002/pi.1634
Predicting the permeability and tensile
behavior of high density polyethylene/
tie/polyamide 6 three-layer films
Chi-Hsien Huang,
1Jiann-Shing Wu
1∗and Chun-Chin Huang
21Department of Applied Chemistry, National Chiao Tung University, 1001 Ta Hsueh Road, Hsinchu 30043, Taiwan 2Department of Mold and Die Engineering, National Kaohsiung University of Applied Science, Kaohsiung 807, Taiwan
Abstract: Multilayer films with multiple properties have been widely applied in the packaging industry. In order to know the two most important properties, ie permeability and tensile property, of the multilayer films, we examined model predictions and the properties of the individual component layers to provide an efficient method to design desired multilayer structures. The series model was employed for predicting permeability; there is good agreement between experimental data and this model for predicting both gas and water vapor permeabilities of three-layer films with various thickness fractions of polyamide 6 (PA-6). We can also predict the parameters of the constitutive equation, which described the plastic deformation of the three-layer films, from those of the individual component layers, with particularly high accuracy by using the additive rule. However, there was a larger discrepancy between the model and experimental data at high crosshead speeds due to the generation of heat during deformation.
2004 Society of Chemical Industry
Keywords: coextrusion; multilayer; plastic deformation; permeability
INTRODUCTION
It is common to introduce multilayer structures com-prising different polymers to form a product with multiple properties. Each property takes advantage of the best property of each individual component. A multilayer extruded product can be produced by coextrusion into the various types of multi-layer sheets, blown films, cast films, tubing, and containers.1 – 5
Polyethylene (PE) and polyamide 6 (PA-6) are two important classes of polymers used in coextrusion that are very popular in the packaging industry. PE is widely employed because of its low cost, easy processibility, chemical inertness and high moisture barrier proper-ties, but its poor barrier properties against oxygen, aromas and organic solvents limit its applications.6 – 9 On the other hand, PA-6 is a good barrier resin against oxygen, aromas and organic solvents and it has high tensile strength and toughness, but it is relatively expensive and a poor barrier against water vapor.10 – 13 For packaging applications, it is reasonable to com-bine these two resins into a single structure by using a coextrusion process to form multilayer films with multiple properties. An extrudable adhesive is often incorporated into the multilayer structure as a tie layer in the coextrusion process due to the incom-patibility between these two polymers. Kamykowski14
studied the adhesive properties of five-layer polypropy-lene/adhesive/polyamide/adhesive/polypropylene co-extruded cast films and found that adhesion can be generally improved by increasing the overall film thick-ness or the relative amount of the adhesive. Homopoly-mer diluents in the adhesive layer have better adhesion properties than random copolymers. The molecular weight of the grafted polymer of adhesive has a small effect on adhesion. By combining graft and polymer blending, Tanaka et al15have successfully developed a new generation of tie layer adhesives that maintain high adhesive strengths after thermoforming and orienta-tion. A blend of component material and adhesive as both the adhesion-promoting layer and support layer was used to eliminate the tie layer and provide adhe-sion between the chemically dissimilar layers,16 – 18 eg the five-layer film coextrusion system was replaced with a three-layer film comprising ethylene-vinyl alco-hol copolymer (EVOH) as the central layer and low density polyethylene/low density polyethylene grafted maleic anhydride (LDPE/LDPE-g-MAH) blends as the external layers to form a three-layer structure, A/B/A (blend/EVOH/blend).18
In packaging applications, the permeability and tensile strength are the two most important properties. These two properties of monolayers of high density polyethylene (HDPE) and PA-6 have been reported in
∗Correspondence to: Jiann-Shing Wu, Department of Applied Chemistry, National Chiao Tung University, 1001 Ta Hsueh Road, Hsinchu
30043, Taiwan
E-mail: chhuang.ac87g@nctu.edu.tw
(Received 23 February 2004; revised version received 16 April 2004; accepted 22 April 2004) Published online 13 October 2004
previous literature13,19 – 23with the aim of constructing a method for effectively predicting the specific properties of a multilayer structure from the properties of its individual component materials. In this paper we use a three-layer film, HDPE/tie/PA-6, to examine the permeabilities of nitrogen (N2), oxygen (O2), carbon dioxide (CO2) and water vapor and the tensile properties of three-layer films fabricated via a coextruded blown-film process using a series model24and an additive rule25as predicting methods, respectively. The aim of the study is to provide an economical and efficient tool for designing the compositions of the multilayer sheets, films and containers to achieve the desired properties by coextrusion.
EXPERIMENTAL Materials
The materials used in the coextrusion blown-film process were high density polyethylene (HDPE), poly-amide-6 (PA-6) and adhesive, high density polyethy-lene grafted maleic anhydride (HDPE-g-MAH). HDPE was supplied in pellet form by Formosa Plas-tic Corp (Taiwan): HDPE 9001 with melt index 0.05 g (10 min)−1 (190◦C, 2.16 kg) and density of 0.95 g cm−3. The PA-6 was provided in pellet form by Mitsubishi Engineering Plastic Co. (Japan): Novamid 1030 with melt index of 5 g (10 min)−1 (240◦C, 2.16 kg) and density of 0.95 g cm−3. The adhesive was obtained in pellet form from Mitsubishi Chemi-cal Corp. (Japan): Modic-AP H503 with melt index of 1.5 g (10 min)−1 (190◦C, 2.16 kg) and density of 0.93 g cm−3.
Preparation of multilayer films
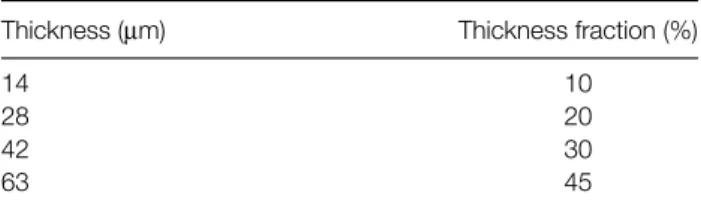
Because of the hydrophilic property of PA-6, the polymer was dried in a vacuum oven for 12 h at 90◦C before processing. HDPE, PA-6, and HDPE-g-MAH were fed separately into their individual extruders and coextruded through a three-layer coextrusion blown-film die (inner diameter= 97.6 mm; gap thickness = 1.2 mm) at 250◦C. The three-layer film was inflated and cooled with air and stretched by a take-up device after leaving the exit of the die. Monolayers of PA-6 and HDPE films were also prepared using the same blown-film equipment. All samples were placed in a cabinet for 14 days maintained at 25◦C. Four different compositions of the component layers were prepared and the overall thickness of three-layer multilayered films was ca 140µm. Table 1 presents the thicknesses and thickness fractions of the PA-6 layers; the compositions of all the three-layer films were controlled by using gear pumps precisely and steadily and the individual thicknesses of the component layers were measured by using ultrasonic thickness measurement (Quinsonic, ElektroPhysik). Because the tie layer generally was very thin (ca 5µm in this study) in the coextrusion process, and the main molecular structure was HDPE, we consider the tie
Table 1. Thickness and thickness fraction of PA-6 layer in three-layer films
Thickness (µm) Thickness fraction (%)
14 10
28 20
42 30
63 45
layer to be part of the HDPE layer and neglect its effect on permeability and tensile behavior in this study. Permeability measurement
The gas permeability, including that towards nitrogen (N2), oxygen (O2) and carbon dioxide (CO2), was measured using a Lyssy L-100-5000 gas permeability tester,26 following ASTM Standard Method D1434. The gas permeability of the samples was measured at 23◦C and a relative humidity of 0 %. Water vapor permeability was measured using a Lyssy L-80-5000 water vapor permeability tester,27 following ASTM Standard Method E96. The water vapor permeability of the samples was measured at 38◦C and a relative humidity of 90 %. The temperatures of both measurements were controlled by a water bath. Measurements were taken on five replicate samples; average values are reported.
Tensile behavior measurement
The uniaxial tensile behavior of test samples with dimension of 40 mm length and 20 mm width were measured by using a Hung-Ta instrument model 2102AP. Three crosshead speeds, 4, 40 and 400 mm min−1, were employed to test samples at a temperature of 25◦C and a relative humidity of 50 %. Engineering stress – strain curves were determined from load-displacement data based on the original geometry of the test samples. Measurements were taken on five replicate samples.
We calculated the engineering stress and strain by employing the original geometry of the sample film, but the cross-sectional area of the film sample changed continuously during actual deformation. So, the engineering stress and strain cannot represent the actual stress and strain at any instant during deformation. It is necessary and more instructive to plot the true stress – strain curves to describe the tensile behavior. If the test sample deformed homogeneously, the constancy of volume was assumed during deformation and the true strain, εT, and the true stress, σT, were calculated by
εT= ln(1 + εE) (1)
σT= σE(1+ εE) (2) where εE and σE are the engineering strain and the engineering stress, respectively.19,28 On the other hand, if the deformation was inhomogeneous, ie, a neck formed, the surface of each sample film
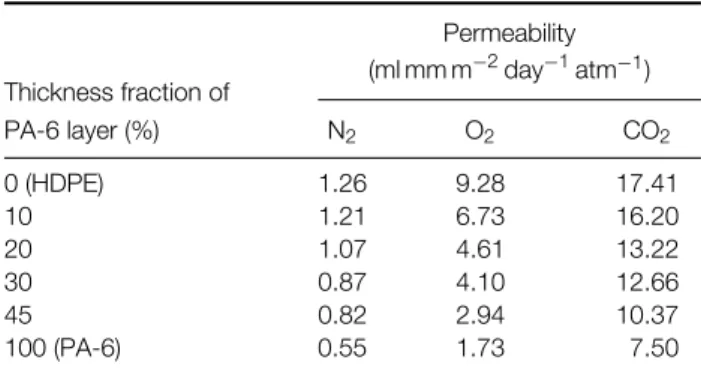
Table 2. Gas Permeabilities of monolayer PA-6, monolayer HDPE and three-layer films Thickness fraction of Permeability (ml mm m−2day−1atm−1) PA-6 layer (%) N2 O2 CO2 0 (HDPE) 1.26 9.28 17.41 10 1.21 6.73 16.20 20 1.07 4.61 13.22 30 0.87 4.10 12.66 45 0.82 2.94 10.37 100 (PA-6) 0.55 1.73 7.50
was marked with a set of 199 points, which were positioned 0.2 mm apart along the 40 mm gauge length of the specimen before testing.29The evolution of the specimen profile during a test was recorded continuously with the aid of a CCD video camera that was coupled with a microscope mounted on a screw-driven device and connected to a computer. The true stress and strain were determined by measuring the local deformation in the neck region from photographs obtained by a frame grabber during the experiment. Assuming that the sample retained constant volume during deformation, the true stress and true strain were calculated by
εT= ln(1 + εL) (3)
σT= σeng(1+ εL) (4) where εLis the longitudinal strain of the displacement between two markers in the neck region. These markers were monitored along the central axis and the cross-section of sample was rectangular so that the effect of triaxiality during necking could be ignored.29,30
RESULTS AND DISCUSSION Permeability
Table 2 lists the gas permeabilities of PA-6 and HDPE films. The PA-6 film has much better barrier properties than HDPE toward all these gases, with permeabilities for both films increasing in the order CO2> O2> N2. Table 2 also displays the gas permeabilities of three-layer films with various thickness fractions of the PA-6 layer. The values of gas permeabilities of these three-layer films all lie between those of the individual component layers for all the gases. As expected, the permeability toward all gases decreased upon increasing the thickness fraction of the PA-6 layer. In order to predict the gas permeability of a three-layer film from that of its individual component three-layers, we employed a series model24because of the lamellar structure of these films.
1 PM = LHDPE PHDPE + LPA−6 PPA−6 (5)
where PM is the permeability of the three-layer film, PHDPE and PPA−6 are the permeabilities of the monolayer films of HDPE and PA-6, respectively, and
LHDPEand LPA−6are the thickness fractions of HDPE (including the tie layer) and PA-6 in the three-layer films, respectively. The gas permeabilities of three-layer films toward N2, O2, and CO2are presented in Figs 1, 2 and 3, respectively, for both the series model and the experimental data. There is good agreement between the model’s predictions and the experimental data for all these gases.
Table 3 lists the water vapor permeabilities of HDPE and PA-6 films. In contrast to the gas permeabilities, we see that the HDPE film has a much better water vapor barrier property than that of PA-6. Table 3 also presents the water vapor permeabilities of the three-layer films as a function of the thickness fraction of the PA-6 layer. Similarly to the gas permeabilities, the values of water vapor permeabilities all lie between those of the individual component layers. Fig 4 displays the water vapor permeabilities of the three-layer films as a function of the thickness fraction of the PA-6 layer. For the sake of comparison, this figure also presents the predictions
0 10 20 30 40 50 95100 N2 P e rmeability (ml mm m -2 da y -1 atm -1) 2.0 1.5 1.0 0.5 0.0
Thickness fraction of PA-6 (%) HDPE
experimental data series model
PA-6
Figure 1. Nitrogen (N2) permeabilities of three-layer films with various
contents of PA-6. 0 2 4 6 8 10 O2 P e rmeability (ml mm m -2 da y -1 atm -1)
Thickness fraction of PA-6 (%)
0 10 20 30 40 50 95100 HDPE
PA-6 experimental data series model
Figure 2. Oxygen (O2) permeabilities of three-layer films with various
0 10 20 30 40 50 95100 0 2 4 6 8 10 12 14 16 18 20 HDPE PA-6 series model experimental data
Thickness fraction of PA-6 (%)
CO 2 Permeability (ml mm m -2 day -1 atm -1)
Figure 3. Carbon dioxide (CO2) permeabilities of three-layer films
with various contents of PA-6.
Table 3. Water vapor permeabilities of monolayer PA-6, monolayer HDPE and three-layer films
Thickness fraction of PA-6 layer (%) Permeability (g mm m−2day−1) 0 (HDPE) 2.71 10 2.82 20 3.53 30 4.00 45 5.01 100 (PA-6) 987.52 0 10 20 30 40 50 95100 0 1 2 3 4 5 6 900 1000 1100 HDPE PA-6 series model experimental data
Thickness fraction of PA-6 (%)
Water vapor permeability
×
10
2(g mm m -2 day -1)
Figure 4. Water vapor permeabilities of three-layer films with various contents of PA-6.
obtained by the model using Eqn (5). The water vapor permeabilities increase with increasing PA-6 content and agree reasonably well with the series model. Tensile behavior
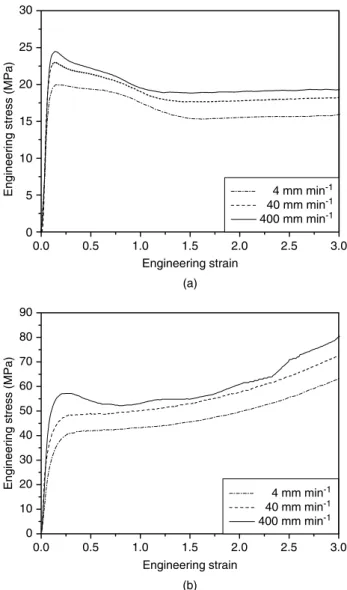
The engineering stress – strain curves for the mono-layer films of HDPE and PA-6 are presented in Fig 5. We see that the HDPE film deforms inhomo-geneously at these three crosshead speeds, 4, 40 and 400 mm min−1. A significant load drop can be seen to occur, which is associated with stable neck formation at the central cross-section. The load drop is followed
0.0 0.5 1.0 1.5 2.0 2.5 3.0 0 10 20 30 40 50 60 70 80 90 4 mm min-1 40 mm min-1 400 mm min-1 Engineering strain
Engineering stress (MPa)
0.0 0.5 1.0 1.5 2.0 2.5 3.0 0 5 10 15 20 25 30 4 mm min-1 40 mm min-1 400 mm min-1 Engineering strain
Engineering stress (MPa)
(a)
(b)
Figure 5. Engineering stress–strain curves of (a) HDPE and (b) PA-6 films at various crosshead speeds.
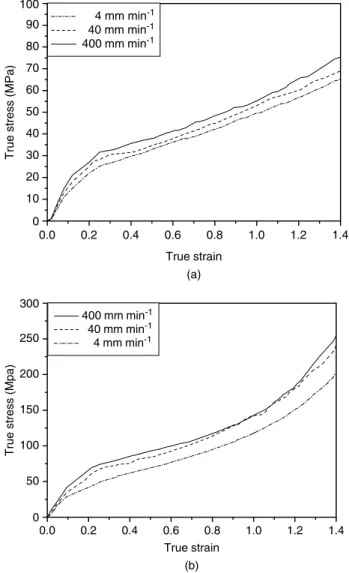
by cold drawing, which is associated with neck prop-agation along the specimen. The true stress – strain curve was determined by measuring the local strain during neck region and applying Eqns (3) and (4). On the other hand, the PA-6 film shows obviously different tensile behavior compared to HDPE films. The PA-6 film exhibits a higher level of engineer-ing stress and deforms homogeneously at low level of crosshead speeds, ie 4 and 40 mm min−1. At higher level of strain, the engineering stress increases rapidly with the increase of engineering strain due to the molecular alignment;31 this effect is known as strain hardening. The true stress – strain curve was calculated using Eqns (1) and (2). However, at the high level of crosshead speed, ie 400 mm min−1, the deformation mode changes from homogeneous to inhomogeneous and the true stress – strain curve was determined as for HDPE. Fig 6 displays the true stress – strain curves of the PA-6 and HDPE films.
To model the deformation behavior of the films, we employed the following empirical constitutive equation:19,32
0.0 0.2 0.4 0.6 0.8 1.0 1.2 1.4 0 50 100 150 200 250 300 400 mm min-1 40 mm min-1 4 mm min-1 True strain
True stress (Mpa)
(b) 0.0 0.2 0.4 0.6 0.8 1.0 1.2 1.4 0 10 20 30 40 50 60 70 80 90 100 4 mm min-1 40 mm min-1 400 mm min-1 True strain
True stress (MPa)
(a)
Figure 6. True stress–strain curves of (a) HDPE and (b) PA-6 films at various crosshead speeds.
where σ0and γ are the true yield stress and the strain hardening parameter, respectively. The constitutive equation can also be presented in the following form:
ln σ = ln σ0+ γ · εT (7) From Eqn (7), the relationship of the natural logarithm of true stress (ln σ ) and true strain (εT) should be linear in the region of plastic deformation. In a least-squares approximation to the plot of ln σ versus
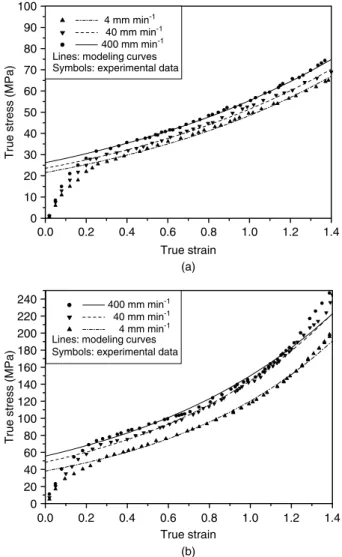
εT, the slope and intercept correspond to the strain hardening parameter (γ ) and the natural logarithm of the true yield stress (ln σ0), respectively. Fig 7 displays the fitted curves and experimental data of the ln σ versus εT for the HDPE and PA-6 films. A linear relationship for both films appears to exist over the range of true strains from 0.25 to 1.40 with the correlation coefficients all >0.99 with respect to the approximation. The corresponding parameters of the constitutive equation for the HDPE and PA-6 films at various crosshead speeds are summarized in Table 4. For comparison, Fig 8 displays both the experimental true stress – strain data and the modeling curves. Good agreement exists between the modeling curves and
0.0 0.2 0.4 0.6 0.8 1.0 1.2 1.4 0.0 2.5 3.0 3.5 4.0 4.5 5.0 5.5 4 mm min-1 40 mm min-1 400 mm min-1 Lines: modeling curves Symbols: experimental data
True strain ln true stress (b) 0.0 0.2 0.4 0.6 0.8 1.0 1.2 1.4 0.0 2.0 2.5 3.0 3.5 4.0 4.5 5.0 4 mm min-1 40 mm min-1 400 mm min-1 Lines: modeling curves Symbols: experimental data
True strain
ln true stress
(a)
Figure 7. Modeling and experimental data of ln true stress strain of versus true (a) HDPE and (b) PA-6 films at various crosshead speeds.
Table 4. True yield stress (σ0) and strain hardening parameter (γ ) of
HDPE, PA-6 and three-layer films at various crosshead speeds
Thickness fraction of PA-6
Crosshead speed (mm min−1)
4 40 400
layer (%) σ0(MPa) γ σ0(MPa) γ σ0(MPa) γ
0 (HDPE) 21.54 0.80 23.57 0.78 26.20 0.75 10 22.20 0.87 25.79 0.86 27.66 0.78 20 24.78 0.91 27.66 0.89 30.88 0.81 30 25.66 0.97 30.88 0.92 34.47 0.84 45 29.67 1.02 33.78 0.97 38.09 0.86 100 (PA-6) 38.09 1.15 48.43 1.10 55.70 0.99
experimental data for the range of plastic deformation of the HDPE and PA-6 films.
Fig 9 presents a plot of the engineering and true stress – strain curves of three-layer films with various thickness fractions of PA-6 at a crosshead speed of 40 mm min−1. It is clear that these curves all lie between those obtained for monolayers of HDPE and PA-6 films. The stress level increases with increasing thickness fraction of the PA-6 layer and, in addition, the strain hardening behavior due to the molecular alignment becomes more obvious. In the range of
0.0 0.2 0.4 0.6 0.8 1.0 1.2 1.4 0 20 40 60 80 100 120 140 160 180 200 220 240 True strain
True stress (MPa)
400 mm min-1 40 mm min-1 4 mm min-1 Lines: modeling curves Symbols: experimental data
0.0 0.2 0.4 0.6 0.8 1.0 1.2 1.4 0 10 20 30 40 50 60 70 80 90 100 True strain
True stress (MPa)
4 mm min-1 40 mm min-1
400 mm min-1 Lines: modeling curves Symbols: experimental data
(a)
(b)
Figure 8. Comparison of true stress–strain curves between modeling curves and experimental data of (a) HDPE and (b) PA-6 films at various crosshead speeds.
thickness fractions of PA-6 that we investigated, all the three-layer films deform inhomogeneously at this crosshead speed. A linear relationship also appears to exist for the three-layer films over the same range of true strains (0.25 – 1.40) as it did for the HDPE and PA-6 films at crosshead speed 40 mm min−1. The correlation coefficients are also all >0.99 with respect to the approximation. The corresponding parameters of the constitutive equation for the three-layer films at various crosshead speeds are also listed in Table 4. A comparison of the modeling curves and experimental true stress – strain data at crosshead speed 40 mm min−1 is shown in Fig 10. There is also good agreement between the experimental data and the modeling curves over the range of plastic deformation for the three-layer films with various thickness fractions of PA-6.
Similarly to what we reported above for predicting permeability, we introduced a simple theoretical additive rule model25 to predict the tensile behavior of a three-layer film from those of its individual component layers: σM= LHDPEσHDPE+ LPA−6σPA−6 (8) 0.0 0.2 0.4 0.6 0.8 1.0 1.2 1.4 0 50 100 150 200 250 300 45% 30% 20% 10% True strain
True stress (MPa)
HDPE PA-6 (b) 0.0 0.5 1.0 1.5 2.0 2.5 3.0 0 20 40 60 80 100 HDPE PA-6 45% 30% 20% 10% Engineering strain
Engineering stress (MPa)
(a)
Figure 9. Stress–strain curves of three-layer films as a function of
thickness fraction of PA-6 layer at crosshead speed 40 mm min−1.
The thick solid lines represent the PA-6 and HDPE monolayers. (a) Engineering; (b) True. 0.0 0.2 0.4 0.4 0.8 1.0 1.2 1.4 0 20 40 60 80 100 120 140 160 45% 30% 20% 10% Lines: modeling curves Symbols: experimental data
True strain
True stress (MPa)
Figure 10. Comparison of true stress–strain curves between modeling curves and experimental data of three-layer films as a function of thickness fraction of PA-6 layer at crosshead speed
40 mm min−1.
where σMis the true stress of a three-layer film, σHDPE and σPA−6are the true stresses of the HDPE and PA-6 layers, respectively, and LHDPE and LPA−6 are the
thickness fractions of HDPE (including the tie layer) and PA-6 layers, respectively.
From Eqns (6) and (8), the relationship between the true stress – strain of the three-layer and the individual component layer films is
σ0Mexp(γM· εT)= LPA−6σ0PA−6exp(γPA−6· εT) + LHDPEσ0HDPEexp(γHDPE· εT) (9) where σ0Mis the true yield stress of the three-layer film,
σ0HDPE and σ0PA−6 are the true yield stresses of the HDPE and PA-6 layers, respectively, and γM, γHDPE and γPA−6 are the strain hardening parameters of the three-layer film, HDPE, and PA-6 layers, respectively. It is reasonable to assume that the true yield stress of the three-layer film alone follows the additive rule:
σ0M= LPA−6σ0PA−6+ LHDPEσ0HDPE (10) and the strain hardening parameter of the three-layer film is defined as33 γM(ε)= ∂ ln σM ∂ε = ∂[LPA−6σ0PA−6exp(γPA−6· ε) + LHDPEσ0HDPEexp(γHDPE· ε)]
∂ε (11)
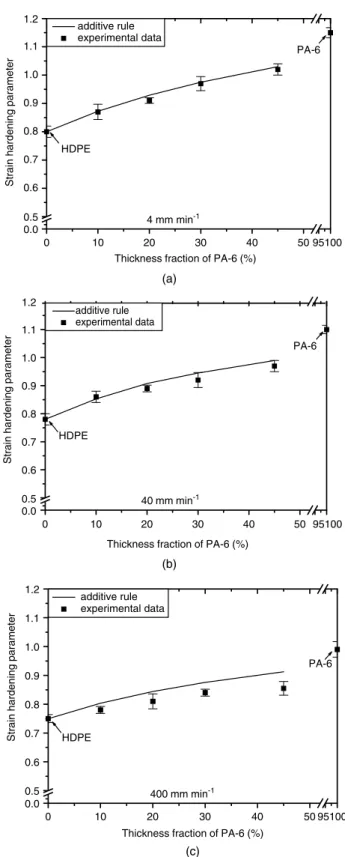
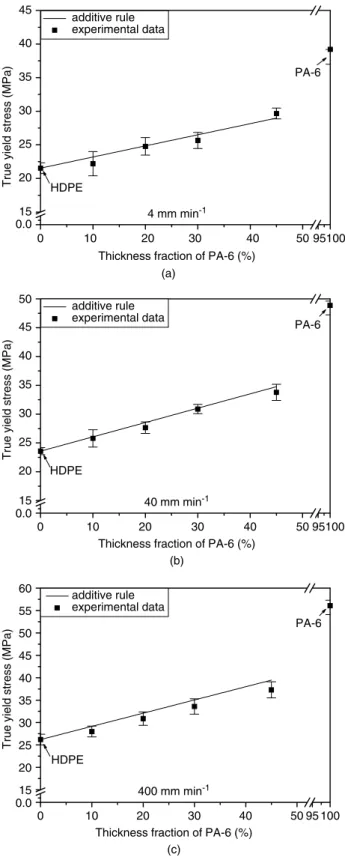
We calculated the parameters σ0M and γM for the additive rule by using the parameters of the individual component layers in Table 4. Figures 11 and 12 present the dependence of these parameters obtained by the additive rule and the experimental data (from Table 4) with respect to the compositions of films. We can see that good agreement exists between the experimental data and the additive-rule model for both the strain hardening parameter and true yield stress at low crosshead speeds, which suggests that this rule can be used to accurately predict the plastic deformation of the three-layer films. However, a larger discrepancy existed between the model and experimental data at high crosshead speed for both these parameters of the three-layer films. This is due to the generation of heat during deformation,34which causes a decrease in the stress to produce a given strain.
CONCLUSIONS
In this study we have successfully fabricated HDPE/tie/PA-6 three-layer films, a typical multilayer A/B/C structure, by a coextrusion blown-film process. We have investigated N2, O2, CO2 and water vapor permeabilities. We found that predicting both the gas and water vapor permeability of the three-layer films with respect to the thickness fraction of PA-6 based upon those of the individual component layer films is in good agreement with the experimental data when using the series model. On the other hand, a consti-tutive equation was employed to describe the tensile
0 10 20 30 40 50 95100 0.0 0.5 0.6 0.7 0.8 0.9 1.0 1.1 1.2 HDPE PA-6 additive rule experimental data
Thickness fraction of PA-6 (%)
Strain hardening parameter
400 mm min-1 (c) 0 10 20 30 40 50 95100 0.0 0.5 0.6 0.7 0.8 0.9 1.0 1.1 1.2 HDPE PA-6 additive rule experimental data
Thickness fraction of PA-6 (%)
Strain hardening parameter
40 mm min-1 (b) 0 10 20 30 40 50 95100 0.0 0.5 0.6 0.7 0.8 0.9 1.0 1.1 1.2 PA-6 additive rule experimental data
Thickness fraction of PA-6 (%)
Strain hardening parameter
4 mm min-1
(a)
HDPE
Figure 11. Comparison of strain hardening parameter between additive rule and experimental data as a function of PA-6 content at
various crosshead speeds: (a) 4 mm min−1; (b) 40 mm min−1;
(c) 400 mm min−1.
behavior of the films over the range of plastic deforma-tion. The tensile behavior of the component layer and multilayer films at various crosshead speeds can be pre-cisely expressed by a constitutive equation having two parameters in the true stress – strain relationship, ie, the true yield stress and the strain hardening parameter.
0 10 20 30 40 50 95100 0.0 15 20 25 30 35 40 45 HDPE PA-6 additive rule experimental data
Thickness fraction of PA-6 (%)
True yield stress (MPa)
4 mm min-1 (a) 0 10 20 30 40 50 95100 0.0 15 20 25 30 35 40 45 50 HDPE PA-6 additive rule experimental data
Thickness fraction of PA-6 (%)
True yield stress (MPa)
40 mm min-1 (b) 0 10 20 30 40 50 95 100 0.0 15 20 25 30 35 40 45 50 55 60 HDPE PA-6 additive rule experimental data
Thickness fraction of PA-6 (%)
True yield stress (MPa)
400 mm min-1
(c)
Figure 12. Comparison of true yield stress between additive rule and experimental data as a function of PA-6 content at various crosshead
speeds: (a) 4 mm min−1; (b) 40 mm min−1; (c) 400 mm min−1.
We examined the relationships between the parame-ters of the monolayers of the component layers and those of the three-layer films by using an additive rule. This could predict the tensile properties, including the
true yield stress and strain hardening, of the three-layer films from those of the individual component layers with good agreements in the true stress – strain relationship. However, there was a larger discrepancy between the model and experimental data at high crosshead speed due to the generation of heat during deformation.
In summary, we could efficiently design the compositions of the multilayer structure to achieve specific permeability and/or tensile properties by employing these model predictions before processing.
REFERENCES
1 Culter J, Krohn J and Todd W, Pack Tech Eng 8:30 (1999). 2 Dooley J, Hyun KS and Hughes K, Polym Eng Sci 38:1060
(1998).
3 Schrenk WJ and Marcus SA, J Plast Film Sheet 1:30 (1985). 4 Hosoda S, Seki Y and Kihara H, Polymer 34:4602 (1993). 5 Liu SJ and Yang CH, Adv Polym Tech 20:108 (2001).
6 Hensen F, Plastics Extrusion Technology, Hanser, New York, Chapter 5 (1997).
7 Rubin II, Handbook of Plastic Materials and Technology, Wiley, New York, Chapter 30 (1990).
8 Sabne MB, Thombre SM, Patil AS, Patil SD, Idage SB and Vernekar SP, J Appl Polym Sci 58:1275 (1995).
9 Gill TS and Xanthos M, Polym Eng Sci 2:248 (1996). 10 Climenhage DC, Packaging 32:39 (1987).
11 Eichler S and Miltz J, J Appl Polym Sci 50:2095 (1993). 12 Rubin II, Handbook of Plastic Materials and Technology, Wiley,
New York, Chapter 16 (1990).
13 Khanna YP, Day ED, Tsai ML and Vaidyanathan G, J Plast Film Sheet 13:197 (1997).
14 Kamykowski GW, J Plast Film Sheet 16:237 (2000).
15 Tanaka H, Shigemoto H and Kawchi H, J Plast Film Sheet 12:279 (1996).
16 Valdes SS, Villarreal FO, Quintanilla ML, Flores IY and Ramos de Valle LF, Polym Eng Sci 38:127 (1998).
17 Olmos JV, Valdes SS and Y´anez Flores IG, Polym Eng Sci 39:1597 (1999).
18 Huang CH, Wu JS, Huang CC and Lin LS, Polym J 35:978 (2003).
19 Bahadur S, Polym Eng Sci 13:266 (1973).
20 Wang Y, Easteal AJ and Chen XD, Pack Tech Sci 11:169 (1998). 21 Lin L and Argon AS, J Mater Sci 29:294 (1994).
22 Bianchi S, Cantagallo S, Consolati G, Laporta M, Pegoraro M, Tieghi G and Zanderighi L, J Appl Polym Sci 86:559 (2002). 23 Lin L and Argon AS, J Mater Sci 29:294 (1994).
24 Faisant JB, A¨ıt-Kadi A, Bousmina M and Deschˆenes L, Polymer 39:533 (1998).
25 Schrenk WJ and Alfrey T, Polym Eng Sci 9:393 (1969). 26 Automatic Manometric Gas Permeability Tester Operator Manual,
Model L100-5000, Lyssy AG (2001).
27 Automatic Manometric Water Vapor Permeability Tester Operator Manual, Model L80-5000, Lyssy AG (2001).
28 Al-Hussein M and Strobl G, Macromolecules 35:8515 (2002). 29 G’Sell C, Aly-Helal NA and Jonas JJ, J Mater Sci 18:1731
(1983).
30 Gˇerard Buisson and Ravi-Chandar K, Polymer 31:2071 (1990). 31 Peterlin A, J Mater Sci 6:490 (1971).
32 Gaucher-Miri V, Jones GK, Kaas R, Hiltner A and Baer E, J Mater Sci 37:2635 (2002).
33 Hart EW, Acta Metall 15:351 (1967). 34 Hall IH, J Appl Polym Sci 12:739 (1968).