EPIDEMIOLOGY
The Prevalence of Age-Related Macular Degeneration
and Associated Risk Factors
Ronald Klein, MD, MPH; Karen J. Cruickshanks, PhD; Scott D. Nash, MS; Elizabeth M. Krantz, MS;
F. Javier Nieto, MD, PhD; Guan H. Huang, PhD; James S. Pankow, PhD, MPH; Barbara E. K. Klein, MD, MPH
Objectives:To determine the prevalence of age-related macular degeneration (AMD) and to examine how reti-nal drusen, retireti-nal pigmentary abnormalities, and early AMD are related to age, sex, and other risk factors. Participants:A total of 2810 people aged 21 to 84 years participating in the Beaver Dam Offspring Study. Methods:The presence and severity of various charac-teristics of drusen and other lesions typical of AMD were determined by grading digital color fundus images using the Wisconsin Age-Related Maculopathy Grading System.
Results:Early AMD was present in 3.4% of the cohort and varied from 2.4% in those aged 21 to 34 years to 9.8% in those aged 65 years or older. In a multivariable model (expressed as odds ratio; 95% confidence interval), age (per 5 years of age, 1.22; 1.09-1.36), being male (1.65;
1.01-2.69), more pack-years of cigarettes smoked (1-10 vs 0, 1.31; 0.75-2.29;ⱖ11 vs 0, 1.67; 1.03-2.73), higher serum high-density lipoprotein cholesterol level (per 5 mg/dL, 0.91; 0.83-0.998), and hearing impairment (2.28; 1.41-3.71) were associated with early AMD. There were no as-sociations of blood pressure level, body mass index, physi-cal activity level, history of heavy drinking, white blood cell count, hematocrit level, platelet count, serum total cho-lesterol level, or carotid intimal-medial thickness with early AMD.
Conclusions:These data indicate that early AMD is in-frequent before age 55 years but increases with age there-after. Early AMD is related to modifiable risk factors, eg, smoking and serum high-density lipoprotein cholesterol level.
Arch Ophthalmol. 2010;128(6):750-758
A
LTHOUGH A GROWINGNUM-ber of population-based studies have described the prevalence and severity of age-related macular degen-eration (AMD), most have been limited to middle- and older-aged cohorts.1-6To our knowledge, accurate estimates of preva-lence of AMD among adults younger than 40 years are lacking. Such information is important for understanding the relation-ships of risk factors to AMD across the age spectrum and for identifying factors that might affect this disease earlier in life. The purposes of this report are to describe the prevalence of AMD and its defining le-sions and their relationship to age, sex, and other factors in the large Beaver Dam Off-spring Study (BOSS) cohort.
METHODS THE POPULATION
Methods used to identify the population and de-scriptions of it appear in previous reports.7,8 Briefly, participants in the Epidemiology of Hear-ing Loss Study, a population-based study of
hear-ing loss among Beaver Dam residents aged 48 to 92 years who participated in the baseline Bea-ver Dam Eye Study (BDES) from 1988 through 1990 and who were alive on March 1, 2003, who had previously reported having at least 1 living child were asked for permission to contact their adult children (1902 families).1-9Of the eli-gible families, 1671 (87.9%) gave permission to contact their children, 170 (8.9%) refused, and 61 (3.2%) were lost to follow-up. Of the 4965 offspring identified, 3285 (66.2%) participated in the study, 731 (14.7%) refused, 23 (0.5%) died, and 926 (18.7%) failed to complete an ex-amination or a questionnaire despite multiple attempts to schedule them. Compared with non-participants, study participants were slightly older (48 vs 46 years, respectively; P⬍.001), more likely to be women (54.6% vs 44.4%; P⬍.001), and less likely to live out of state (17.7% vs 32.1%; P⬍.001). After adjusting for age and sex, there was no statistically sig-nificant difference between participants and non-participants in parental history of AMD (odds ratio [OR],1.12; 95% confidence interval [CI], 0.99-1.27).
PROCEDURES
During the examination, informed consent was obtained. Pertinent parts of the examination Author Affiliations:
Departments of Ophthalmology and Visual Sciences
(Drs R. Klein, Cruickshanks, and B. E. K. Klein and Ms Krantz) and Population Health Sciences
(Drs Cruickshanks and Nieto and Mr Nash), School of Medicine and Public Health, University of Wisconsin, Madison; Institute of Statistics, National Chiao Tung University, Hsinchu, Taiwan, Republic of China (Dr Huang); and Division of Epidemiology and
Community Health, School of Public Health, University of Minnesota, Minneapolis (Dr Pankow).
visit included an extensive questionnaire, including informa-tion on smoking, physical activity level, and alcohol consump-tion. Participants were asked to bring all of their medications with them to the examination. A standardized hearing evalu-ation, including pure-tone air-conduction (500-8000 Hz) and bone-conduction (500, 2000, and 4000 Hz) audiometry, was administered.9,10Blood pressure was measured using a Dina-map monitor (GE Medical Systems, Milwaukee, Wisconsin) af-ter a 5-minute rest period; the average of the second and third readings was used in analyses. Height, weight, and waist cir-cumference were measured. A B-mode carotid artery ultra-sonogram (Biosound AU4; Biosound Esaote, Indianapolis, In-diana) was obtained and graded using modified Atherosclerosis Risk in Communities Study protocols.11-13Blood was drawn and analyzed for a complete blood count, glycosylated hemoglobin A1Clevel, and serum total cholesterol and high-density lipo-protein (HDL) cholesterol levels.
DIGITAL FUNDUS PHOTOGRAPHY
Fundus photography using a 45° 8.2-megapixel digital non-mydriatic camera (Canon Inc, Paramus, New Jersey) was per-formed through a pharmacologically dilated pupil using a stan-dardized protocol.14Two photographic fields were taken of each eye; the first centered on the optic disc (Early Treatment Dia-betic Retinopathy Study field 1) and the second centered on the fovea (field 2).15
FUNDUS IMAGE GRADING
Capture and grading of digital images and quality control have been described in detail elsewhere.14,15Each image was graded twice (a preliminary and a detail grade) using a modification of the Wisconsin Age-Related Maculopathy Grading Sys-tem.15,16For the purposes of this report, participants with grad-able retinal images in at least 1 eye were included in these analy-ses. Of the 3285 participants, 2826 (86.0%) were examined and photographed, 20 (0.6%) were examined but refused imaging, and 439 (13.4%) completed only the questionnaire portions of the study. Of the 2826 participants photographed, 2810 (99.4%) had gradable retinal images (right eye, 27 [1.0%]; left eye, 20 [0.7%]; and both eyes, 2763 [97.8%]) and 16 (0.6%) had ungradable images. Among the 2810 participants in-cluded in these analyses, 102 (3.6%) were also participants in baseline BDES. They were eligible for the BOSS because their parents were also BDES participants.
Comparisons of parental characteristics for families con-tributing data to this study and those not included (nonpar-ticipating or no available gradable images from any offspring) demonstrated no significant differences in parental history of AMD, history of cardiovascular disease, diabetes mellitus, and smoking or heavy drinking status (Table 1). There was a sta-tistically significant difference in the distribution of the high-est educational level among parents, consistent with the slightly older age of participants.
DEFINITIONS OF VARIABLES
Among the AMD features evaluated were drusen size, type, and area; increased retinal pigment; retinal pigment epithelial (RPE) depigmentation; pure geographic atrophy; and signs of exuda-tive macular degeneration (ie, subretinal hemorrhage, subreti-nal fibrous scar, RPE detachment, and/or serous detachment of the sensory retina or laser or photodynamic treatment for neovascular AMD). Hard drusen were small (usually⬍63 µm in diameter, although some may be larger), round, pale yellow– white spots. Soft distinct drusen were defined by size (ⱖ250
µm in diameter) and appearance (sharp margins and a round nodular appearance with a uniform density [color] from cen-ter to periphery). Soft indistinct drusen were the same size as soft distinct drusen but had indistinct margins and a softer, less solid appearance. Increased retinal pigment appears as a depo-sition of granules or clumps of gray or black pigment in or be-neath the retina; RPE depigmentation is characterized by faint gray-yellow or pink-yellow areas of varying density and con-figuration without sharply defined borders. Early AMD was de-fined by the presence of either soft indistinct drusen or the pres-ence of RPE depigmentation or increased retinal pigment together with any type of drusen in the absence of signs of late AMD. Late AMD was defined by the presence of any of the fol-lowing: geographic atrophy or pigment epithelial detachment, subretinal hemorrhage or visible subretinal new vessels, sub-retinal fibrous or laser treatment scar, or history of photody-namic or antivascular endothelial growth factor treatment for AMD.
When 2 eyes of a participant were discrepant for the sever-ity of a lesion, the grade assigned for the participant was that of the more severely involved eye. When drusen or signs of AMD could not be graded in an eye, the participant was assigned a score equivalent to that in the other eye.
Eyes were considered gradable if field 2 was present and if the grader was able to assess whether drusen were present within the grid in 25% or more of the field. The degree of exact agree-ment achieved between the graders ranged from 66% to 73% for each of the drusen characteristics and 88% or more for the other AMD characteristics. The scores were generally in the moderate to substantial agreement categories.16
Current age was defined as the age at the time of the ex-amination. Smoking status was defined as past smoking, cur-rent smoking, or never smoking, and pack-years smoked was calculated by dividing the number of cigarettes smoked per day by 20 and multiplying by the number of years smoked. For mod-eling, the median number of pack-years among those with any years was used to categorize participants as no pack-years, 1 to fewer than 11 pack-pack-years, or 11 or more pack-years
Table 1. Comparisons of Parental Characteristics of Families Included in Analyses and Excluded Families in the Beaver Dam Offspring Study
Parental Historya No. (%) of Participants P Value Families Includedb (n = 1315) Families Excludedc (n = 353) Age-related macular degeneration 520 (39.5) 121 (34.3) .07 History of cardiovascular disease 457 (34.8) 116 (32.9) .49 Diabetes mellitus 296 (22.5) 66 (18.7) .12 History of ever smoking 929 (70.7) 242 (68.6) .40 History of heavy drinking 482 (36.7) 121 (34.3) .39 Highest educational level, yd
⬍12 221 (16.8) 50 (14.1)
.03
12 612 (46.5) 149 (42.2)
13-15 248 (18.9) 72 (20.3)
ⱖ16 234 (17.8) 82 (23.2)
aIn these analyses, the authors considered a condition to be present if 1 Beaver Dam Eye Study parent had the condition.
bParticipating families with gradable retinal images from at least 1 offspring.
cNo gradable retinal images from any offspring; includes those who refused to participate.
dWhen data were available for both parents, the authors selected the highest educational level achieved for either parent.
smoked. Heavy alcohol drinking was defined by report of con-suming 4 or more alcoholic beverages daily. Hypertension was defined as systolic blood pressure of 140 mm Hg or higher, dia-stolic blood pressure of 90 mm Hg or higher, or currently tak-ing blood pressure medication. Obesity was defined as havtak-ing a body mass index (BMI; calculated as weight in kilograms di-vided by height in meters squared) of 30 or higher. Hearing impairment was defined as a pure-tone average of thresholds at 0.5, 1, 2, and 4 kHz greater than 25 dB hearing level in the worse ear. Carotid artery intimal-medial thickness (IMT) was categorized as more than 1.0 mm or 1.0 mm or thinner.
STATISTICAL METHODS
Confidence intervals for prevalence estimates were calculated using the normal approximation or exact binomial methods as appropriate. Logistic regression was used to estimate age and sex associations with drusen and early AMD outcomes. The following variables were considered in multivariable logistic regression models for early AMD: educational status, smoking status, number of pack-years smoked, history of heavy alcohol drinking, systolic and diastolic blood pressure, hypertension status, BMI, obesity, diabetes status, history of weekly exer-cise, hearing impairment, white blood cell count, hematocrit level, platelet count, serum total cholesterol level, serum HDL cholesterol level, and carotid IMT and plaque. First, age- and sex-adjusted models were constructed for each variable. Next, a multivariable model was developed by initially including variables that had a significance level of P⬍.20 in the age-and sex-adjusted models, then sequentially removing vari-ables that were neither statistically significant nor affected the other covariate estimates by more than 20%. When multiple variables described highly correlated factors (eg, smoking and number of pack-years smoked, systolic/diastolic blood pres-sure, and hypertension), only 1 variable was selected for inclusion in the multivariable model to reduce problems of collinearity. Once the subset of variables retained in the multi-variable model was identified, each of the multi-variables originally excluded from the multivariable model was added one at a
time to the model to confirm that none were significant or confounders. Interactions of each variable with age and sex were tested. Because sampling in our study was explicitly in family units and because AMD aggregates in families, we reran the models using generalized estimating equations to account for family relationships and test the robustness of the results to the independence assumption. Both SAS, version 9.1 (SAS Institute Inc, Cary, North Carolina), and Stata version 10.1 (Stata Corp, College Station, Texas), statistical software were used for analyses.
RESULTS
Drusen were present in the macula in 63.3% of the co-hort (Table 2). There was an increase in the frequency of drusen with age (OR per 5 years of age, 1.16; 95% CI, 1.11-1.21) (Table 2). When controlling for age, the fre-quency of drusen was similar among men and women (OR men vs women, 0.95; 95% CI, 0.82-1.11).
There was an increase in the frequency of large dru-sen 125 µm or bigger in the macula with age (OR per 5 years of age, 1.38; 95% CI, 1.25-1.53) (Table 2). Dru-sen 125 µm or bigger were found as the largest druDru-sen present in 0.6% of people aged 21 to 34 years and in 9.2% of those aged 65 years or older. When controlling for age, men had a significantly higher frequency of larger drusen than did women (OR, 1.90; 95% CI, 1.24-2.92).
Eight percent of the population had at least 1 soft drusen within the macula (Table 2). There was 1 per-son (0.04%) with reticular drusen present. Soft dis-tinct drusen were more frequent than soft indisdis-tinct drusen (age-adjusted OR, 19.45; 95% CI, 2.48-152.60). The prevalence of soft distinct and indistinct drusen significantly increased with age (OR per 5 years of age, 1.42; 95% CI, 1.32-1.54; and 1.53; 1.30-1.79, respec-Table 2. Prevalence of Drusen Outcomes by Age and Sex in the Beaver Dam Offspring Study
Outcome No. of Participants at Risk Any Drusen Drusenⱖ125 µm in Diameter Any Soft Drusen
Any Soft Indistinct Drusen
Any Soft Distinct Drusen Women, y 21-34 98 49.0 1.0 4.1 0.0 4.1 35-44 453 58.7 0.2 1.6 0.0 1.6 45-54 560 68.0 2.0 5.0 0.0 5.0 55-64 319 64.6 5.0 9.7 2.2 8.8 65-84 97 73.2 7.2 21.7 4.1 19.6 All women 1527 63.7 2.4 6.0 0.7 5.6 Men, y 21-34 70 41.4 0.0 0.0 0.0 0.0 35-44 369 53.9 2.7 4.6 0.8 4.1 45-54 487 67.6 4.1 8.8 1.9 7.2 55-64 280 67.9 6.4 13.9 3.2 11.4 65-84 77 76.6 11.7 26.0 5.2 24.7 All men 1283 62.8 4.4 9.3 2.0 7.9
Men and women, y
21-34 168 45.8 0.6 2.4 0.0 2.4 35-44 822 56.6 1.3 2.9 0.4 2.7 45-54 1047 67.8 3.0 6.8 0.9 6.0 55-64 599 66.7 5.7 11.7 2.7 10.0 65-84 174 74.7 9.2 23.6 4.6 21.8 Total 2810 63.3 3.3 7.5 1.3 6.7
tively). When controlling for age, men had a signifi-cantly higher frequency of soft distinct and indistinct drusen than did women (OR, 1.42; 95% CI, 1.04-1.92; and 2.70; 1.32-5.54, respectively). There were no interactions of sex and age for soft distinct or indis-tinct drusen.
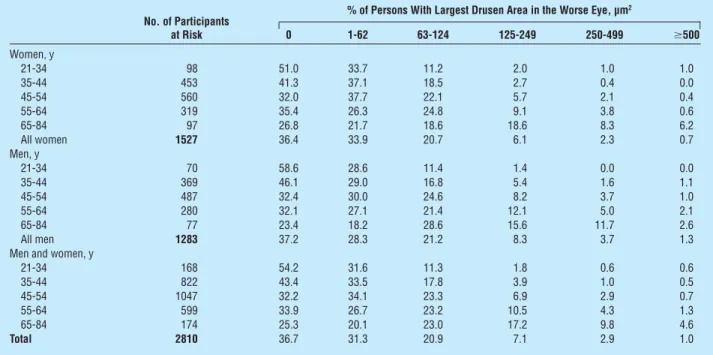
The area of the macula covered by drusen in the more severely involved eye increased with age (for drusen area ⱖ250 µm2: OR per 5 years of age, 1.42; 95% CI, 1.29-1.56) (Table 3). Adjusting for age, men were more likely to have larger areas of the macula covered by dru-sen than were women (OR, 1.67; 95% CI, 1.13-2.47). When only hard small drusen were present in the right eye as the most severe type of drusen, older persons were more likely to have a larger area of the macula covered by drusen than those who were younger (data not shown). Of right eyes with an area 250 µm2or greater covered by drusen, 29.0% had soft indistinct/ reticular, 55.3% had soft distinct, and 15.8% had hard distinct drusen as the most severe type of drusen pres-ent. For left eyes, respective percentages were 28.1%, 63.2%, and 8.8%.
Retinal pigment epithelial depigmentation was pres-ent in 1.8%, increased retinal pigmpres-ent in 2.7%, and pig-mentary abnormalities in 2.9% of the sample (Table 4). The frequency of these lesions increased with age (for increased retinal pigment: OR per 5 years of age, 1.27; 95% CI, 1.13-1.42; and for RPE depigmentation: 1.25; 1.09-1.43) (Table 4). When controlling for age, men had a significantly higher frequency of increased retinal pig-ment and RPE depigpig-mentation than did women (OR, 2.79; 95% CI, 1.70-4.58; and 2.87; 1.56-5.27, respec-tively). There were no interactions of sex and age for increased retinal pigment or RPE depigmentation.
The prevalence of AMD was 3.4% and increased with age in persons 55 years and older (OR per 5 years of age,
1.30; 95% CI, 1.18-1.44) (Table 5). When controlling for age, men had a significantly higher frequency of AMD than did women (OR, 2.39; 95% CI, 1.55-3.69). There was no interaction of sex and age for AMD. No
Table 4. Prevalence of Retinal Pigmentary Abnormalities by Age and Sex in the Beaver Dam Offspring Study
No. of Participants at Risk (% With Outcome) RPE Depigmentation Increased Retinal Pigment Any Pigmentary Abnormality Women, y 21-34 98 (2.0) 98 (1.0) 98 (3.1) 35-44 453 (0.4) 453 (0.9) 453 (0.9) 45-54 560 (0.4) 560 (0.7) 560 (0.9) 55-64 319 (1.6) 319 (2.2) 319 (2.5) 65-84 96 (4.2) 97 (7.2) 97 (7.2) All women 1526 (1.0)a 1527 (1.5) 1527 (1.8) Men, y 21-34 70 (0.0) 70 (1.4) 70 (1.4) 35-44 369 (2.4) 369 (3.3) 369 (3.3) 45-54 487 (3.1) 487 (3.9) 487 (4.1) 55-64 280 (2.1) 280 (5.4) 280 (5.4) 65-84 77 (7.8) 77 (7.8) 77 (9.1) All men 1283 (2.8) 1283 (4.1) 1283 (4.3) Men and women, y
21-34 168 (1.2) 168 (1.2) 168 (2.4) 35-44 822 (1.3) 822 (2.0) 822 (2.0) 45-54 1047 (1.6) 1047 (2.2) 1047 (2.4) 55-64 599 (1.8) 599 (3.7) 599 (3.8) 65-84 173 (5.8) 174 (7.5) 174 (8.1) Total 2809 (1.8) 2810 (2.7) 2810 (2.9)
Abbreviation: RPE, retinal pigment epithelium.
aThere is 1 woman missing data for pigmentary abnormality. Table 3. Drusen Area Distribution in the Worse Eye by Age and Sex in the Beaver Dam Offspring Study
No. of Participants at Risk
% of Persons With Largest Drusen Area in the Worse Eye, µm2
0 1-62 63-124 125-249 250-499 ⱖ500 Women, y 21-34 98 51.0 33.7 11.2 2.0 1.0 1.0 35-44 453 41.3 37.1 18.5 2.7 0.4 0.0 45-54 560 32.0 37.7 22.1 5.7 2.1 0.4 55-64 319 35.4 26.3 24.8 9.1 3.8 0.6 65-84 97 26.8 21.7 18.6 18.6 8.3 6.2 All women 1527 36.4 33.9 20.7 6.1 2.3 0.7 Men, y 21-34 70 58.6 28.6 11.4 1.4 0.0 0.0 35-44 369 46.1 29.0 16.8 5.4 1.6 1.1 45-54 487 32.4 30.0 24.6 8.2 3.7 1.0 55-64 280 32.1 27.1 21.4 12.1 5.0 2.1 65-84 77 23.4 18.2 28.6 15.6 11.7 2.6 All men 1283 37.2 28.3 21.2 8.3 3.7 1.3
Men and women, y
21-34 168 54.2 31.6 11.3 1.8 0.6 0.6 35-44 822 43.4 33.5 17.8 3.9 1.0 0.5 45-54 1047 32.2 34.1 23.3 6.9 2.9 0.7 55-64 599 33.9 26.7 23.2 10.5 4.3 1.3 65-84 174 25.3 20.1 23.0 17.2 9.8 4.6 Total 2810 36.7 31.3 20.9 7.1 2.9 1.0
one in the cohort had signs of either pure geographic at-rophy or exudative macular degeneration.
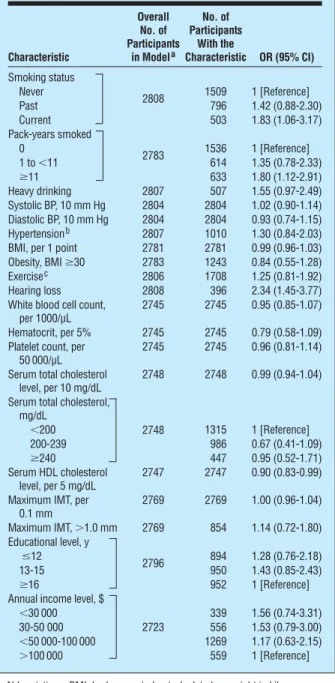
When controlling for age and sex, a history of current smoking, greater number of pack-years smoked, higher serum HDL cholesterol level, and hearing impairment were associated with early AMD (Table 6). There was a bor-derline association with history of heavy alcohol drink-ing. There were no statistically significant associations of educational status, blood pressure level, hyperten-sion status, BMI, obesity, diabetes status, physical activ-ity level, white blood cell count, hematocrit level, plate-let count, serum total cholesterol level, or carotid IMT or plaque with AMD.
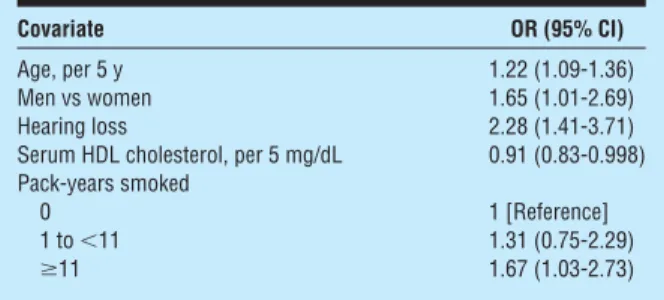
Many of the significant age- and sex-adjusted asso-ciations remained significant in multivariable analyses. The final model included age, sex, number of pack-years smoked, serum HDL cholesterol level, and hear-ing impairment (Table 7). When the multivariable model was rerun with never-smokers excluded, num-ber of pack-years smoked was no longer statistically significant (data not shown). Rerunning the models using general estimating equation to adjust for familial correlations resulted in similar statistically significant associations (age, sex, number of pack-years smoked, serum HDL cholesterol level, and hearing impairment [data not shown]) with early AMD, although the rela-tionship of HDL cholesterol level was of marginal sta-tistical significance (OR, 0.91; 95% CI, 0.83-1.00).
When using a dichotomous age variable that split age at 55 years, a significant age–hearing impairment interaction for early AMD (P = .03) was present. Among participants younger than 55 years, 8.7% (15 of 172) with hearing impairment had early AMD, whereas 1.8% (33 of 1865) without hearing
impair-ment had early AMD. Among those 55 years or older, 8.9% (20 of 224) of those with hearing impairment had early AMD, whereas 4.9% (27 of 547) without hearing impairment had early AMD. Incorporating this interaction into the multivariable model showed Table 5. Prevalence of Early Age-Related
Macular Degeneration by Age and Sex in the Beaver Dam Offspring Study
No. of Participants at Risk Prevalence, % (95% CI) Women, y 21-34 98 3.1 (0.6-8.7) 35-44 453 0.9 (0.2-2.2) 45-54 560 0.9 (0.3-2.1) 55-64 319 3.5 (1.4-5.5) 65-84 97 9.3 (4.3-16.9) All women 1527 2.1 (1.4-2.8) Men, y 21-34 70 1.4 (0.0-7.7) 35-44 369 3.5 (1.6-5.4) 45-54 487 4.5 (2.7-6.4) 55-64 280 6.8 (3.8-9.7) 65-84 77 10.4 (4.6-19.4) All men 1283 4.9 (3.7-6.1)
Men and women, y
21-34 168 2.4 (0.7-6.0) 35-44 822 2.1 (1.1-3.0) 45-54 1047 2.6 (1.6-3.5) 55-64 599 5.0 (3.3-6.8) 65-84 174 9.8 (5.4-14.2) Total 2810 3.4 (2.7-4.0)
Abbreviation: CI, confidence interval.
Table 6. Age- and Sex-Adjusted Logistic Regression Estimates for Outcome Early Age-Related
Macular Degeneration in the Worse Eye in the Beaver Dam Offspring Study
Characteristic Overall No. of Participants in Modela No. of Participants With the Characteristic OR (95% CI) Smoking status 2808 Never 1509 1 [Reference] Past 796 1.42 (0.88-2.30) Current 503 1.83 (1.06-3.17) Pack-years smoked 2783 0 1536 1 [Reference] 1 to⬍11 614 1.35 (0.78-2.33) ⱖ11 633 1.80 (1.12-2.91) Heavy drinking 2807 507 1.55 (0.97-2.49) Systolic BP, 10 mm Hg 2804 2804 1.02 (0.90-1.14) Diastolic BP, 10 mm Hg 2804 2804 0.93 (0.74-1.15) Hypertensionb 2807 1010 1.30 (0.84-2.03) BMI, per 1 point 2781 2781 0.99 (0.96-1.03) Obesity, BMIⱖ30 2783 1243 0.84 (0.55-1.28) Exercisec 2806 1708 1.25 (0.81-1.92) Hearing loss 2808 396 2.34 (1.45-3.77) White blood cell count,
per 1000/µL
2745 2745 0.95 (0.85-1.07) Hematocrit, per 5% 2745 2745 0.79 (0.58-1.09) Platelet count, per
50 000/µL
2745 2745 0.96 (0.81-1.14) Serum total cholesterol
level, per 10 mg/dL
2748 2748 0.99 (0.94-1.04) Serum total cholesterol,
mg/dL 2748 ⬍200 1315 1 [Reference] 200-239 986 0.67 (0.41-1.09) ⱖ240 447 0.95 (0.52-1.71) Serum HDL cholesterol level, per 5 mg/dL 2747 2747 0.90 (0.83-0.99) Maximum IMT, per
0.1 mm 2769 2769 1.00 (0.96-1.04) Maximum IMT,⬎1.0 mm 2769 854 1.14 (0.72-1.80) Educational level, y 2796 ⱕ12 894 1.28 (0.76-2.18) 13-15 950 1.43 (0.85-2.43) ⱖ16 952 1 [Reference]
Annual income level, $
2723
⬍30 000 339 1.56 (0.74-3.31)
30-50 000 556 1.53 (0.79-3.00)
⬍50 000-100 000 1269 1.17 (0.63-2.15)
⬎100 000 559 1 [Reference]
Abbreviations: BMI, body mass index (calculated as weight in kilograms divided by height in meters squared); BP, blood pressure; CI, confidence interval; HDL, high-density lipoprotein; IMT, intimal-medial thickness; OR, odds ratio.
SI conversion factor: To convert total and HDL cholesterol to millimoles per liter, multiply by 0.0259.
aNumbers vary because of missing data.
bDefined as a systolic BP of 140 or higher, diastolic BP of 90 or higher, or currently taking BP medication.
cFor this variable, 0 = those who report no weekly exercise, and 1 = those who report weekly exercise. Therefore, the reference group = no weekly exercise.
that among persons younger than 55 years, the OR for early AMD among those with hearing impairment compared with those without was 4.33 (95% CI, 2.26-8.29), whereas, among those 55 years and older, the OR was 1.57 (0.85-2.92).
COMMENT
The BOSS provides prevalence data on various signs of AMD in a well-defined large cohort of people over a wide age range beginning at age 21 years. Standardized de-tailed procedures were used for obtaining digital color fundus images of the macula, and an objective system was used for grading those images for AMD.14-16This al-lowed comparisons of the frequency of specific lesions associated with AMD to population-based studies that used similar grading systems.1-6,16The main findings of the study include the relatively low prevalence of early AMD, especially among those younger than 55 years, the higher prevalence of early AMD in men, and the asso-ciation of early AMD with a history of current smoking and amount smoked, serum HDL cholesterol level, and hearing impairment.
The prevalence of AMD in the BOSS cohort was 3.4%. No one in the cohort had signs of late AMD. These low prevalence estimates, compared with previous studies, do not appear to be totally explained by the younger age of the cohort. Using definitions similar to those used in the BDES to define AMD in the BOSS, age-specific preva-lence rates were lower among those in the BOSS com-pared with the BDES (43-54 years, 2.7% vs 8.6%; 55-64 years, 5.0% vs 15.6%; and 65-84 years, 9.8% vs 29.1%), and the overall direct age-sex adjusted (using the BDES as standard) prevalence rate of AMD was 6.3% com-pared with 19.1% in the BDES, suggesting that the preva-lence of AMD may actually be decreasing over time. How-ever, this finding may also reflect a birth period cohort effect and is consistent with the birth-period cohort effect found for early AMD in the BDES.17,18In that study, for most age groups, there was a lower 5-year incidence of early AMD in later birth cohorts or periods.18For ex-ample, the 5-year incidence rates of early AMD in people examined when they were 65 to 69 years was 13.5% among those born from 1918 through 1922, 10.0% among those born from 1923 through 1927, 6.0% among those born from 1928 through 1932, and 3.7% among those born from 1933 through 1937. It is thought that persons born at dif-ferent times or seen in difdif-ferent periods may have differ-ing exposures to factors (eg, smokdiffer-ing, uncontrolled blood pressure, sedentary lifestyle, and intake of multivita-mins) and different patterns of care for systemic condi-tions (eg, inflammatory or infectious disease) that may affect the incidence of AMD.
A second possible reason for the decreased prevalence of early AMD in the BOSS might be owing, in part, to dif-ferences resulting from the grading of AMD from digital (BOSS) and film images (BDES). However, this is less likely in that it has been shown that detection of AMD resulting from high-resolution digital images, especially when the pupil is pharmacologically dilated, is comparable with those resulting from film-based images, with moderate to
al-most perfect agreement between the digital and film-based cameras for detecting AMD and its lesions.14
The BOSS data show that early AMD and specific le-sions defining early AMD are infrequent among persons younger than 55 years and increase markedly in people aged 65 years or older. There are few data to compare the frequencies of lesions characterizing early AMD in young adults with rates reported in the BOSS.19-21In a histopathological study of 182 unpaired postmortem hu-man maculae from patients aged 8 to 100 years, van der Schaft et al19first found hard drusen beginning at age 34 years and soft drusen at age 54 years. In a twin study, at least 1 small hard drusen was found in the macular area in 18 of 220 participants (8.2%) ages 20 to 46 years.20 Only 2 participants (0.9%) in that study had soft drusen present. In the population-based Colorado-Wisconsin Study of Age-Related Maculopathy, the prevalence of AMD among participants aged 20 to 42 years was 6.0% among non-Hispanic whites and 6.7% among Hispanics in the San Luis Valley.21The lower prevalence in the BOSS may reflect geographic differences or birth cohort effects be-cause these photographic images were obtained in the 1980s.
The presence of larger areas of small hard drusen in-creases the risk of developing soft drusen and pigmen-tary abnormalities. During a 15-year follow-up period in the BDES, compared with eyes with approximately 1 to 3 small hard drusen, large areas of small hard retinal dru-sen (ⱖ9087 µm2,ⱖ8 with a mean diameter of 40 µm), in the absence of larger soft drusen or pigmentary abnor-malities at baseline, were associated with a 3-fold in-crease in the risk of developing soft indistinct drusen and pigmentary abnormalities, signs of early AMD.22In the presence of soft drusen at baseline in the BDES, there was marked increase in the odds of developing late AMD (OR, 13.0). The findings from the BOSS indicate about 16% (74 of 470) of persons younger than 40 years had 8 or more small hard drusen based on estimates from total area of the macula involved with drusen, and were at higher risk of developing signs of early AMD during the next 15 years of follow-up. Further follow-up of the cohort will be informative regarding actual risk of developing signs of early AMD in these young to early middle-aged adults.
Table 7. Multivariable Logistic Regression Estimates for Age-Related Macular Degeneration in the Beaver Dam Offspring Studya
Covariate OR (95% CI)
Age, per 5 y 1.22 (1.09-1.36)
Men vs women 1.65 (1.01-2.69)
Hearing loss 2.28 (1.41-3.71)
Serum HDL cholesterol, per 5 mg/dL 0.91 (0.83-0.998) Pack-years smoked
0 1 [Reference]
1 to⬍11 1.31 (0.75-2.29)
ⱖ11 1.67 (1.03-2.73)
Abbreviations: CI, confidence interval; HDL, high-density lipoprotein; OR, odds ratio.
SI conversion factor: To convert HDL cholesterol to millimoles per liter, multiply by 0.0259.
Although we found no significant age-sex interac-tion for early AMD, when we stratified by age group, we saw stronger associations between sex and early AMD among those younger than 55 years (age-adjusted men vs women OR, 3.68; 95% CI, 1.90-7.11) than we ob-served among those aged 55 years or older (1.61; 0.88-2.93). The reason for this is not clear. Our findings are consistent with a possible protective effect among younger women that is lost as they near menopause. It may re-flect hormonal differences between men and women. We have previously shown that use of hormone replace-ment therapy in postmenopausal women was associ-ated with a lower prevalence of RPE depigmentation com-pared with those not using hormone replacement therapy.23In an ancillary study to the Women’s Health Initiative, a clinical trial of hormone replacement therapy among 4262 postmenopausal women, those random-ized to conjugated equine estrogens combined with pro-gestin had a reduced risk of soft drusen (OR, 0.83; 95% CI, 0.68-1.00) and of neovascular AMD (0.29; 0.09-0.92) compared with those randomized to placebo.24
A history of cigarette smoking was associated with early AMD in the BOSS, independent of age, sex, and other risk factors. This relationship was expected because smok-ing has consistently been found to be associated with AMD in epidemiological studies.25Smoking is thought to de-press antioxidant levels, decrease luteal pigments in the retina, activate the immune system, reduce choroidal blood flow, reduce drug detoxification by the retinal pig-ment epithelium, and potentiate nicotine angiogenic ac-tivities, all of which have been hypothesized to be in-volved in the pathogenesis of AMD.26-32The relationship between heavy drinking and early AMD was of border-line statistical significance, and this variable was not re-tained in the multivariable model. A relationship with heavy drinking had been reported in the BDES and was attributed to the fact that heavy alcohol intake may re-duce antioxidant nutrients, resulting in increased oxi-dant stress in the retina.33,34However, only a few studies have found a relationship between alcohol consump-tion and AMD.35Heavy drinking is often associated with heavier cigarette smoking, so it is possible that a small amount of the smoking effect seen in this study may be attributable to heavy drinking.
Higher serum HDL cholesterol level was associated with lower prevalence of early AMD in the BOSS. The protective effect of serum HDL cholesterol level in the BOSS, an approximate 10% reduction in the odds per 5 mg/dL increase in HDL level (to convert to millimoles per liter, multiply by 0.0259) while controlling for other factors, was consistent with data from the Blue Moun-tains Eye Study but not most epidemiological stud-ies.35,36In the BDES and the Rotterdam Study, high se-rum HDL cholesterol level was associated with higher 5-year incidence of geographic atrophy.37-39The Multi-Ethnic Study of Atherosclerosis, the Pathologies Ocu-laires Lie´es à l’Age study, and a case-control study by Hy-man et al also found a positive relationship between HDL cholesterol level and AMD.40-42The reasons for the in-consistencies among studies are not understood. Most studies of early AMD found either a protective associa-tion or no associaassocia-tion, whereas most studies reporting
an adverse association were studying late-stage AMD. Dif-ferences in the distribution of AMD end points (and defi-nitions), sex, age of the cohorts, and serum HDL levels may contribute to the lack of consistency across stud-ies. Given the younger age in the BOSS compared with these studies, it is likely that this is an important factor in explaining the discrepancies. It is possible that among younger adults (including premenopausal women), se-rum HDL level has a protective effect for the develop-ment of early lesions that is not detectable at older ages. The opposite (positive) association observed for late AMD in some older cohorts may reflect the effects of early mor-tality for people with lower serum HDL levels or differ-ences in effects of factors that contribute to the devel-opment of early stages of AMD compared with those that contribute to the transition from early AMD to late AMD. Understanding the longitudinal relationships is further complicated by the impact of the changing patterns of medication usage, including antihypercholesterolemia agents and hormone replacement therapy, which have occurred during many of the older studies. Long-term follow-up studies from younger ages are needed to de-termine the impact of serum HDL level on the develop-ment and progression of early AMD.
Although atherosclerosis of the choroidal circulation and lipid deposition in the Bruch membrane have been thought to increase the risk of AMD, the BOSS data did not show a relationship between IMT or serum total cho-lesterol level and early AMD.
Few data are available regarding the relationship be-tween hearing loss and AMD in large cohorts.43The find-ing in the BOSS of an increase in the odds of havfind-ing early AMD in those with hearing loss compared with those with-out, after controlling for age and other risk factors, is con-sistent with the increased risk of late AMD (OR, 3.2) among persons with hearing loss in the BDES. The effect was more pronounced among younger persons in the BOSS cohort (age,⬍55 years), suggesting possible dif-ferences in the age-related processes affecting the reti-nal pigment epithelium and Bruch membrane that lead to development of signs of early AMD in the eye and changes in the cochlea or the auditory nerve that causes hearing loss. It is possible that this association reflects uncontrolled residual confounding from shared risk fac-tors for these 2 age-related sensory disorders. Alterna-tively, given the strong sex difference in hearing loss,9 some of the variability attributable to sex may be re-flected in this point estimate.
There are many strengths to this study, including the use of standardized protocols to measure risk factors and AMD end points. It is the largest study including younger adults and provides important insights about the onset of AMD. Participation was unrelated to the health (AMD, cardiovascular disease, or diabetes) of the parent popu-lation and unrelated to patterns of parental smoking and drinking. Although less educated families were slightly more likely to be included in these analyses, neither this study nor the BDES have demonstrated an association between educational level and AMD. Therefore, it is un-likely that the prevalence estimates have been affected by participation bias. Although this population is pre-dominantly non-Hispanic white, these data provide
im-portant estimates of the prevalence of AMD in baby boom-ers and younger generations not previously studied. Studying the offspring from a population-based cohort is a strong design for evaluating the impact of changing environmental and behavioral exposures in a geneti-cally similar group. The consistency of the reported re-sults when adjusting for familial correlations as well as their consistency with other published studies adds to the evidence that early AMD may be preventable at younger ages.
Any conclusions or explanations regarding associa-tions or lack of them, described herein, must be made with caution for a number of reasons, including the cross-sectional design. In this middle-aged cohort, the con-comitant low frequency of some risk factors (eg, maxi-mum IMT⬎1.0 mm) and of the prevalence of early AMD limits our ability to detect or reject meaningful relation-ships. Some factors important in the development of late, vision-threatening stages might contribute to the pro-gression of the disease but not to the development of early lesions, and, therefore, would be missed in this study of early stages of AMD. As in other studies of AMD, there may be misclassification of factors and uncontrolled con-founding that might impact the effect size estimates. Di-rect comparisons with the BDES must also be made with caution in that 3.6% of the BOSS cohort with gradable photographs were also participants in the baseline BDES. However, removing these participants from the BOSS did not change any of the reported associations (R.K. and K.J.C., unpublished data, 2009).
In summary, the BOSS data provide precise estimates of the prevalence of various signs of AMD (soft drusen, pigmentary abnormalities) over a wide spectrum of ages from the third to the ninth decade of life. They demon-strate that early AMD onset may occur in midlife. Some modifiable factors (smoking status and serum HDL cho-lesterol level) associated with AMD in older cohorts were associated with early AMD in this cohort of middle-aged adults. The higher frequency of AMD in people middle-aged 65 years or older in an aging American population makes this an important public health problem. Further infor-mation regarding the natural history of AMD and its risk factors, especially early in life, is important for develop-ing preventive approaches to it.
Submitted for Publication: August 18, 2009; final revi-sion received December 15, 2009; accepted December 18, 2009.
Correspondence: Ronald Klein, MD, MPH, Department of Ophthalmology and Visual Sciences, School of Medi-cine and Public Health, University of Wisconsin, 610 N Walnut St, Room 417 WARF, Madison, WI 53726 (kleinr @epi.ophth.wisc.edu).
Financial Disclosure: Dr R. Klein has served as a consul-tant to Pfizer and Genentech.
Funding/Support: This research was supported by grants AG021917 and R01AG021917 from the National Insti-tute on Aging, National Eye InstiInsti-tute, National InstiInsti-tute on Deafness and Other Communication Disorders, and Na-tional Institutes of Health (Dr Cruickshanks), and, in part, by Senior Scientific Investigator Awards from Research to Prevent Blindness (Drs R. Klein and B. E. K. Klein).
Role of the Sponsors: The National Institute on Aging provided funding for the entire study, including collec-tion and analyses of data. Research to Prevent Blindness provided further support for data analyses.
Disclaimer: The content is solely the responsibility of the authors and does not necessarily reflect the official views of the National Institute on Aging or the National Insti-tutes of Health.
REFERENCES
1. Klein R, Klein BE, Linton KL. Prevalence of age-related maculopathy: the Beaver Dam Eye Study. Ophthalmology. 1992;99(6):933-943.
2. Vingerling JR, Dielemans I, Hofman A, et al. The prevalence of age-related macu-lopathy in the Rotterdam Study. Ophthalmology. 1995;102(2):205-210. 3. Mitchell P, Smith W, Attebo K, Wang JJ. Prevalence of age-related maculopathy
in Australia: the Blue Mountains Eye Study. Ophthalmology. 1995;102(10): 1450-1460.
4. Klein R, Klein BE, Jensen SC, Mares-Perlman JA, Cruickshanks KJ, Palta M. Age-related maculopathy in a multiracial United States population: the National Health and Nutrition Examination Survey III. Ophthalmology. 1999;106(6): 1056-1065.
5. Varma R, Fraser-Bell S, Tan S, Klein R, Azen SP; Los Angeles Latino Eye Study Group. Prevalence of age-related macular degeneration in Latinos: the Los An-geles Latino Eye Study. Ophthalmology. 2004;111(7):1288-1297.
6. Mun˜oz B, Klein R, Rodriguez J, Snyder R, West SK. Prevalence of age-related macular degeneration in a population-based sample of Hispanic people in Ari-zona: Proyecto VER. Arch Ophthalmol. 2005;123(11):1575-1580.
7. Cruickshanks KJ, Schubert CR, Snyder DJ, et al. Measuring taste impairment in epidemiologic studies: the Beaver Dam Offspring Study. Ann N Y Acad Sci. 2009; 1170:543-552.
8. Cruickshanks KJ. Population-based epidemiologic studies of aging: the contri-butions of a Wisconsin community. WMJ. 2009;108(5):271-272.
9. Cruickshanks KJ, Wiley TL, Tweed TS, et al. Prevalence of hearing loss in older adults in Beaver Dam, Wisconsin: the Epidemiology of Hearing Loss Study. Am
J Epidemiol. 1998;148(9):879-886.
10. Cruickshanks KJ, Tweed TS, Wiley TL, et al. The 5-year incidence and progres-sion of hearing loss: the Epidemiology of Hearing Loss Study. Arch Otolaryngol
Head Neck Surg. 2003;129(10):1041-1046.
11. The ARIC Study Group. High-resolution B-mode ultrasound scanning methods in the Atherosclerosis Risk in Communities Study (ARIC). J Neuroimaging. 1991; 1(2):68-73.
12. The ARIC Study Group. High-resolution B-mode ultrasound reading methods in the Atherosclerosis Risk in Communities (ARIC) cohort. J Neuroimaging. 1991; 1(4):168-172.
13. Carlsson CM, Nondahl DM, Klein BE, et al. Increased atherogenic lipoproteins are associated with cognitive impairment: effects of statins and subclinical atherosclerosis. Alzheimer Dis Assoc Disord. 2009;23(1):11-17.
14. Klein R, Meuer SM, Moss SE, Klein BE, Neider MW, Reinke J. Detection of age-related macular degeneration using a nonmydriatic digital camera and a stan-dard film fundus camera. Arch Ophthalmol. 2004;122(11):1642-1646. 15. Klein R, Davis MD, Magli YL, Segal P, Klein BE, Hubbard L. The Wisconsin
age-related maculopathy grading system. Ophthalmology. 1991;98(7):1128-1134. 16. Klein R, Klein BE, Knudtson MD, et al. Prevalence of age-related macular
degen-eration in 4 racial/ethnic groups in the multi-ethnic study of atherosclerosis.
Ophthalmology. 2006;113(3):373-380.
17. Huang GH, Klein R, Klein BE, Tomany SC. Birth cohort effect on prevalence of age-related maculopathy in the Beaver Dam Eye Study. Am J Epidemiol. 2003; 157(8):721-729.
18. Klein R, Knudtson MD, Lee KE, Gangnon RE, Klein BE. Age-period-cohort effect on the incidence of age-related macular degeneration: the Beaver Dam Eye Study.
Ophthalmology. 2008;115(9):1460-1467.
19. van der Schaft TL, Mooy CM, de Bruijn WC, Oron FG, Mulder PG, de Jong PT. Histologic features of the early stages of age-related macular degeneration: a sta-tistical analysis. Ophthalmology. 1992;99(2):278-286.
20. Munch IC, Sander B, Kessel L, et al. Heredity of small hard drusen in twins aged 20-46 years. Invest Ophthalmol Vis Sci. 2007;48(2):833-838.
21. Cruickshanks KJ, Hamman RF, Klein R, Nondahl DM, Shetterly SM. The preva-lence of age-related maculopathy by geographic region and ethnicity: the Colorado-Wisconsin Study of Age-Related Maculopathy. Arch Ophthalmol. 1997;115 (2):242-250.
cumulative incidence of age-related macular degeneration: the Beaver Dam Eye Study. Ophthalmology. 2007;114(2):253-262.
23. Gao F, Wahba G, Klein R, Klein BEK. Smoothing spline ANOVA for multivariate Bernoulli observations, with application to ophthalmology data. J Am Stat Assoc. 2001;96(453):127-160.
24. Haan MN, Klein R, Klein BE, et al. Hormone therapy and age-related macular de-generation: the Women’s Health Initiative Sight Exam Study. Arch Ophthalmol. 2006;124(7):988-992.
25. Thornton J, Edwards R, Mitchell P, Harrison RA, Buchan I, Kelly SP. Smoking and age-related macular degeneration: a review of association. Eye (Lond). 2005; 19(9):935-944.
26. Pryor WA, Hales BJ, Premovic PI, Church DF. The radicals in cigarette tar: their nature and suggested physiological implications. Science. 1983;220(4595): 425-427.
27. Stryker WS, Kaplan LA, Stein EA, Stampfer MJ, Sober A, Willett WC. The rela-tion of diet, cigarette smoking, and alcohol consumprela-tion to plasma-carotene and␣-tocopherol levels. Am J Epidemiol. 1988;127(2):283-296.
28. Bettman JW, Fellows V, Chao P. The effect of cigarette smoking on the intra-ocular circulation. AMA Arch Opthalmol. 1958;59(4):481-488.
29. Friedman E. Choroidal blood flow: pressure-flow relationships. Arch Ophthalmol. 1970;83(1):95-99.
30. Hammond BR Jr, Wooten BR, Snodderly DM. Cigarette smoking and retinal ca-rotenoids: implications for age-related macular degeneration. Vision Res. 1996; 36(18):3003-3009.
31. Beatty S, Koh H, Phil M, Henson D, Boulton M. The role of oxidative stress in the pathogenesis of age-related macular degeneration. Surv Ophthalmol. 2000; 45(2):115-134.
32. Sun˜er IJ, Espinosa-Heidmann DG, Marin-Castano ME, Hernandez EP, Pereira-Simon S, Cousins SW. Nicotine increases size and severity of experimental cho-roidal neovascularization. Invest Ophthalmol Vis Sci. 2004;45(1):311-317.
33. Klein R, Klein BE, Tomany SC, Moss SE. Ten-year incidence of age-related macu-lopathy and smoking and drinking: the Beaver Dam Eye Study. Am J Epidemiol. 2002;156(7):589-598.
34. Knudtson MD, Klein R, Klein BE. Alcohol consumption and the 15-year cumu-lative incidence of age-related macular degeneration. Am J Ophthalmol. 2007; 143(6):1026-1029.
35. Klein R. Epidemiology of age-related macular degeneration. In: Penfold PL, Provis JM, eds. Macular Degeneration. New York, NY: Springer-Verlag; 2005:79-101. 36. Tan JS, Mitchell P, Smith W, Wang JJ. Cardiovascular risk factors and the
long-term incidence of age-related macular degeneration: the Blue Mountains Eye Study.
Ophthalmology. 2007;114(6):1143-1150.
37. Klein R, Klein BE, Franke T. The relationship of cardiovascular disease and its risk factors to age-related maculopathy: the Beaver Dam Eye Study. Ophthalmology. 1993;100(3):406-414.
38. Klein R, Klein BE, Jensen SC. The relation of cardiovascular disease and its risk factors to the 5-year incidence of age-related maculopathy: the Beaver Dam Eye Study. Ophthalmology. 1997;104(11):1804-1812.
39. van Leeuwen R, Klaver CC, Vingerling JR, et al. Cholesterol and age-related macu-lar degeneration: is there a link? Am J Ophthalmol. 2004;137(4):750-752. 40. Hyman L, Schachat AP, He Q, Leske MC; Age-Related Macular Degeneration Risk
Factors Study Group. Hypertension, cardiovascular disease, and age-related macu-lar degeneration. Arch Ophthalmol. 2000;118(3):351-358.
41. Delcourt C, Michel F, Colvez A, Lacroux A, Delage M, Vernet MH; POLA Study Group. Associations of cardiovascular disease and its risk factors with age-related macular degeneration: the POLA Study. Ophthalmic Epidemiol. 2001; 8(4):237-249.
42. Klein R, Knudtson MD, Klein BE, Wong TY, Cotch MF, Barr RG. Emphysema, airflow limitation and early age-related macular degeneration. Arch Ophthalmol. In press. 43. Klein R, Cruickshanks KJ, Klein BE, Nondahl DM, Wiley T. Is age-related
macu-lopathy related to hearing loss? Arch Ophthalmol. 1998;116(3):360-365.
From the Archives of the ARCHIVES
S
ince the author has maintained the view that in transplantation of the cornea, analogously with that of all other tissues, a gradual replacement of the trans-planted flap takes place through the entrance of ele-ments from the neighborhood and that this explains both the regular mishaps attendant on total keratoplasty in cases of total adherent leucomata and also the main-tained clearness of the flaps in partial keratoplasty and in total in clear animal corneas, our knowledge concern-ing transplantation has become broader. But the over-whelming majority of successful transplantations of the thyroid, ovary, and breast, are cases of autoplasty, simple displacement in the same individual, while homoplasty is much less promising, and the possibility of a success-ful heteroplasty can be looked for only in the lower spe-cies of animals. Hence it is physiologically impossible that the cornea of a rabbit can be transplanted into the eye of a man and preserve its structure. According to the re-sults of Fuchs and Zirm, the use of human cornea evi-dently affords better chances for the preservation of large portions of the flap.Reference: Salzer F. Experimental contributions to the
question of keratoplasty: presentation to the Heidel-berg Ophthalmological Society, August 7, 1908. Arch Oph-thalmol. 1909;38:70-71.
Note: Fritz Salzer (1867-1952), an ophthalmologist
from Munich, Germany, was a pioneer in keratoplasty and keratoprosthesis.