行政院國家科學委員會專題研究計畫 成果報告
完整的不排水軟粘土模式發展及應用
研究成果報告(精簡版)
計 畫 類 別 : 個別型 計 畫 編 號 : NSC 99-2221-E-146-005- 執 行 期 間 : 99 年 08 月 01 日至 100 年 07 月 31 日 執 行 單 位 : 華夏技術學院資產與物業管理系 計 畫 主 持 人 : 謝百 共 同 主 持 人 : 簡紹琦 計畫參與人員: 碩士班研究生-兼任助理人員:陳欣儀 碩士班研究生-兼任助理人員:隋昌斌 報 告 附 件 : 出席國際會議研究心得報告及發表論文 處 理 方 式 : 本計畫可公開查詢中 華 民 國 100 年 08 月 18 日
行政院國家科學委員會專題研究計畫期末報告
完整的不排水軟粘土模式發展及應用
Development of the integrated undrained soft clay model with its
application
計畫編號:
NSC 99-2221-E-146 -005
執行期限:99 年 08 月 01 日至 100 年 07 月 31 日
主持人:謝百鈎 華夏技術學院資產與物業管理系
ABSTRACT
The nonlinearity and small strain char-acteristics of clay are predominant factors to affect the analysis accuracy of surface set-tlement induced by deep excavation in soft clay. In this study we use a newly developed constitutive model, namely the undrained soft clay (USC) model, to simulate the nonlinearity of soft clay and to describe the degradation of elastic Young’s modulus with the increasing stress level, ranging from small strain to near failure. The parameters of the formula can be obtained from conven-tional soil tests. One well-documented case history is then used to show the parameter determination procedure and validate the proposed model. The states of strain and stress paths for the soil in the excavation are also studied to validate the rationality of the model.
Keywords: deep excavation; the USC model; nonlinearity; small strain charac-teristics 摘要 黏土非線性及小應變的特徵,是影響 軟弱黏土中開挖引致地表沉陷之分析正確 性的主要因素。本研究利用一稱為不排水 軟黏土(USC)模式的新發展組合律模式,模 擬軟弱黏土的非線性行為,以及描述由小 應變至接近破壞時,楊氏模數隨應力水平 增力而劣化的行為。USC 模式之參數皆可 由傳統的試驗中獲得。因此本研究利用一 已發表、有詳細試驗及監測結果的開挖案 例,來表示參數的決定程序,並印證 USC 模式的適用性,同時也針對開挖區中央土 壤的應力路徑及應變狀態進行研究,以印 證USC 模式的合理性。 關鍵詞:深開挖、不排水軟黏土模式、非 線性、小應變特徵 1. INTRODUCTION
When analyzing surface settlement in-duced by excavation by using the finite ele-ment method, many people have found that the computed distribution and magnitude of surface settlement cannot satisfactorily rep-resent the real condition as observed in the field, though the analysis can predict lateral wall deflection well (e.g., Finno and Harahap 1991, Whittle et al. 1993, Lin et al. 2002). In general the maximum settlement is underes-timated while settlements in the secondary influence zone are overestimated. The main reason causing such a deviation is that the high stiffness of soil at small strain is not considered (Kung et al. 2009).
Ou et al. (1998) carried out a complete observation on an excavation case in Taipei. The observation results show that, at early stages, the strains in back of the wall are generally smaller than 0.1% except near the wall. In the secondary influence range, the strains of soil are even smaller than 0.01%. After the completion of excavation, the maximum strain in the primary influence range is about equal to 0.6% while the strains in the secondary influence range are gener-ally within 0.1%-0.01%. From the above ex-planation, we can observe that the error of the finite element analysis might be quite large if the small strain characteristics of soil are not well considered in the analysis.
In this paper the undrained soft clay model, abbreviated as the USC model, is used to simulate the nonlinearity of soft clay and to describe the degradation of elastic Young’s modulus, ranging from small strain to near failure. One well-documented case history is used to validate the proposed model, parameter determination procedure and rationality of the model.
2. THE CONSTITUTIVE MODEL
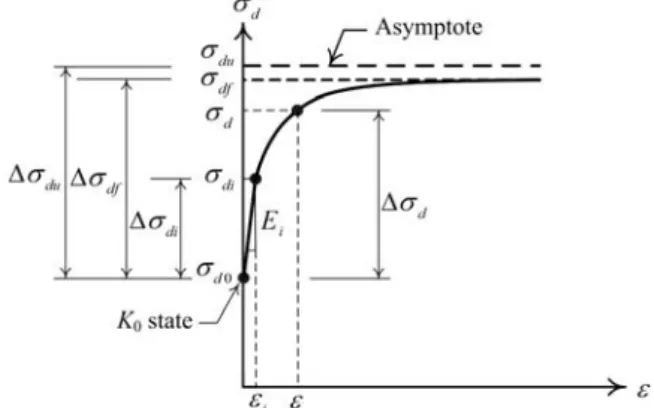
Following the work by Duncan and Chang (1970) and Vaid (1985), the nonlinear part of the relationship of deviator stress and strain can be expressed as
df f i d R E σ ε ε σ Δ + = Δ 1 , (1)
where Δσd is the increment of deviator stress beyond the K state, 0 Δσd=σd-σd0;
d
σ is the deviator stress, σd = σ1−σ3 where σ and 1 σ3 denote the major and mi-nor principal stresses, respectively; σd0 is the deviator stress at the K state; 0 Δσdf is the increment of deviator stress at the failure state beyond the K state; 0 Δσdf =σdf -σd0 where σdf is the deviator stress at the fail-ure state; E is the initial Young’s modulus; i
f
R is the failure ratio, Rf =Δσdf /Δσdu ;
du
σ
Δ is the increment of deviator stress at the ultimate state beyond the K state, 0
du
σ
Δ =σdu-σd0 where σdu is the deviator stress at the ultimate state ; ε is the strain.
Differentiating Equation (1) with re-spect to strain, the tangent Young’s modulus (Et) can be derived as 2 ) 1 ( R SL E Et = i − f , (2) where SL is the stress level, SL=Δσd/Δσdf .
Since soil usually exhibits high stiffness at small strain and its behavior is that of line-arly elastic response (e.g., Jardine 1992, Shi-buya and Mitachi 1997, Ng et al. 2000, Kung and Ou 2004), an elastic surface, ES , is constructed to represent the linearly elastic response for the state of stress within the elastic surface. The elastic surface on the q-V coordinate is expressed as 0 1 2 ) ( 2 2 2 0 − = ⎟⎟ ⎠ ⎞ ⎜⎜ ⎝ ⎛ Δ + − = uc di s V q q ES σ , (3)
where q is the normalized deviator stress on the x-y plane, q = [(σy-σx)/2]/suc; σy is the vertical total stress; σxis the horizon-tal tohorizon-tal stress; suc is the undrained shear
strength obtained from the triaxial AC
U
CK0 − test; V is the normalized shear stress in the x-y plane, V=τ /suc; τ is the shear stress on the x-y plane; q is the 0 q-value at the K0 condition; Δσdi is the in-crement of deviator stress beyond the K 0 state that corresponds to the threshold value of the elasto-plastic response or initial yield strain in the triaxial loading condition,
di
σ
Δ =σdi -σd0 =Eiεi ; εi is the threshold value of the small strain or initial yield strain;
di
σ is the deviator stress corresponding to initial yield strain.
Therefore, when the state of stress is within the elastic surface, i.e., ( q -q )0 2+V2
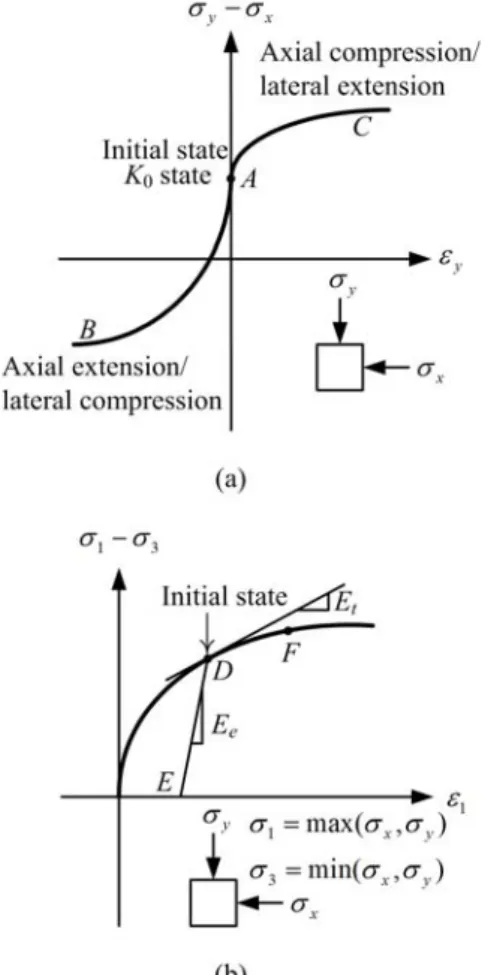
≤ [(Δσdi /2)/suc]2, its behavior is linearly elastic and its Young’s modulus is treated as the initial Young’s modulus ( Ei) or the maximum elastic Young’s modulus, Ee,max. When the state of stress exceeds the elastic surface, the soil is in the primary state and its behavior is elastoplastic. Figure 1 shows the relationship of deviator stress and strain, in-cluding the small strain response, from the Ko state to the initial yield state, and elastoplas-tic response, from the initial yield state to the failure state.
Figure 1. Definition of the parameters that describe the stress-strain relationship.
On the other hand, when the state of stress exceeds the elastic surface, the elastic Young’s modulus, Ee, degrades with the in-creasing stress level (SL ) (Wood 1990). Figure 2 shows the schematic representation of the degradation of Ee and its relation to the tangent Young’s modulus. In the USC model, the degraded Young’s modulus is
as-sumed to follow a hyperbolic function: ) ( 1 i i i e SL SL n m SL SL E E − + − − = , (4) where SLi is the stress level corre-sponding to the threshold value of the small strain or the initial yield strain; m and n are the degradation parameters.
Figure 2. Schematic description of the deg-radation of the elastic Young’s modulus.
Figure 3(a) shows the relationship be-tween Ee/Ei and the increment of the stress level,(SL−SLi).Similar to Duncan and Chang (1970), the degradation parameters, m and n, can be found on the basis of 95%(1-E /ef Ei) and 70%(1-E /ef Ei ) from the transformed linear relationship , as shown in Figure 3(b) where E denotes the elas-ef tic Young’s modulus at the failure state.
By replacing E in Equation (2) with i the Young’s modulus, E , at the current e stress, as evaluated from Equation (4), the tangent Young’s modulus of the soil for the state of stress outside the elastic surface, orSL>SLi, can be rewritten as 2 ) 1 ( R SL E E d e f t ∂ = − Δ ∂ = ε σ . (5) For the state of stress inside the elastic surface or SL≤SLi, the small strain should be considered. The tangent Young’s modulus is i d t E E = ∂ Δ ∂ = ε σ . (6) When soil is subject to unload-ing/reloading, its behavior is also linearly elastic. The unloading/reloading modulus,
ur
E , should be used for such a condition, its
ur
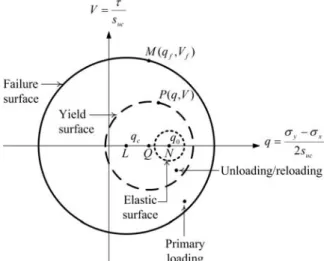
E should be equal to E as evaluated e from Equation (4). In the original Dun-can-Chang model, the stress level, as defined by the ratio of current deviator stress (σd) to the deviator stress at failure (σdf ), is used to determine if the soil is in the primary loading state or the unloading/reloading state. The stress level defined in this way, only consid-ering the magnitudes of the major and minor principal stresses in the triaxial compression or extension state, seems to be insufficient to describe the complex stress states. In the USC model, the concept of a yield surface is adopted to differentiate the loading state, in-stead of the principal stress difference. The failure surface and yield surface can be ex-pressed, respectively, by the following equa-tions: Failure surface 2 2 2 ) (q q V R F = f − c + f = , (7) Yield surface 2 2 2 2 0(1 )] [q−qcSL−q −SL +V =SLR , (8)
Figure 3. Determination of the degradation parameters: (a) variation of elastic Young’s modulus and (b) transformation of the stress-strain relationship.
where q is the f q value at the failure condition; q is the q value at the center c of the failure surface, qc=(1-Ks)/2; K is the s anisotropic undrained strength ratio, K = s
ue
s /s ; uc s is the undrained shear strength ue from the CK0U−AE test; Vf is the V
value at the failure condition; R is the radius of the failure surface, R= [(3Ks+1)(Ks+3)/12]1/2; SL is the stress level at the current stress state; and SLR is the ra-dius of the yield surface.
Figure 4 shows the relationship between the elastic surface, yield surface and failure surface.
Figure 4. Relationship among elastic surface, yield surface and failure surface.
The stress level corresponding to the current stress state (q, V) can then be deter-mined by substituting the current stress state (q, V) into Equation (8). Note that the stress level as defined in the original hyperbolic model is a special case of the new definition of stress level for K =1. For the stress paths 0 of axial undrained compression tests and ax-ial extension tests, the new stress level defi-nition gives the same results as those pro-posed by Vaid (1985).
In the analysis, when the state of stress is within the elastic surface, i.e., (q -q )0 2+V2 ≤ [(
di
σ
Δ /2)/s ]uc 2, the Young’s modulus (Ei) at small strain should be used, i.e., E= . When the state of stress is out-Ei side of the elastic surface, i.e., (q -q )0 2+V 2
> [(Δσdi/2)/s ]uc 2, and the current stress level,
current
SL , is smaller than the past maximum stress level, SLpast,max , the soil is in the unloading/reloading state where the unload-ing/reloading Young’s modulus (E ) or the ur elastic Young’s modulus, E , at the current e stress state should be employed. When the state of stress is on the yield surface and
current
SL = SLpast,max , the tangent Young’s modulus (Et) should be used.
Furthermore, Δσdf in Equation (1), or the undrained shear strength, often varies with the principal rotation. Therefore, it is necessary to take the strength anisotropy into account when the state of stress reaches the failure condition. In the USC model, the undrained shear strength (suβ−ps) in the
di-rection of β , under the plane strain condi-tion, can be estimated by the following equa-tion, which was derived by Hsieh et al. (2008): uc c c ps u R q q s s [ 2 ( sin2β)2 cos2β] β− = − + (9)
where β is the angle between the major prin-cipal direction and the vertical direction.
A total of seven parameters are required for the USC model to describe the undrained soft clay model, that is, s , uc E , εi i, R , and f
s
K ,as well as m and n. Of these,s and uc R f are exactly the same as those in the original Duncan-Chang model. E can be obtained i from small strain tests, bender element tests or empirical correlations and εi from small strain tests or empirical correlations. Based on Jardine (1992), εi is between 10-3%~10-5%.
s
K is obtained from triaxial compression tests and extension tests. m and n can be ob-tained from multiple unloading-reloading tests.
3. CALIBRATION
A TNEC (Taipei National Enterprise Center) excavation case is examined the characteristics and rationality of the model when it is applied to the actual problem. In the TNEC case history (Ou et al. 1998), many types of soil tests, such as small strain tests, triaxial CK0U −AC and CK0U−AE tests and multiple unloading-reloading tests
have been conducted, some of which are necessary to evaluate the parameters of the USC model.
3.1 Description of the project and soil condi-tion
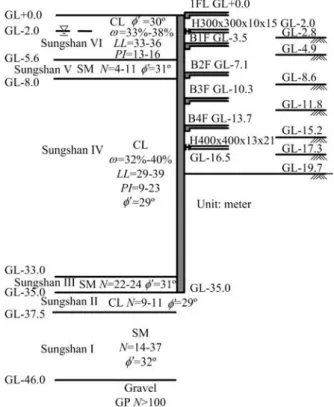
The TNEC is a 30-story structure with a four-level basement, which is located in the Taipei geological K1 subzone. The width of the TNEC is 43 m, and the lengths of the southern and northern edges of the excava-tion were 106 m and 61 m, respectively. The excavation depth of the TNEC basement was 19.7 m. The diaphragm wall was 1.0 m in thickness, and extended from the ground surface down to a depth of 35 m. The TNEC basement was constructed using the top- down construction method, in which the wall was supported by 150mm thick concrete floor slabs. The basement was completed in seven stages. A profile of the diaphragm wall, lateral supports (concrete floor slabs), and excavation stages are shown in Figure 5. Figure 5 also shows the soil profile at the TNEC site, along with the basic soil proper-ties. The complete data, including soil prop-erties and strength, were described by Ou et al. (1998) and Kung et al. (2009).
3.2 Mesh and boundary conditions
Figure 5. Profiles of the excavation sequence and subsurface soil layers for the TNEC case.
The finite element mesh for the TNEC case is shown in Figure 6, in which the ver-tical boundaries are restrained from horizon-tal movement. The bottom is set at the gravel formation and is considered to be restrained from both vertical and horizontal movement. The left vertical boundary is set in the middle of the excavation zone, and the right bound-ary is 100 m from the wall.
Figure 6. Finite element mesh used for analy-sis of the TNEC case.
3.3 Parameters for analysis
In the analysis, the diaphragm wall and lateral supports are assumed to behave as a linear-elastic material. The struts and con-crete floor slabs are simulated as bar ele-ments. The parameters of the wall, the con-crete floor slabs, and the struts are as shown in Tables 1 and 2
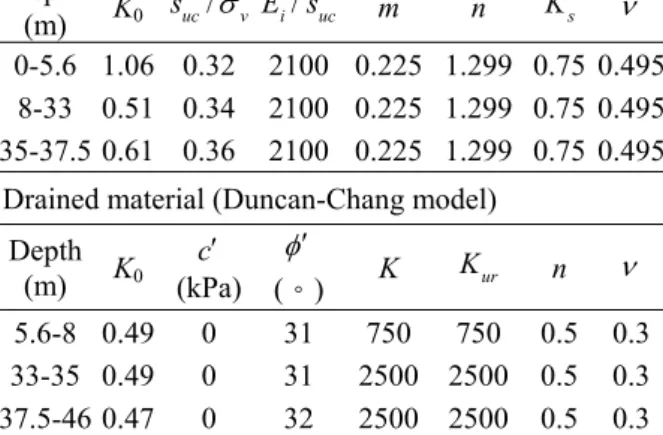
The clay layers are simulated with the USC model and the sand layers with the Duncan-Chang model. With the USC model, seven parameters, including s , εuc i, E ,i R , f
and K as well as m and n, are determined s by laboratory tests conducted in this study, as shown in Table 3, in which the s is ob-uc tained from triaxial CKU0 −AC tests; K s is determined from triaxial CKU0−AC and CKU0 −AE tests; E is obtained i from bender element tests; and m and n are obtained from multiple unload-ing/reloading tests. R can be assumed to f be equal to 0.9 for most clay. According to the test results (e.g., Kung and Ou 2004, Hsieh and Ou 2011), the εi is approximately equal to 10-3% for the Taipei silty clay. In addition, the sand layer parameters for the Duncan-Chang model are determined based on those reported by Ou and Lai (1994). Other parameters are listed in Table 3.
Table 1. Dimensions of the diaphragm walls for the TNEC case and parameters used for analysis.
Case H (m) t (m) E(MPa)t ν
TNEC 35 0.9 19718 0.2 Note: H =depth of diaphragm wall; t
t =thickness of diaphragm wall;
E=Young’s modulus; and ν =Poisson’s ratio. Table 2. Dimensions of the lateral support for the TNEC case and structural parameters used for analysis.
Stage (mA 2) (m) T/S (MPa) E K st (MN/m/m) 1 0.012 -/5 100000 12.24 2 - 0.15/- 19718 150.90 3 - 0.15/- 19718 150.90 4 - 0.15/- 19718 150.90 5 - 0.15/- 19718 150.90 6 0.0219 -/3.4 100000 32.86 Table 3. Soil parameters used for analysis of the TNEC case.
Undrained material (USC model) Depth
(m) K0 s /uc σ ′ v E /i s m n uc Ks ν 0-5.6 1.06 0.32 2100 0.225 1.299 0.75 0.495
8-33 0.51 0.34 2100 0.225 1.299 0.75 0.495 35-37.5 0.61 0.36 2100 0.225 1.299 0.75 0.495
Drained material (Duncan-Chang model) Depth (m) K0 (kPa) c′ φ′ (。) K Kur n ν 5.6-8 0.49 0 31 750 750 0.5 0.3 33-35 0.49 0 31 2500 2500 0.5 0.3 37.5-46 0.47 0 32 2500 2500 0.5 0.3
3.4 Analysis results and discussions
The finite element analysis is performed following the construction sequence shown in Figure 5. Figure 7 shows the wall deflec-tions and surface settlements computed using the USC model with those from field obser-vation for stages 3, 4, 6 and 7. The computed wall deflections for these stages agree well with the field observations. The computed maximum wall deflection is almost the same as that observed for stages 3 and 4, while the computed maximum wall deflection at stage 7, which is equal to 11.1 cm, is slightly larger than the observed one, which is 10.6 cm.
Moreover, the development of the wall de-flection shape with the construction sequence and the location of the maximum wall de-flection computed from the model are also very close to those from field observation. The computed surface settlements are also in good agreement with the observed settle-ments. The location of the maximum surface settlement computed from the model is al-most the same as that from field observation. However, the computed maximum surface settlement at stage 7 is slightly less than that of the observed settlement. The USC model predicts both wall deflection and surface set-tlement well.
Figure 7. Comparison of the wall deflections and surface settlements from field observa-tion and those from analysis using the USC model for the TNEC case.
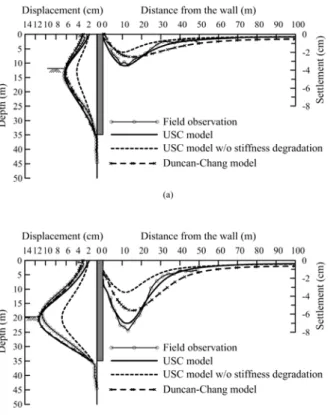
For comparison, analysis of the TNEC case using the USC model without consider-ing stiffness degradation is also executed. The parameters used in the analysis are ex-actly the same as those listed in Tables 1 through 3. The comparison of the wall de-flections and surface settlements for stages 4 and 7 are presented in Figure 8. Both the wall deflections and surface settlements for these stages are much smaller than the field obser-vations. The initial Young’s moduli, E / , i su are overestimated.
To investigate the effect of the new definition of stress level in the USC model on the prediction, analysis using the original Duncan-Chang model, where the stress level is defined by principal stress difference, was also conducted. Because the USC model considers both the high stiffness at small strain and stiffness degradation with stress level, the initial Young’s modulus, E / , i su should be estimated from the bender element test or from the stress strain relationship at a
strain of about 10−5−10−6. With the
Dun-can-Chang model, such a value would be too high to predict both the wall deflection and surface settlement. To make the Dun-can-Chang model comparable to the USC model in the analysis, E / in the Dun-i su can-Chang model is evaluated by back-analyzing the wall deflection computed from the USC model, that is, by adjusting its
u i s
E / value in the Duncan-Chang model until the computed wall deflection from the Duncan-Chang model matches that from the USC model. A value of E /i s =900 is thus uc obtained. The rest of the parameters are ex-actly the same as those listed in Table 3. Fig-ure 8 shows the analysis results for stages 4 and 7. As we can see from the figure, the computed surface settlements are far from the field observations, though the wall de-flections from the USC model and Dun-can-Chang model are pretty close.
Figure 9 shows variation of state of stress with excavation stages, which are ana-lyzed from both the USC model and Dun-can-Chang model, for the soil located at a
Figure 8. Comparison of the wall deflections and surface settlements from field observa-tion and those from analysis using various models for the TNEC case: (a) Stage 4 and (b) Stage 7.
depth of GL-20 m and in the excavation cen-ter. The corresponding Young’s moduli for the soil evaluated from the models for each stage are displayed in Figure 10. As shown in Figure 9, no matter what type of model is employed, the soil is subject to vertical ex-tension. The Young’s modulus evaluated from the USC model steadily decreases with the increasing excavation stage or stress level, as shown in Figure 10; its trend is similar to that in laboratory axial extension tests, as in-dicated by point A to B in Figure 11(a). The USC model yields reasonable and consistent mechanical behavior for the soil in the exca-vation zone.
Nevertheless, the Duncan-Chang model causes the soil, initially in the primary load-ing state to shift to the unloadload-ing-reloadload-ing state for excavation stages 1 and 2, as
Figure 9. Stress paths computed by different models for the soil at the excavation center.
Figure 10. Variation of Young’s modulus, evaluated from analyses with different mod-els, with stress level for the soil at the exca-vation center.
indicated by point D to E in Figure 11(b). The Young’s modulus evaluated from the model is virtually equal to the unload-ing/reloading Young’s modulus. When ex-cavation advances to stages 3 to 5, removal of the soil in the excavation zone will cause the principal stress rotation, i.e., σ =1 σx and σ3=σy, as shown in Figure 9. The soil is subject to the reloading condition, follow-ing the unloadfollow-ing-reloadfollow-ing line as indicated by point E to D. The Young’s modulus evaluated from the model is also equal to the unloading/reloading Young’s modulus, as shown in Figure 10. When excavation goes to stage 6, Young’s modulus jumps to a small value, which is inconsistent with the me-chanical behavior of soil. This result occurs because the deviatoric stress, σ1−σ3, at this stage is larger than the previous maximum deviator stress, which causes the state of stress to move beyond point D toward point F. The Duncan-Chang model yields unrea-sonable and inconsistent mechanical behav-ior for the soil in the excavation zone.
Figure 11. The stress strain relationship un-der the undrained loading condition: (a) K0 consolidation and (b) isotropic consolidation.
On the other hand, the soil outside the excavation zone, far from the diaphragm wall, should be subject to lateral unloading. The USC model causes the soil to stay in the pri-mary loading state, as indicated by point A to C in Figure 11(a). On the contrary, the Dun-can-Chang model induces the soil to move from the initial state, point D in Figure 11(b), to point F. The Young’s modulus at point D (E ) in Figure 11(b) is much smaller than t that at point A (E ) in Figure 11(a), which i causes the soil far from the diaphragm wall to have larger vertical settlement.
In many Asian countries, like Japan and Taiwan, the basal heave of an excavation is analyzed with the assumption that the critical circular surface is centered at the lowest level of strut and passes the toe level of the dia-phragm wall. The safety factor of the basal heave is defined as the ratio of the resisting moment, provided by the undrained shear strength along the critical circle, to the driv-ing moment, induced by the weight of soil outside the wall (Hsieh et al. 2008). There-fore, the undrained shear strength along the critical circle, as shown in Figure 12, is ex-amined to study the rationality of the undrained shear strength predicted by the USC model.
Figure 12. Representative soil elements along the critical circle adopted for basal heave analysis.
As shown in Figure 12, θ denotes the angles of representative elements, i.e., Ele-ments 1 to 9, along the critical circle relative to the horizontal line. All of the major prin-cipal directions of these elements before the
commencement of excavation are vertical, and their major principal directions are ini-tially oriented at an angle of β= 0. Figure 13(a) shows the orientation of the major principal direction computed by finite ele-ment analysis with the USC model for the soils at the final stage of excavation. The β value varies with the location of the elements, that is, from β= 0 for the soil behind the wall to β= 90o for the soil in front of the wall. Excavation gradually causes principal stress rotation, which induces a change in the undrained shear strength. Because the strength anisotropy is taken into account in the USC model, the undrained shear strength of the soil along the critical circle varies with the location of the elements. Figure 13(b) shows the ratio of the undrained shear strength (suβ−ps) under the plane strain con-dition computed from the analysis for the elements along the critical circle over that (su0−ps) for Element 1. It can be seen from this figure that the ratio decreases with in-creasing θ . For example, element 9 is an extreme case and the ratio of the undrained shear strength, i.e., su90−ps/su0−ps, is equal to 0.78, which is close to the test results (Ladd et al. 1977) The variation of undrained shear strength estimated from the USC model cer-tainly agrees with those of the CK0U test results.
5. CONCLUSIONS
The nonlinearity and small strain char-acteristics of clay are the predominant factors to affect the analysis accuracy for surface settlement induced by deep excavation in soft clay. In this study we introduce the previ-ously derived USC model, which is able to simulate the nonlinearity of soft clay and high stiffness of soil at small strain. A well-documented excavation case history, TNEC, is adopted to perform calibration study, that is, validation of the USC model, demonstration of its parameter determination procedure and study of the rationality of the model. For comparison, analysis with the Duncan-Chang model, in which the devia-toric stress based stress level is used, and analysis with the small strain characteristics,
but without consideration of stiffness degra-dation, is also conducted. It is found that analysis with the USC model can predict both the wall deflection and surface settle-ment very well. The Duncan-Chang model yields a poor prediction in surface settlement, even if the wall deflection matches the field observation by selecting appropriate stiffness parameters. Analysis while considering small strain but neglecting the stiffness degradation underestimates both the wall deflection and surface settlement.
Furthermore, this study also investigates the rationality of the model by inspecting the stress states and undrained shear strength of the soil inside and outside the excavation zone and their corresponding Young’s moduli. The USC model yields reasonable and consistent mechanical soil behavior in terms of variation of Young’s modulus and undrained shear strength for the soil in the excavation.
Figure 13. The undrained shear strength for the representative soil elements along the critical circle: (a) orientation of the major principal direction computed by the finite element analysis with the USC model and (b) variation of the undrained shear strength with the principal stress rotation.
計畫成果自評 本研究依研究計畫的規劃進行,將不 排水軟黏土(USC)模式發展完整並實際應 用於實務的開挖分析中,分析的結果顯 示,黏土層中開挖引致之連續壁側向位移 及地表沉陷,皆可獲的合理的預測,改善 了傳統上,以數值分析的方法分析深開挖 工程時,地表沉陷不易得到理想預測結果 之問題。 完整的USC 模式理論,以及試驗結果 的印證,已發表於 Journal of Mechanics (Hsieh and Ou 2011)。 除此之外,利用實際開挖案例的分析 驗證結果,也已投稿至Journal of the Chi-nese Institute of Engineers(Hsieh and Ou 2012),並已被接受,預計 2012 年刋出。 REFERENCES
Duncan, J.M., and Chang, C.Y., 1970. Nonlinear Analysis of Stress and Strain in Soils. Journal of the Soil Mechanics and Foundations Division, ASCE, 96(5), 637–659.
Finno, R.J., and Harahap, I.S., 1991. Finite Element Analysis of HDR-4 Excavation. Journal of Geotechnical Engineering, ASCE, 117(10), 1590−1609.
Hsieh, P.G., and Ou, C.Y., 2011. Analysis of Nonlinear Stress and Strain in Clay Under the Undrained Condition. Journal of Me-chanics, 27(2), 201-213.
Hsieh, P.G.,and Ou, C.Y., 2012. Analysis of Deep Excavations in Clay under the Undrained Condition with Small Strain Characteristics,” tentatively scheduled to appear in Vol. 35 of the Journal of the Chinese Institute of Engineers.
Hsieh, P.G., Ou, C.Y., and Liu, H.T., 2008. Basal Heave Analysis of Excavations with Consideration of Anisotropic Strength of Clay. Canadian Geotechnical Journal, 45(6), 788–799.
Jardine, R.J., 1992. Some Observations on the Kinematic Nature of Soil Stiffness. Soils and Foundations, 32(2), 111–124. Kung, T.C., and Ou, C.Y., 2004.
Stress-Strain Characteristics of Taipei Silty Clay at Small Strain. Journal of the Chinese Institute of Engineers, 27(7), 1077–1080.
Kung, T.C, Ou, C.Y., and Juang, C.H., 2009. Modeling Small-Strain Behavior of Taipei Clays for Finite Element Analysis of Braced Excavations. Computers and Geo-technics, 36(1-2), 304-319.
Ladd, C.C., Foott, R., Ishihara, K., Schlosser, F., and Poulos, H.G., 1977. Stress- Deformation and Strength Characteristics. In Proceedings of the 9th International Conference on Soil Mechanics and Foundation Engineering, Tokyo, Japan, Vol. 2, pp. 421–494.
Lin, H.D., Wang, C.C., and Ou, C.Y., 2002. Time-Dependent Displacement of Dia-phragm Wall Induced by Soil Creep. Journal of Chinese Institute of Engineer, 25(2), 223–231.
Ng, C.W.W., Pun, W.K., and Pang, R.P.L., 2000. Small Strain Stiffness of Natural Granitic Saprolite in Hong Kong. Journal of Geotechnical and Geoenvironmental Engineering, 126(9), 819–833.
Ou, C.Y, and Lai, C.H., 1994. Finite Element Analysis of Deep Excavation in Layered Sandy and Clayey Soil Deposits. Canadian Geotechnical Journal, 31(2), 204–214.
Ou, C.Y., Liao, J.T., and Lin, H.D., 1998. Performance of Diaphragm Wall Con-structed Using Top-Down Method. Jour-nal of Geotechnical and Geoenvironmen-tal Engineering, 124(9), 798–808.
Shibuya, S., and Mitachi, T., 1997. Development of a Fully Digitized Triaxial Apparatus for Testing Soils and Soft Rocks. Geotechnical Engineering Journal, SEAGS, 28(2), 183–207.
Vaid, Y.P., 1985. Effect of Consolidation History and Stress Path on Hyperbolic Stress-Strain Relations. Canadian Geotechnical Journal, 22(2), 172–176. Whittle, A.J., Hashash, Y.M., and Whitman,
R.V., 1993. Analysis of Deep Excavation in Boston. Journal of Geotechnical Engi-neering, ASCE, 119(1), 69−90.
Wood, D.M., 1990. Soil Behavior and Critical State Soil Mechanics. Cambridge, MA: Cambridge University Press.
1
國科會補助專題研究計畫項下出席國際學術會議心得報告
日期:100 年 5 月 20 日一、參加會議經過
由財團法人地工技術研究發展基金會及中國建築業協會深基礎施工分會主辦
2011兩岸地工技術/岩土工程交流研討會,於2001年5月12至14在廣州東方賓館舉行。
本次會議的主旨為地下工程災害事故的防控與處理,包括以下六個主題內容:
1.理
地震、冰凍、颱風、洪水對基礎工程的破壞及應對
2.
開挖、隧道坍塌事故的防控與處理
3.
地下工程風險管理與災害防控基礎理論
4.
河海隧道(含沉埋管)與深開挖建造技術
5.
特殊地層、岩溶地層潛盾設計施工技術
用
6.區
域岩土工程案例分析
計畫編號
NSC99-2221-E-146 -005
計畫名稱
完整的不排水軟粘土模式發展及應用
出國人員
姓名
謝百鈎
服務機構
及職稱
華夏技術學院
資產與物業管理系 教授
會議時間
100 年 5 月 12 日至
100 年 5 月 14 日
會議地點
廣州,中國
會議名稱
(中文) 2011 海峽兩岸岩土工程/地工技術交流研討會
(英文)
2011 Cross-Strait Seminaron Ground Engineering
發表論文
題目
(中文)開挖幾何條件對地中壁抑制連續壁位移之影響
(英文) Influence of excavation geometry on effects of diaphragm wall
movements restrained by cross walls
此次研討會中,台灣方面共發表36篇論文,大多數都是實務性質或與地下工程
之風險管理、災害防救、天然災害對基礎工程的破壞等相關的文章,反應了這幾年
在台灣工程發展過程中,地下工程建設的因難及心血結晶;大陸方面則收錄了60餘
篇論文。
本次會議同時邀請了兩岸知名的專家和學者,對地工技術及岩土工程發展動態
作了10場內容相當精彩且精闢的專題演講,其中包括許多台灣及大陸過去的發展、
現在的重大工程的設計、分析及施工方法等方向,並進行了深入的討論,對於未來
的發展議題提出許多新方向及思維,這些過去的回顧及新的觀點,讓與會人員獲益
良多。在每場專題演講後也皆引發與會人員許多想法及觀念,因此也引起相當熱烈
及廣泛、深入的交流與討論,讓與會人員獲益良多。
而大會除了上述精彩專題演講外,同時也針對各領域進行各分組報告及討論,
總共分為五個場次研討,發表論文的學者針對發表的論文進行簡報後,再由參與人
員與發表學者充分討論,對於許多議題有許多新的見解,同時亦得到許多教授之寶
貴意見。
本 人 發 表 之 論 文 題 目 為 : 開 挖 幾 何 條 件 對 地 中 壁 抑 制 連 續 壁 位 移 之 影 響
(Influence of excavation geometry on effects of diaphragm wall movements restrained by
cross walls),所屬領域為
地下工程風險管理與災害防控基礎理論
,並於5月12日下午
進行口頭發表。會後亦和許多專家進行深入的討。
二、與會心得
3
參與報告及討論,了解目前在工程地質及大地工程各項研究議題之發展,亦對於具
潛力之研究方向有所了解。對於個人未來研究方向有極大之幫助。
除此之外,對緊湊的會議討論及與會學者提出新議題,都讓本人獲益良多,而
對於研究的堅持程度,往往在討論中可以瞭解到教授們之專精及與會者對於問題的
執著,都是值得學習的地方。參與此次的會議,不僅對專業知識的精進有相當程度
之助益,亦認識了相當多同領域的專家,以及與各學校的教授及業界互相交流,對
地下工程災害事故的防控與處理這個領域之發展的認識,更是有相當大的幫助。
除此之外,本人亦發現,大陸土木工程目前發展相當蓬勃,各項重大工程陸續
的展開,一些較大的城市的地鐵工程亦如火如荼的展開,工程量相當的多,各種新
的工法及技術亦發展得相當好。為了提供工程中之因難問題的解決方法,而在研究
上,亦有很大的進展,包括設計的觀念、方法,分析的工具等,皆有長足的進步,
完全不遜於台灣。因此我們應更加鼓勵國內的研究人員,以精進研究的成果,並可
提升國內工程的的設計與施工水準及品質。
三、考察參觀活動(無是項活動者略)
四、建議
五、攜回資料名稱及內容
2011 兩岸地工技術/岩土工程交流研討會論文集,可提供作為日後研究及教學參
考資料。
六、其他
財團法人地工技術研究發展基金會
發文字號:地 1000126008 號 發文日期:2011 年 1 月 26 日百鈎、章煜、亦郎先生大鑒:
海峽兩岸地工技術/岩土工程交流研討會始自 1992 年北京,已歷台北
(1993) 、 西 安 (1994) 、 上 海 (2002) 、 台 北 (2004) 、 天 津 (2007) 、 台 中
(2009)等七次。各次研討會交流成果豐碩,深獲各界一致好評。為延續
交流成果,今年將再舉辦廣州(2011)研討會,由中國建築業協會深基礎
施工分會與地工技術研究發展基金會共同主辦,時間為 5 月 12-14 日假
廣州大廈舉辦,希望兩岸地工同道踴躍利用這次機會,拓展視野及商機。
感謝您長期對地工技術基金會之支持與愛護,並於百忙中投稿參加 2011
海峽兩岸交流研討會。
台端所投論文已由學術委員會審查通過,特以此函通知您,論文正式
接受並將刊登於論文集(如您的論文有審查意見者,請能於 3 月 2 日(星期三)前
完成修改並回覆)。
審查意見:
1.國立臺灣科技大學請改為臺灣科技大學。
2.表 2 之 t/m
3改為 KN/m
3。
3.請提供本篇 WORD 檔,以利編排作業。
4.本次論文集採黑白印刷,請檢核黑白印刷後圖表之清晰度。
本次研討會以一位註冊者發表一篇論文為原則,台端若有多篇論文
發表者,煩請安排各篇之註冊作者及發表作者後通知學術委員會。
論文題目:3-2 開挖幾何條件對地中壁抑制連續壁位移之影響
作 者:謝百鈎、歐章煜、林亦郎
註冊作者:
發表作者:
本次會議第二號通告及報名表等相關資訊將於 2 月 15 日前以電子郵件
方式寄給您參考進行報名作業,再次謝謝您的參與及協助!
2011 海峽兩岸地工技術/岩土工程交流研討會
學術委員會 主任委員 林宏達 敬上
國科會補助計畫衍生研發成果推廣資料表
日期:2011/08/18國科會補助計畫
計畫名稱: 完整的不排水軟粘土模式發展及應用 計畫主持人: 謝百 計畫編號: 99-2221-E-146-005- 學門領域: 大地工程無研發成果推廣資料
99 年度專題研究計畫研究成果彙整表
計畫主持人:謝百 計畫編號: 99-2221-E-146-005-計畫名稱:完整的不排水軟粘土模式發展及應用 量化 成果項目 實際已達成 數(被接受 或已發表) 預期總達成 數(含實際已 達成數) 本計畫實 際貢獻百 分比 單位 備註(質 化 說 明 : 如 數 個 計 畫 共 同 成 果、成 果 列 為 該 期 刊 之 封 面 故 事 ...等) 期刊論文 0 0 100% 研究報告/技術報告 1 1 100% 研討會論文 0 0 100% 篇 論文著作 專書 0 0 100% 申請中件數 0 0 100% 專利 已獲得件數 0 0 100% 件 件數 0 0 100% 件 技術移轉 權利金 0 0 100% 千元 碩士生 2 2 100% 博士生 0 0 100% 博士後研究員 0 0 100% 國內 參與計畫人力 (本國籍) 專任助理 0 0 100% 人次期刊論文 2 2 75%
Hsieh,
P.G.(corresponding author), and Ou,
C.Y., 2011.
Analysis of
Nonlinear Stress and Strain in Clay Under the Undrained Condition. Journal of Me-chanics, 27(2), 201-213. Hsieh,
P.G.(corresponding author), and Ou,
C.Y., 2012.
Analysis of Deep Excavations in Clay under the Undrained Condition with Small Strain Characteristics,’ tentatively scheduled to appear in Vol. 35 of the Journal of the Chinese Institute of Engineers. 研究報告/技術報告 0 0 100% 研討會論文 0 0 100% 篇 論文著作 專書 0 0 100% 章/本 申請中件數 0 0 100% 專利 已獲得件數 0 0 100% 件 件數 0 0 100% 件 技術移轉 權利金 0 0 100% 千元 碩士生 0 0 100% 博士生 0 0 100% 博士後研究員 0 0 100% 國外 參與計畫人力 (外國籍) 專任助理 0 0 100% 人次
其他成果