國 立 交 通 大 學
物理研究所
碩 士 論 文
以吸收光譜研究八面體結構中
過渡金屬價態與自旋態
Spin configurations and valence state study of
transition metal ions in octahedral environment by
X-ray absorption spectroscopy
研 究 生 : 溫智匡
指導教授 : 林俊源 教授
i
Spin configurations and valence state study of transition metal ions in
octahedral environment by X-ray absorption spectroscopy
student : Chih-Kuang Wen Advisor : Dr. Jiunn-Yuan Lin
Institute of physics
National Chiao Tung University
Abstract
In this thesis, X-ray absorption near edge spectroscopy (XANES) was
employed to study the valence and spin degree of freedom of transition metal
ions in materials.
For the case of Ni(NO
3)
2, the Ni L-edge spectrum indicates divalence
nickel in Ni(NO
3)
2compounds. Combined with the theoretical calculations, we
confirm that the divalent nickel exhibits the high spin state (S=1) in Ni(NO
3)
2. In
the study, NiO (Ni
2+, S=1) was used as the standard sample. The spectrum
shape differences between NiO and Ni(NO
3)
2come from the different local
environments.
ii
L
2,3-edge and temperature dependent Co L
2,3-edge XANES spectra in
PrSrCoMnO
6double perovskites. Our spectra show the Co
3+/Mn
4+ionic state in
PrSrCoMnO
6. With the help of theoretical calculations, we found that the crystal
field in CoO
6octahedral is close to the HS-LS transition boundary. The crystal
structure in PrSrCoMnO
6was solved at T=300 K and T=12 K, respectively.
PrSrCoMnO
6shows an unusual lattice change at low temperatures. The lattice
volume and the average Mn-O bond length decrease, but the average Co-O bond
length increases at low temperatures. We also find there is a close relationship
between CoO
6local environment and Co L-edge spectra line shape. The
temperature dependent Co L-edge XAS spectra of PrSrCoMnO
6obviously
demonstrate the spin state variation with T, which can be described as the
combination of a LS ground state and the triply degenerate HS first excited
states.
iii
Acknoledgement
首先,在此非常感謝我的父母從小給了我一個良好的教育環境,讓我可
以無後顧之憂的完成碩士學歷,並且在我挫折的時候給予我鼓勵,成為我
如此強而有力的後盾,爸媽我愛你們!
非常感謝我的指導教授 林俊源老師,在兩年的碩士班期間給予我許許
多多的建議、要求和鼓勵,也給予了我相當紮實的科學訓練。老師總會要
求我們把所有事情做得更好再更好,以及嚴格的檢視自己,並且訓練了我
們清晰的表達技巧,智匡相信這些訓練對我們來說都是終身受用的!
在此特別感謝國家同步輻射研究中心 陳錦明老師、胡志偉老師、林宏
基老師以及李大哥、孟傑學長…等等專業的老師和學長們不厭其煩的教導
和協助,我才有足夠的專業知識來完成本篇碩士論文。也很感謝實驗室的
大家,小 Pa 學長、伯仲學長、CA 哥、小 P、孟恭、科科、翹屁、榜首哥、
沛姍、至中、愷威、汶鑫、昶鴻、吉吉、舜鴻以及几華和包子…等等,這
兩年的研究因為有你們的協助,才使得許多事情得以進行,也因為有你們
大家的陪伴才讓我的碩士生涯過的如此繽紛!
最後,我要感謝我的女友相蓉,非常感謝妳自我報考研究所以來一路的
iv
Table of contents
Abstract………..………..i Acknoledgement (Chinese)……….…iii Table of contents………...………….…iv List of Figures………..………….…….vi List of Tables………..……….……….ix Chapter 1. Introduction………..1 1-1 Motivation………..1 1-1(a) Ni(NO3)2……….………..1 1-1(b) PrSrCoMnO6……….….………..2Chapter 2. Materials Introduction………..………4
2-1(a) Introduction of Ni(NO3)2………..……….……4
2-1(b) Ni(NO3)2 sample preparation……….6
2-2(a) Introduction of PrSrCOMnO6………...……….7
2-2(b) PrSrCOMnO6 sample preparation……….……….…..…..8
Chapter 3. Theory and Experimental Method……….…………...……….9
3-1 Theory introduction………..…….…….9
3-1(a) Crystal Field Splitting………...………….9
3-1(b) Hund’s Rule………..….10
3-1(c) Jahn-Teller distortion (JT) ………....……….10
3-2 Experimental Method………..…….11
3-2-1(a) Principle of XANES………..…….……...…..…….12
3-2-1(b) NSRRC BL.20A H-SGM beamline equipment………14
3-2-1(c) NSRRC BL.17C equipment………..15
3-2-2 X-ray diffraction………..………..……….….15
v
3-2-2(b) XRD experiments………15
3-2-2(c) Rietveld refinement……….16
3-3 Theoretical calculation in XTLS………..………..17
Chapter 4. Results and discussion on Ni(NO3)2………..…….………….19
4-1 Experimental Design………...….19
4-2 Ni L-edge XANES spectra……….…….………….21
4-3 XANES theoretical calculation by XTLS………...……….24
4-4 Conclusions of Ni(NO3)2………..27
Chapter 5. Results and discussion on PrSrCoMnO6……….………28
5-1 Experimental Design………...……….28
5-2 Mn XANES spectra……….……….28
5-3 Co XANES spectra………..….30
5-4 Powder X-ray diffraction……….……….34
5-5 XANES theoretical calculation by XTLS……….…...……….42
Chapter 6. Conclusions and future works……….…………...…….50
vi
List of Figures
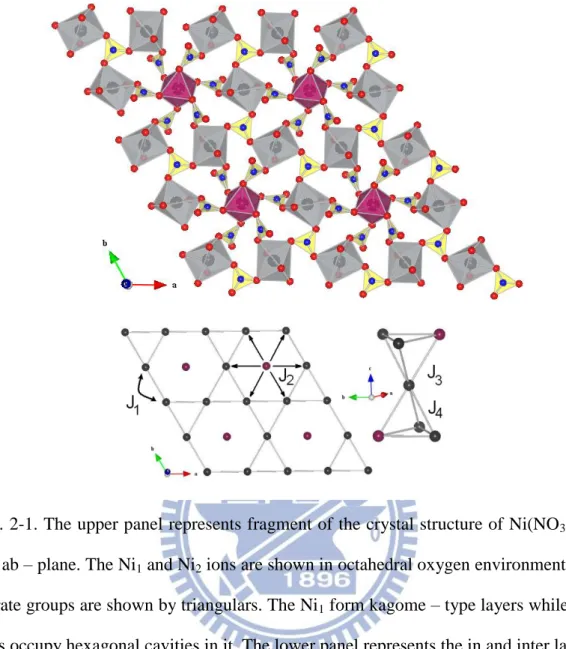
Fig. 2-1. The upper panel represents fragment of the crystal structure of Ni(NO3)2 in the ab – plane. The Ni1 and Ni2 ions are shown in octahedral oxygen environment, the nitrate groups are shown by triangulars. The Ni1 form kagome – type layers while Ni2 ions occupy hexagonal cavities in it. The lower panel represents the in and inter layers exchange
interactions……….……….…….5
Fig. 2-2 Magnetic susceptibility measurement of Ni(NO3)2………...……….5
Fig. 2-3 Specific heat measurement of Ni(NO3)2………...………..6
Fig. 2-4 Magnetization measurement of Ni(NO3)2 At 2 K under magnetic field……….6
Fig. 2-5 Double perovskite structure of LaCaMnCoO6………...…….7
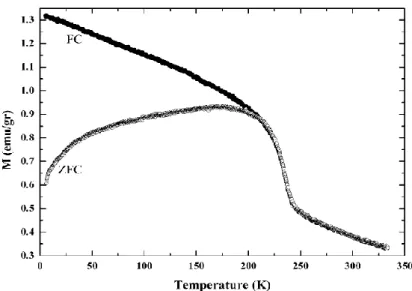
Fig. 2-6 Temperature dependence of mass magnetization of LaSrMnCoO6 measured under a magnetic field of 10 kOe in ZFC and FC conditions………8
Fig. 2-7 Temperature dependence of inverse magnetic molar susceptibility of LaSrMnCoO6 measured under a magnetic field of 10 kOe. The line through the high temperature data points represent a fit to the Curie–Weiss law……….…8
Fig. 3-1 Crystal Field Splitting in octahedral symmetry………..……….9
Fig. 3-2 Jahn-Teller distortion……….……….11
Fig. 3-3 XANES of Mn K-edge……….………12
Fig. 3-4 Photoabsorption of an x-ray into a core level followed by photoelectron emission, filling of the core hole by an electron in another level, accompanied by fluorescence photon……….………..….13
Fig. 3-5 NSRRC BL.20A H-SGM beamline equipment……….…….14
Fig. 3-6 NSRRC BL.17C equipment………...….15
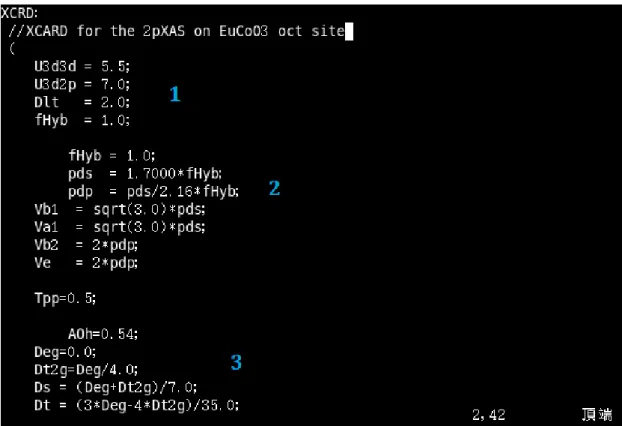
Fig. 3-7 Input file of XTLS software. ..……….…….…..17
vii
Fig. 3-9 Detailed information of each states given by XTLS………..…………..18
Fig. 4-1 Crystal structure of NiO and Ni(NO3)2. ………...20
Fig. 4-2 High spin and low spin in Ni2+ (3d8) case. ……….………...21
Fig. 4-3 Nickel L2,3 edge XAS data in TEY. ……….………...22
Fig. 4-4 Ni 2p XAS spectra from J.-S. Kang et al. ………...…….………..23
Fig. 4-5 Ni2+ XAS simulation from J.-S. Kang et al. (2007)………...….……...23
Fig. 4-6 Ni2+ HS-LS mixed XAS spectra………....………24
Fig. 4-7 Nickel L2,3 edge XAS data with ligand field model calculations……….…….26
Fig. 4-8 Nickel L2,3 edge XAS data with free ion model calculations..……….…….26
Fig. 4-9. Magnetization measurement of Ni(NO3)2 At 2 K under magnetic field………27
Fig. 5-1 Mn L-edge XAS data in TEY mode………..29
Fig. 5-2 Mn K-edge XAS data in transimission mode……….………29
Fig. 5-3 Co K-edge XAS spectra in transmission mode..……….30
Fig. 5-4 Co L-edge XAS data……….………..………32
Fig. 5-5 Co L-edge XAS spectra from reference……….………32
Fig. 5-6 Co L-edge XAS spectra from reference……….………32
Fig. 5-5 Temperature dependent Co L-edge XAS spactra on PrSrCoMnO6 sample………….33
Fig.5-9 X-ray diffraction data of powder PrSrCoMnO6 sample………..….36
Fig.5-9 (a,b,c,d) Details of X-ray diffraction data and simulations on PrSrCoMnO6...36
Fig.5-10 Fig.5-10 Solved crystal structure of PrSrCoMnO6 at T=300 K………….…..…….37
Fig. 5-8. High spin and low spin in Ni2+ (3d8) case……….39
Fig.5-12 X-ray diffraction data of powder PrSrCoMnO6 sample at T=12K………....40
Fig.5-13 (a,b,c,d) Details of X-ray diffraction data and simulations on PrSrCoMnO6……….40
Fig.5-14 Solved crystal structure of PrSrCoMnO6 at T=12 K……….41
Fig. 5-15 Co L-edge XAS spectra with Co2+ impurities………..….43
viii
Fig. 5-17 The ground state of simulations in different 10Dq………..….44 Fig. 5-18 Co L-edge XAS in LaCoO3 from M.W.Haverkort et al………...45 Fig 5-19 Temperature dependent Co3+ L-edge XAS spectra. ………..47 Fig 5-20 Co L-edge XAS experiment data with theoretical calculation (setting the temperature parameter equals to real experiment conditoin)………...……….…47 Fig. 5-21 Co L-edge XAS spectra with theoretical calculation………48 Fig. 5-22 The relationship between the fitting parameter 10Dq with the average Co-O bond
ix
List of Tables
Table 5-1. TM-O bond length of two TM sites……….…………..…….…37
Table 5-2. Mn-O bond lengh in MnO6 coordination……….…38
Table 5-3. Mn-O bond lengh in double perovskite samples……….…38
Table 5-4. Co-O bond lengh in CoO6 coordination………..……….…..38
Table.5-5 Lattice parameters of PrSrCoMnO6 in T=300 K and T=12 K………41
Table 5-6 Energy and total spin S(S+1) for each state in 10Dq=0.495 eV by XTLS………..44
1
Chapter 1. Introduction
The 3d transition metal (TM) exhibit varied degree of freedom in TM oxides, such as valence states and spin states. The class of TM compounds shows an enormous richness of physical properties, such as metal-insulator (MI) transitions, super-conductivity, colossal magneto-resistance (CMR), and the ordering of spin, charge, and orbitals. Many properties come from the different electronic occupation in TM 3d orbitals, e.g. different valence states coexist in the material may changes the electronic properties[Alexander N. VASILIEV], and the spin state transition may changes the magnetic properties[M.W. Haverkort]. Knowing the occupation of TM 3d orbitals would help to interpret the origin of physical properties. To study the electronic occupation of TM ions in material, we did experiments by using X-ray absorption spectroscopy. XAS is a powerful tool to study the electronic states of outer electrons, especially the TM L2,3-edge XAS (2p→3d transition), which probe directly the valence electrons.
1-1 Motivation 1-1(a) Ni(NO3)2
Many structure-related chemistry properties in anhydrous nitrates of divalent cations (Ba, Sr and Pb) are well studied in 1980s, which are not hygroscopic. The anhydrous nitrates of divalent elements with smaller ionic radii are very hygroscopic and are more difficult to investigate, such as Mn, Co and Ni. The crystal structure of nickel (II) nitrate, Ni(NO3)2 was recently defined by G. Giester (2008) to have a rhombohedral R 3 space group (a = 10.3569(1) Å , c = 12.6761(1) Å , Z = 12),which shows two different sites for Ni2+ ions with the ratio Ni-1 : Ni-2 = 3 : 1 [1,2]. Two nickel sites have different distorted NiO6 octahedral local environments. In a distorted
2
NiO6 octahedral environment, Ni2+ ions (3d8) may exhibit either low-spin (LS,S=0) or high-spin (HS,S=1) states depending on the ratio between Hund’s coupling JH and ∆eg splitting. HS state would be ground state in a small distorted case.
O. Volkova et al. measured the magnetization and specific heat on Ni(NO3)2 and indicate that Ni(NO3)2 orders ferromagnetically at TC = 5.5 K 0.25 K, but the magnetic entropy released below TC amounts approximately half of the expected value Rln3 for Ni2+ spin S = 1. At 2 K under magnetic field the magnetization curve of Ni(NO3)2 demonstrates the saturation magnetization about 1.5 B/f.u. The obtained value of saturation moment amounts quite accurate 3/4 from the theoretical one MS = ngSB = 2.15 B/f.u. for Ni2+, S=1. [2] To confirm the spin state of nickel ions and whether a quarter of nickel ions show low spin state(LS, S=0) at the Ni-2 site, we measured the X-ray absorption near edge structure (XANES) on nickel L2,3 edge in powder Ni(NO3)2 sample and NiO single crystal as a reference.
1-1(b) PrSrCoMnO
6The class of cobalt-oxide based materials has attracted considerable interest in the last two decades because of expectations that spectacular properties may be found similar to those in the manganites and cuprates. e.g. Giant magnetoresistance effects have been observed in the La1-xAxCoO3 (A=Ca, Sr, Ba) perovskites. A key point of cobalt oxides is that the Co3+/III ion has high degree of freedom in spin state then manganese and copper. In perovskite structure (CoO6 octahedral coordination), depending on the ratio of the Hund’s coupling and the crystal field between t2g and eg state, Co3+ ions may stay in the low-spin state(3d6, S=0), intermediate-spin state(3d6,
S=1) or high-spin state (3d6, S=2). Co3+ is generally assumed to represent LS state in
ReCoO3 perovskite (Re=Eu, Sm).
3
which has the general formula of A’ A”B’B”O6, where A’ and A” sites are occupied by the rare earth element or Alkaline earth metal, B’ and B” sites by transition metal ions. J. Androulakis [3] studied LaSrCoMnO6 sample by using XRD, magnetism and transport measurement. They assume that LaSrCoMnO6 is cubic double perovskite structure, and valence of Mn ion shows 4+, while the cobalt ion shows Co3+.
We are interested in the valence and spin state of transition metal ions in different compound of double perovskites PrSrCoMnO6. In our previous work, the Co
K-edge XANES spectrum presents the trivalence cobalt in PrSrCoMnO6, but the
L-edge XANES spectrum shows a very different look with those ReCoO3 perovskite (Re=Eu, Sm) Co3+ LS spectra, contrarily, it’s slightly similar to the spectrum of layered Sr2CoO3Cl compound studied by Z. Hu et al.(2004)[4]. Z. Hu et al. demonstrate that the Co3+ ions with the CoO5 pyramidal coordination in the layered Sr2CoO3Cl compound shows an unambiguously high spin state (HS, 3d6, S=2). In our study, we particularly reexamine the spin state of cobalt ions in PrSrCoMnO6 and expect to see Co3+ high spin state in perovskite structure.
4
Chapter 2.
Materials Introduction
2-1(a) Introduction of Ni(NO
3)
2The crystal structure of nickel (II) nitrate, Ni(NO3)2 was recently solved to have a rhombohedral R 3 space group (a = 10.3569(1) Å , c = 12.6761(1) Å , Z = 12), which shows two different sites for Ni2+ ions with the ratio Ni-1 : Ni-2 = 3 : 1 [1,2]. Both
nickel sites possess octahedral oxygen environment. Every NiO6 octahedron is connected via six nitrate groups with twelve neighbouring octahedra. As shown in Fig.2-1, the Ni ions form two-dimensional Kagome lattice in the ab-plane, and Ni-2 ions occupy the hexagonal cavities. In both Ni-1 and Ni-2 positions the apical oxygen anions are shifted aside from the symmetric vertical location to 11o and 12o, respectively. In the NiO6 octahedral environment, the Ni 3d degenerate state was separated into eg and t2g state with 10Dq difference by the crystal field, and the eg state was separated into x2-y2 and 3z2-r2 with ∆eg difference by the distortion. Depending on the ratio between Hund’s coupling JH and ∆eg splitting, Ni2+ ions (3d8) may exhibit either low-spin (LS,S=0) or high-spin (HS,S=1) states. HS state would be ground state in a small distorted case.
O. Volkova et al. measured the magnetization and specific heat on Ni(NO3)2 and indicate that Ni(NO3)2 orders ferromagnetically at TC = 5.5 K 0.25 K (Fig.2-2,2-3), but the magnetic entropy released below TC amounts approximately half of the expected value Rln3 for Ni2+ spin S=1. At 2 K under magnetic field the magnetization curve of Ni(NO3)2 demonstrates the saturation magnetization about 1.5 B/f.u. The obtained value of saturation moment amounts quite accurate 3/4 from the theoretical one MS = ngSB = 2.15 B/f.u. for Ni2+, S=1 (see Fig.2-4) [2]. To confirm the spin state of nickel ions, we measured the X-ray absorption near edge structure (XANES) on nickel L2,3 edge in powder Ni(NO3)2 sample and NiO single crystal as a reference.
5
Fig. 2-1. The upper panel represents fragment of the crystal structure of Ni(NO3)2 in the ab – plane. The Ni1 and Ni2 ions are shown in octahedral oxygen environment, the nitrate groups are shown by triangulars. The Ni1 form kagome – type layers while Ni2 ions occupy hexagonal cavities in it. The lower panel represents the in and inter layers exchange interactions. [2] 0 50 100 150 200 250 300
0
2
4
6
T (K)
(em
u/mol)
Magnetic susceptibility
of Ni(NO
3)
26
0
5
10
15
20
25
0
2
4
6
8
10
Ni(NO
3)
2C
p(J/m
olK)
T (K)
T
C= 5.5 K
Fig. 2-3. Specific heat measurement of Ni(NO3)2. [2]
0
2
4
6
8
0.0 0.2 0.4 0.6 0.8 1.0 1.2 1.4M
s~1.5
B/f.u
M
(
B/f
.u
.)
B (Tesla)Ni(NO
3)
2measured at T = 2 K
Fig. 2-4. Magnetization measurement of Ni(NO3)2 At 2 K under magnetic field. [2]
2-1(b) Ni(NO
3)
2sample preparation
For preparation of powder sample Ni(NO3)2, the glass with mixture of Ni(NO3)2*6H2O and anhidrous HNO3 were placed in a desiccator containing phosphorus pentoxide. After three weeks Ni(NO3)2 formed as light green polycrystalline solid. [5]
7
2-2(a) Introduction of PrSrCOMnO
6Double perovskites of the general formula A’A”B’B”O6, the crystal structure as shown in Fig.2-5, A’ and A” sites are occupied by the rare earth element or Alkaline earth metal, B’ and B” sites by transition metal ions. J. Androulakis [3] studied LaSrCoMnO6 sample by using XRD, magnetism and transport measurement. They assume that LaSrCoMnO6 is cubic double perovskite structur, and valence of Mn ion shows Mn4+, and the cobalt ion shows Co3+, which may stay in the intermediate-spin state(3d6, S=1) or high-spin state (3d6, S=2). Magnetization measurement shows a phase transition at Tc~225 K, and the samples exhibit ferromagnetic behavior with a
spin-glass-like character below Tc (see Fig.2-6). The shape of the χ-1(T) curve is
characteristic of ferrimagnetic behavior. For T > 250K the χ-1(T) data are fitted well to the Curie–Weiss law as shown in Fig.2-7. Since PrSrCoMnO6 has a similar structure with LaSrCoMnO6, we are interested in the valence and spin state of TM ions in different rare earth element compound.
8
Fig. 2-6 Temperature dependence of mass magnetization of LaSrMnCoO6 measured under a magnetic field of 10 kOe in ZFC and FC conditions. [3]
Fig. 2-7 Temperature dependence of inverse magnetic molar susceptibility of LaSrMnCoO6 measured under a magnetic field of 10 kOe. The line through the high temperature data points represents a fit to the Curie–Weiss law. [3]
2-2(b) PrSrCOMnO
6sample preparation
The mass of powder Pr2O3, Sr(NO3)2, Co3O4 and Mn2O3 are appropriately distributed by their molecular weight and the chemical formula of PrSrCOMnO6. The starting mixture are baked at T=1000°C and sintering at 1250–1420 °C, with subsequent cooling to room temperature at the rate of 100 °C/h.[7]
9
Chapter 3. Theory and Experimental Method
3-1 Theory introduction
3-1(a) Crystal Field Splitting
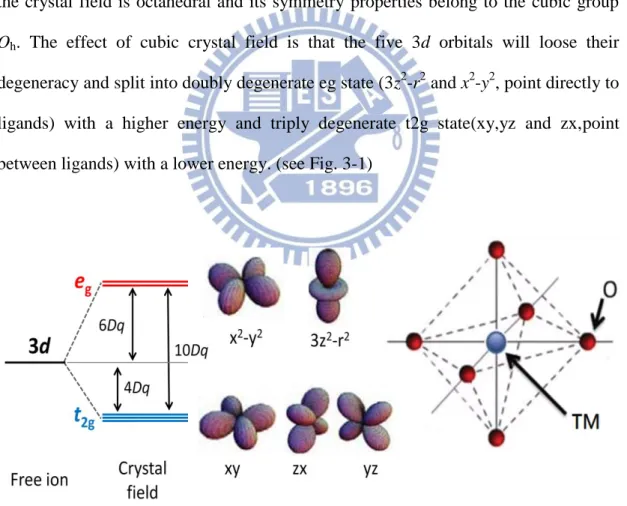
Crystal field splitting (also called as ligand field multiplet-LFM) model is to approximate the transition metal(TM) as an isolated atom surrounded by a distribution of charges, which mimic the system, molecule, or solid, around the TM. This seems to be a very simplistic model but it was successful in explaining a large range of experiments. A TM ion in the gas phase has five degenerate 3d orbitals. When the metal ion is placed in a crystal with six neighboring ions equidistant on the three axes, the crystal field is octahedral and its symmetry properties belong to the cubic group
Oh. The effect of cubic crystal field is that the five 3d orbitals will loose their degeneracy and split into doubly degenerate eg state (3z2-r2 and x2-y2, point directly to ligands) with a higher energy and triply degenerate t2g state(xy,yz and zx,point between ligands) with a lower energy. (see Fig. 3-1)
10
3-1(b) Hund’s Rule
Hund's rules was refered to a set of rules formulated by German physicist Friedrich Hund around 1927, which can be used to discuss the ground state symmetries of partly-filled 3d band in TM compounds. The three rules are :
1. For a given electron configuration, the term with the maximum value of the total spin angular momentum S has the lowest energy.
2. For a given total spin angular momentum S, the term with the largest value of the total orbital angular momentum L has the lowest energy.
3. For a given term, in an atom with outermost subshell half-filled or less, the level with the lowest value of the total angular momentum J lies lowest in energy. If the outermost shell is more than half-filled, the level with the highest value of J is lowest in energy.
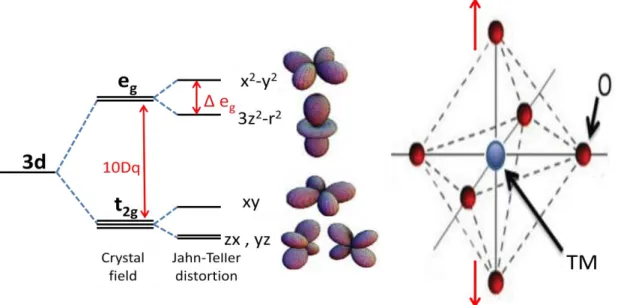
3-1(c) Jahn-Teller distortion (JT)
The Jahn–Teller distortion is named after Hermann Arthur Jahn and Edward Teller, who proved that orbital nonlinear spatially degenerate molecules cannot be stable, and will undergo a geometrical distortion that removes that degeneracy to lowers the overall energy. The JT effect is most often encountered in octahedral complexes of the TM. For example, in the d9 electronic configuration gives three electrons in the two degenerate eg orbitals, leading to a doubly degenerate electronic
ground state. Such complexes will distort along one axes (set as z axis), and breaks the degeneracy to lower the overall energy. When such an elongation occurs, the 3z2-r2 orbital will lower its energy level from the electrostatic repulsion, and cause a energy difference ∆eg between x2-y2 orbital, see Fig. 3-2. The JT effect was arisen in such configurations, d9, low-spin d7 and high-spin d4 complexes, which all have doubly degenerate ground states.
11
Fig. 3-2
Jahn-Teller distortion
3-2 Experimental Method
In the X-ray energy region, the mass photoabsorption coefficient generally decreases as the photon energy increase, but there still exist some particular raising range when the incident photon energy fortuitously satisfy the excitation and excites the core electron to outer empty shell. Depending on the energy range, X-ray is roughly separate into two parts, soft X-ray (hv<2000 eV, weak penetration, the experiment must be down in ultra high vacuum) and hard X-ray (hv>2000 eV, high penetration, the experiment can be down in the air.)
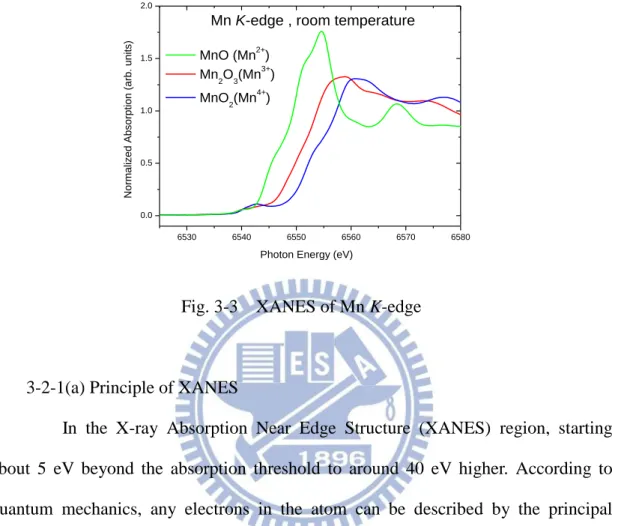
X-ray absorption spectroscopy (XAS) is a powerful tool to study the electronic states of outer electrons, the valence electron states in material. XAS can roughly separate into two regions, XANES and EXAFS. In XANES(X-ray absorption near edge structure), the edge energy increase with the increasing of elements valence in material, which come from the interaction between nucleus and outer shell electrons. This phenomenon is quite obvious in K-edge(see Fig.3-3.). In EXAFS(Extended X-ray Absorption Fine Structure ), we can get some information about the number of
12
atoms around and the distance between each surrounding atoms. In our studies, we focus on the XANES experiment to investigate the valence and spin state of transition metal ions in material.
6530 6540 6550 6560 6570 6580 0.0 0.5 1.0 1.5 2.0 MnO (Mn2+) Mn2O3(Mn3+) MnO 2(Mn 4+ )
Mn K-edge , room temperature
Photon Energy (eV)
N o rma lize d Abso rp ti o n (a rb . u n it s)
Fig. 3-3 XANES of Mn K-edge
3-2-1(a) Principle of XANES
In the X-ray Absorption Near Edge Structure (XANES) region, starting about 5 eV beyond the absorption threshold to around 40 eV higher. According to quantum mechanics, any electrons in the atom can be described by the principal quantum number n, orbital angular momentum l, and magnetic quantum number ml.
The electric transition obeys the dipole selection rule △l=+1,-1, and △ml=+1,-1,0. In
K-edge, the core electron is excited from 1s shell to np orbital. For the L1, L2 and L3 absorption edge, core electrons were excited from the 2s, 2p1/2 and 2p3/2 orbital. The TM L2,3-edge spectra can be describe as the transition from 2p63dn initial state to
2p53dn+1 final state, which is extremely sensitive to the symmetry of the initial state. There are two kind of signals in XANES, total electron yield (TEY) and X-ray fluorescence yield (FY). TEY is used to study the surface state of material. As the material absorbed the X-ray photon, the core level electron was consequently emitted
13
as a photoelectron. During the Coulomb interaction between the photoelectron and other electrons in the material, the photoelectron from inner material is undetectable. On the other hand, fluorescence yield is used to study the bulk state. As the absorption occurred, a core hole was created. The resulting core hole is filled by capture of an electron from another shell by emission of a fluorescent photon. Since the fluorescent photon has no Coulomb interactions with other electrons, inner material signals were obtained.
Fig. 3-4 Photoabsorption of an x-ray into a core level followed by photoelectron emission, filling of the core hole by an electron in another level, accompanied by fluorescence photon.
The XAS experiments were performed at the BL.20A H-SGM beamline, BL.11A Dragon beamline, and BL. 17C at the National Synchrotron Radiation Research Center (NSRRC) in Taiwan.
14
3-2-1(b) NSRRC BL.20A H-SGM beamline equipment
15
3-2-1(c) NSRRC BL.17C equipment
Fig. 3-6 NSRRC BL.17C equipment
3-2-2 X-ray diffraction
3-2-2(a) Bragg diffraction
To study the crystal structure, we did experiments by using X-ray diffraction (XRD). Diffraction occurs as the incidence of X-ray to the material, according to the Bragg's law, Where d is the spacing between the planes in the atomic lattice, θ is the
angle between the incident ray and the scattering planes, n is an integer and λ is the wavelength of incident wave. e.g. λ(Kα1)= 1.5406 Å for copper target.
2d sinθ=nλ
3-2-2(b) XRD experiments
The θ-2θ scans, also called normal scans, are always satisfy the Bragg’s law, which the angle from incident beam to sample surface (θ) always keep half the angle from incident beam to detector (2θ).
16
3-2-2(c) Rietveld refinement
Rietveld refinement is a technique for characterizing the crystalline materials. The x-ray diffraction of powder samples results in a pattern characterised by reflections (peaks in intensity) at certain positions. The height, width and position of these reflections can be used to determine many aspects of the materials structure.
The Rietveld method, which was able to deal reliably with strongly overlapping reflections, uses a least squares approach to refine a theoretical line profile until it matches the measured profile, and Rietveld method.
Where Wi is the weight, Wi=1/Yi(obs), Yi(obs) is the real peak intensity (counts) from
experiment and Yi(cal) is the theory calculated peak intensity.
2
( )
Y
i cal
A
pm LP
hkl Fhlk
p(2
i
2
hkl)
P
hkl
Y
ib P is Phase Number, A is Scale Factor, Mhkl is the multiplicity of hkl surface, LP is Lorentz-polarization dactor, Fhkl is the Structire Factor of hkl surface, is wavefunction, Phkl is the prefer orientation function and Yib is the background signal.
In the Rietveld method, three factors can be used to determine the accuracy:
The Weighted Profile R-factor
2 2 ( ) ( ) ( )
[
] /
w p i i o b s i c a l i i o b s iR
W Y
Y
W Y
The Profile R-factor p (i o b s) ( i
/
c a l) ( i)o b s iR
Y
Y
Y
The Bragg R-factor
2
( ) ( )
/
( )B I h k l o b s h k l c a l h k l o b s
17
3-3 Theoretical calculation in XTLS
The theoretical calculations of transition metal L2,3 XAS line shape is calculated by the XTLS software compiled by Dr. A. Tanaka[8], and the input file parameters were provided by Dr. Z. Hu.
In XTLS calculations, full atomic mutiplet effect and ligand field mutiplet effect are considered. The full atomic mutiplet effect includes the 3d-3d and 2p-3d Coulomb and exchange interactions inside transition metal ions, while the ligand field mutiplet effect includes the hybridization of transition metal 3d orbital with the O 2p ligands, and the local crystal field. Fig. 3-7 shows the changeable parameters in XTLS.
Fig. 3-7 Input file of XTLS software.
In the first part, parameter U3d3d and U3d2p represent the Coulomb and exchange interactions between 3d-3d and 2p-3d electrons inside transition metal ions. Parameter Dlt represents the charge transfer energy, in transition metal L2,3-edge XAS spectra (2p→3d), the transition can be describe as α|2p63dn> + β|2p63dn+1L>→α’
18
|2p53dn+1> +β’ |2p53dn+2L>, where L denotes a charge transfer from ligand and create
a ligand hole, and Dlt is the energy difference between |2p63dn> and |2p63dn+1L> state.
In the second part, parameter pds is the hybridization coefficient between TM 3d and ligand 2p orbitals. In the third part, parameter AOh is the local crystal field on TMO6 coordination with an octahedral symmetry, and parameter Deg is the energy splitting
∆eg from the distorted TMO6 octahedral. Fig. 3-8 shows setting of the initial and final electronic states, which depend on the transition metal ions. Other parameters are mentioned in M. W. Haverkort [9]. In the calculation result, XTLS gives first 16 states spectra, including the energy and angular momentum information of each state.(see Fig. 3-9)
Fig. 3-8 Initial and final electronic states setting in XTLS.
19
Chapter 4. Results and discussion on Ni(NO
3)
2To study the valence and spin state of nickel ions, we measured the X-ray absorption near edge spectroscopy (XANES) at nickel L2,3 edge in powder Ni(NO3)2 sample and NiO single crystal as a reference.
4-1 Experimental Design
The XAS experiments were performed at the H-SGM beamline at the National Synchrotron Radiation Research Center (NSRRC) in Taiwan. Clean sample surface were obtained by cleaving samples in chamber with pressure lower than 10-7 mbar. Room temperature Ni L-edge XAS was recorded in total electron yield (TEY) in ultra high vacuum (~10-10 mbar) chamber.
The crystal structure of nickel (II) nitrate, Ni(NO3)2 was solved to have a rhombohedral R
3
space group (a = 1.03569(1) nm, c = 1.26761(1) nm, Z = 12),which shows two different sites for Ni2+ ions with the ratio Ni-1 : Ni-2 = 3 : 1 [1]. Two nickel sites have different distorted NiO6 octahedral local environments as shown in Fig.4-1. In the NiO6 octahedral environment, the Ni 3d degenerate state was separated into eg and t2g state with 10Dq difference by the crystal field, and the eg state was separated into x2-y2 and 3z2-r2 with ∆eg difference by the distortion. Ni2+ ions (3d8) has six electrons in the t2g state and two in the eg state, depending on the ratio between Hund’s coupling JH and ∆eg splitting, it may exhibit either low-spin (LS,S=0) or high-spin (HS,S=1) states as shown in Fig. 4-2. An easy way to calculate the total energy of HS or LS state is to set the t2g energy level to be zero, gain one crystal field energy 10Dq for each electron which stays in eg state, and also consider about the exchange interaction (Hund’s coupling) between the 3d electrons.20 H ex ex F C total J m m n n E E E E ] 2 ) 1 ( 2 ) 1 ( [ .
n is the number of spin up electrons, m is the number of spin down electrons, JH is the Hund’s coupling energy. For Ni2+
, the total energy of HS and LS can be describe as :
J -E -E 12J -10Dq * 2 E e 13J -10Dq * 2 E H LS HS H LS g H HS g e
HS state would be ground state in a small distorted case.
The Ni L2,3 (2p→3d) absorption spectra obeys the dipole selection rule, the transition can be describe as α|2p63dn> + β|2p63dn+1L > →α’ |2p53dn+1> +β’ |2p53dn+2L>, where L denotes a charge transfer from ligand to nickel. The Ni 2p
core-hole spin-orbit coupling splits the spectra into two parts, namely the L3 (hν~853 eV) and L2 (hν~871 eV) white lines regions. The line shape of spectrum depends on the atomic mutiplet effect including Ni 3d-3d and 2p-3d Coulomb and exchange interactions, hybridization of Ni 3d orbital with the O 2p ligands, and the local crystal field.
21
Fig. 4-2. High spin and low spin in Ni2+ (3d8) case.
4-2 Ni L-edge XANES spectra
Fig. 4-3 shows the Ni L2,3 XAS experiment spectra of NiO and Ni(NO3)2 taken at room temperature. NiO is generally accepted to have divalence nickel with a HS(S=1) state as a standard sample. In the Ni L3-edge (2p3/2→3d transition), We found the line shape in of Ni(NO3)2 is far away from the Ni3+ spectrum as shown in Fig. 4-4[10]. Both NiO and Ni(NO3)2 spectra have a mean peak at 853.35 eV in L3-edge, which can be used to determine the valence of nickel ions, means the nickel ions are also divalence in Ni(NO3)2[10,11]. At the second peak of L3-edge, Ni(NO3)2 has a higher
intensity at 855.1 eV and more peak splitting from the mean peak than NiO. We also see a shoulder characteristic at 856.5 eV in NiO but it disappeared in Ni(NO3)2 spectrum. These two differences come from the ligand field multiplet effect, which includes the hybridization with O 2p ligands and the local crystal field from their different NiO6 environments. In the L2-edge (2p1/2→3d), both spectra split into two peaks, Ni(NO3)2 has a slightly lower intensity at 870.7eV but a visible higher intensity
22
at 871.8 eV than NiO. Again, these intensity differences come from the ligand field multiplet effect. The broad peak at 859 eV is the |2p63d9L>→|2p53d10L> transition
from charge transfer effect, while a broad characteristic at 866.7 eV in NiO spectrum is the 2p→4s-like transition called as continue edge jump [9].
850 855 860 865 870 875 0.0 0.2 0.4 0.6 0.8 1.0 1.2
N
o
rm
al
iz
ed
i
n
te
n
si
ty
(
ar
b
.
u
n
it
s)
Ni-L
2Photon Energy (eV)
NiO
Ni(NO
3
)
2XAS spectra (TEY)
Ni-L
3Fig. 4-3. Nickel L2,3 edge XAS data in TEY.
Since two nickel sites in Ni(NO3)2 have different distorted NiO6 octahedral local environment, and the distortion may cause the presence of low spin state, first, we suspect whether all divalence nickel stay in pure low spin state in Ni(NO3)2. The Ni2+ low spin state has six electrons in the t2g state and two electrons stay in one orbital of
eg state, this cause the LS spectrum has only one single peak in both L2,3 edge[11]. Compare with the calculated XAS spectra of Ni2+ LS in Fig.4-5, the line shape and the intensity ratio in L3-edge of Ni(NO3)2 tells that it is not a pure low spin spectra[10,11]. Second, we think about an inhomogeneous mixed spin state in the Ni(NO3)2, which means the higher intensity at 855.1 eV and 871.8 eV may be the
23
contribution from some LS population. Fig. 4-6 shows the Ni2+ HS-LS mixed spectra from Dr. S.M. Peng et al who studied one-dimensional nickel material [12]. The button spectrum shows a Ni2+ 2HS+7LS spectrum, the mean peak in L3-edge come from the LS contributions, the energy position is 1 eV higher than the mean peak of Ni2+ HS spectra (top one) and sits between the mean peak and the second peak of HS spectrum. Comparing with the energy position, we assume the higher intensity at 855.1 eV and 871.8 eV are not the contribution from LS spectra. At the end, we assume all divalence nichels stay in high spin state in Ni(NO3)2, and the spectra shape difference between NiO and Ni(NO3)2 may come from those different local environments, which means an undistorted NiO6 octahedral cluster in NiO and two closely distorted NiO6 octahedral in Ni(NO3)2 ( see Fig. 2-4).
24
Fig. 4-6 Ni2+ HS-LS mixed XAS spectra[12]
4-3 XANES theoretical calculation by XTLS
To confirm the spin state of divalence nickel in Ni(NO3)2, we also discussed the theoretical calculations of L2,3 XAS line shape using the full atomic multiplet theory, together with hybridization of Ni 3d orbital with the O 2p ligands and the point charge crystal field in NiO6 cluster [8].
For NiO case, the NiO6 octahedral is almost undistorted and nickel ion has same distance between all six O neighbors. In our calculations, we use the hybridization coefficient pdσ = -1.29 eV [13], set ∆eg = 0 eV (undistorted octahedral). We focus on the peak splitting and ratio of intensity in both L2 and L3 edge, a shoulder at 856.5 eV and a charge transfer characteristic at 859 eV. Finally we get a best fit to NiO spectra in 10Dq=1.0 eV.
For Ni(NO3)2 case, the crystal structure shows the averagy Ni-O bond length is 2.071Å , this value is very close to the bond length of 2.08(1) Å in NiO [14,15]. Since
25
NiO and Ni(NO3)2 have a closely average Ni-O bond length, their 10Dq should also be closed. We focus on the peak splitting and intensity ratio in both L2 and L3 edge, our calculations shows 10Dq=1.0 eV,∆eg=0.8 eV and 10Dq=0.9 eV,∆eg=0.7 eV can fit the Ni(NO3)2 spectra, and 10Dq=0.9 eV,∆eg=0.7 eV is the best fit to Ni(NO3)2 spectra while the L3 edge looks too broad in ∆eg=0.8 eV calculation. Fig. 4-7 shows the best fitting on Ni(NO3)2, ∆eg=0.7 eV comes from the distorted NiO6 cluster.
The calculation result of 10Dq=0.9 eV, ∆eg=0.7 eV shows triply degenerate ground state with total spin S(S+1)=1.9988(1), and S(S+1)=1.9746 in the first excited state. The energy of first excited state is 0.98 eV higher than the triply degenerate ground state, the energy difference is too high for the thermal excitation at room temperature.
In our calculations we consider the point charge crystal field and hybridization with ligands separately, we called as ligand field model(LFM). Given the fact that various X-ray absorption studies use 10Dq around 1.6~1.8 eV to fit NiO spectra [11,16,17], that’s because the octahedral crystal and ligand field splitting are included
in one single effective parameter 10Dq, we called as a free ion model(FIM) approach. 10Dq is the t2g/eg orbital splitting in octahedral symmetry. We also tried the FIM calculations (pdσ = 0 eV), and shows 10Dq=1.6 eV, ∆eg=0 eV can fit NiO spectra well, while 10Dq=1.5 eV, ∆eg=0.6 eV result can fit Ni(NO3)2 well(see Fig.4-8). The 10Dq=1.5, ∆eg=0.6 eV calculation shows S(S+1)=1.9984(2), also a HS state. Either LFM or FIM calculations represent the nickel ions is divalence and still with a high spin state S=1 in Ni(NO3)2, like those nickel ions in NiO. Compare the FIM and LFM calculations, the LFM can get more splitting and fit beter in L2 edge. The different spectra shape come from their different ligand field multiplet effect, which means an undistorted NiO6 octahedral in NiO and two closely distorted octahedral in Ni(NO3)2.
26 850 855 860 865 870 875 0.0 0.2 0.4 0.6 0.8 1.0 1.2 1.4 1.6
N
o
rm
al
iz
ed
i
n
te
n
si
ty
(
ar
b
.
u
n
it
s)
Ni-L2Ni L-edge XAS data with LFM calculation
Photon Energy (eV)
NiO exp. LF. 10Dq=1.0 eV ,△ eg=0 eV Ni(NO3)2 exp. LF. 10Dq=0.9 eV ,△ eg=0.7 eV Ni-L3
Fig. 4-7. Nickel L2,3 edge XAS data with ligand field model calculations.
850 855 860 865 870 875 0.0 0.2 0.4 0.6 0.8 1.0 1.2 1.4 1.6
N
o
rm
al
iz
ed
i
n
te
n
si
ty
(
ar
b
.
u
n
it
s)
Ni-L 2Photon Energy (eV) NiO exp. FI-theo. 10Dq=1.6 eV ,△ eg=0 eV Ni(NO 3)2 exp. FI-theo. 10Dq=1.5 eV ,△ eg=0.6 eV
Ni L-edge XAS data with FIM calculation
Ni-L 3
27
4-4 Conclusions of Ni(NO
3)
2First, the XAS spectra shows the divalence nickel in Ni(NO3)2 compound. Combine with the theoretical calculation, we assume that the divalence nickel shows a high spin state S=1 in Ni(NO3)2, same as NiO. The spectrum shape differences between NiO and Ni(NO3)2 come from the different local environments.
On the other hand, very recently, O. Volkova et al. [2] measured magnetization measurement under magnetic field as shown in Fig. 4-9, the obtained value of saturation moment amounts about 2.03 B/f.u. which is very close to the theoretical one MS = ngSB = 2.15 B/f.u. for Ni2+, S=1, which is consistent to our simulations.
0 2 4 6 8 0.0 0.5 1.0 1.5 2.0
theoretical : MS = 2.15 B/f.u. for Ni2+, S=1
Ni(NO
3)
2M (
B/f.u
.)
B (Tesla)M
S~ 2.03
Bmeasured at T=2 K
Fig. 4-9. Magnetization measurement of Ni(NO3)2 At 2 K under magnetic field.[2]
28
Chapter 5. Results and discussion on PrSrCoMnO
6To study the valence and spin state of transition metal ions in polycrystal PrSrCoMnO6 sample, and expect to see the existence of Co3+ high spin state in perovskite structure, we measured the X-ray absorption near edge spectroscopy (XANES) on Co K-edge, Co L-edge, Mn K-edge and Mn L-edge in polycrystal PrSrCoMnO6 sample.
5-1 Experimental Design
In one paper studied on LaSrCoMnO6 sample from J. Androulakis[3]. They assume the valence is +4 for manganese ion, and +3 for cobalt ions, and the trivalence cobalt may stay in intermediate-spin state (3d6, S=1) or high-spin state (3d6, S=2). Since PrSrCoMnO6 and LaSrCoMnO6 belong to the same series, we wonder whether the valence and spin state of transition metal changed in different rare earth compound. The Co K-edge and Mn K-edge XAS experiments were performed at the BL.17C at the National Synchrotron Radiation Research Center (NSRRC) in Taiwan. The Co
L-edge and Mn L-edge XAS experiments were performed at both H-SGM beam line
and Dragon beam line in NSRRC Taiwan. We also combine with the X-rat diffraction refinement and theoretical calculations to investigate the relationship between XAS spectra with crystal structure.
5-2 Mn XANES spectra
Room temperature Mn L-edge XAS data was recorded in total electron yield (TEY) mode (see Fig.5-1). In the previous work, which shows the PrSrCoMnO6 sample has a similar spectra shape and energy position with MnO2, we infer that the valence on manganese ion should be Mn4+.
29
Room temperature Mn K-edge XAS was recorded in the transmission mode. The edge position is sensitive to Mn valence in the K-edge spectra, which also represents the Mn4+ in PrSrCoMnO6 sample (see Fig.5-2), same as those Mn4+ in Eu2CoMnO6 and La2CoMnO6 double perovskite[18,19,20].
635 640 645 650 655 660 NCTU 高政男 Thesis (2012) PrSrCoMnO 6 Mn-L3 Mn-L2 Mn-L
2,3XAS spectra at room temperature
T ot al E le ct ro n Y ie ld ( ar b. u ni ts ) MnO(Mn2+) Mn2O3(Mn3+)
photon energy (eV)
MnO2(Mn4+)
Fig. 5-1 Mn L-edge XAS data in TEY mode
6530 6535 6540 6545 6550 6555 6560 6565 6570 6575 0.0 0.2 0.4 0.6 0.8 1.0 1.2 1.4 NCTU 高政男 Thesis (2012) Mn2O3 MnO2 Pr2CoMnO6 Eu2CoMnO6 PrSrCoMnO6
Mn K-edge transmition mode at room temperature
Photon Energy (eV)
Normal iz ed A bs orpti on (arb. un its )
30
5-3 Co XANES spectra
In Co K-edge, room temperature XAS was recorded in the transmission mode from BL.17C in NSRRC Taiwan, as shown in Fig.5-3. The K-edge XAS spectra is very sensitive to the valence of transition metal ions. Compare with other reference spectra, we find the PrSrCoMnO6 spectrum is very similar to EuCoO3, and we infer that the cobalt ions are also trivalence in PrSrCoMnO6 sample.
7700 7710 7720 7730 7740 7750 7760 7770 7780 0.0 0.5 1.0 1.5 NCTU 高政男 Thesis (2012) CoO (Co+2) Co 3O4 (Co +2.67 ) EuCoO3 PrSrCoMnO 6 -300 K N orm aliz ed Abs orpt ion (arb. unit s )
Photon Energy (eV)
Co K-edge XAS , Transmission mode
Fig.5-3. Co K-edge XAS spectra in transmission mode
In Co L-edge, room temperature XAS experiments were performed at the H-SGM beamline in NSRRC. Clean sample surface were obtained by cleaving samples in chamber with pressure lower than 10-7 mbar. XAS data was recorded in total electron yield (TEY) in ultra high vacuum (~10-10 mbar) chamber.
To estimate the valence and spin state of cobalt ions in PrSrCoMnO6 sample, we compare the XAS data with some reference sample in Fig.5-4, such as CoO(Co2+), EuCoO3(Co3+-LS) and Sr2CoO3Cl2. If we compare with the divalence cobalt standard sample CoO, we find that the spectrum shape of PrSrCoMnO6 is far away from CoO,
31
and PrSrCoMnO6 sits in a higher energy position, means the cobalt ions are not pure divalence. To think about the Co2+-Co3+ mixed valence state, C. F. Chang[21] mentioned about the spectra shape of Co2+-Co3+ mixed valence state looks like Co3+ high spin state (see Fig. 5-5), but we still can distinguish them from the L3-edge mean peak energy position and a Co2+ characteristic at 777.7eV. Fig. 5-6 shows the Co3+-Co4+ mixed valence state studied by H.-J. Lin [22] . In Co4+ XAS spectra, the mean peak in L3-edge is 1.5 eV higher than the mean peak of Co3+ spectra, and Co4+ spectra also present an obvious peak at 779.4 eV. Both the characteristics of Co4+ spectra were not displayed in PrSrCoMnO6 spectrum. So far, we assume the cobalt ions are trivalence in PrSrCoMnO6 sample, consistent with the Co K-edge.
In the Co L-edge XANES spectra, PrSrCoMnO6 shows a very different look with those ReCoO3 perovskite (Re=Eu, Sm). According to Z. Hu et al.(2004)[4], they mentioned about the cobalt ions shows trivalence in EuCoO3 single crystal sample. The Co3+ ions formed an octahedral coordination with the six oxygen neighbours and Co3+ stays in the low spin state (LS, 3d6, S=0). In the Co3+ LS XAS spectrum, there shows a mean peak and a shoulder characteristic at higher energy range in both L2 and
L3-edge. Contrarily, Co L-edge XANES spectrum of PrSrCoMnO6 is slightly similar to the spectrum of layered Sr2CoO3Cl compound, which was studied by Z. Hu et al.(2004)[4]. Z. Hu et al. demonstrate that the Co3+ ions with the CoO5 pyramidal coordination in the layered Sr2CoO3Cl compound shows an unambiguously high spin state (HS, 3d6, S=2). In the HS spectrum, there shows a mean peak and a shoulder characteristic in the lower energy range in L3-edge, while there are two shoulders in the L2-edge, one stays in the higher energy range than mean peak and another one stays in the lower energy range.
If we compare the PrSrCoMnO6 XAS spectrum with other trivalence cobalt spectra more carefully, we can find that the L3-edge of PrSrCoMnO6 spectrum is very
32
similar to Sr2CoO3Cl2 Co3+ HS state, but the L2-edge looks like the combination of Co3+ HS and LS spectra. We are interested in such an unusual phenomenon.
775 780 785 790 795 800
PrSrCoMnO
6 Sr2CoO3Cl (Co3+ HS) EuCoO3 (Co3+ LS)CoO
(Co
2+)
Co-L2 Co-L3T
o
ta
l
E
le
c
tr
o
n
Y
ie
ld
(
a
rb
.
u
n
it
s)
Co-L
2,3
XAS spectra at room temperature
Photon Energy (eV)
Fig. 5-4 Co L-edge XAS data
33
In order to study the spin state of Co3+ ions in PrSrCoMnO6, we also measured the temperature dependent Co L-edge XAS spectra at Dragon beam line in NSRRC. The temperature dependent Co L-edge spectra is shown in Fig. 5-7, we find a shoulder characteristic presence at lower energy range of L3-edge in all temperature, and the shoulder intensity decrease with temperature decreasing. On the other hand, the intensity of peak at 795eV in L2-edge increase with temperature decreasing.
We focus on the L3-edge first, there shows a shoulder characteristic in the lower energy range, which is the contribution from Co3+ HS state. As the temperature increasing, the shoulder intensity also increases. We infer that the HS population increases with temperature increasing. Now turn to the L2-edge, there shows a peak at 795eV which come from Co3+ LS spectra. As the temperature increasing, we saw the peak intensity become lower. We infer that the LS population decreases with the temperature increasing, this result consists with that in the L3-edge. Up to now, we assume that the Co3+ ions in PrSrCoMnO6 sample is an HS-LS mixed-spin state system, and the HS state presence more at higher temperature.
775 780 785 790 795 800 0.0 0.2 0.4 0.6 0.8 1.0 1.2
N
o
rm
al
iz
ed
i
n
te
n
si
ty
(
ar
b
.
u
n
it
s)
Co-L 2T=400 K
T=300 K
T=18.3 K
Photon Energy (eV)
PrSrCoMnO
6Co
L-edge XAS (TEY)
Co-L3
34
5-4 Powder X-ray diffraction
The X-ray diffraction experiment of powder PrSrCoMnO6 sample is down by the Brucker D8 diffractometer with Cu Ka radiation. The Rietveld refinement is down by the Brucker DIFFRAC.TOPAS software. Fig.5-8,9(a~d) shows the room-temperature XRD results of PrSrCoMnO6, blue curve represents the experiment data, red curve represents the simulation result from Rietveld refinement, and the green curve represents the difference between experiment data with simulation. The crystal structure is solved to have monoclinic P21n space group [a=5.401453(53) Å , b=5.427901(50) Å , c=7.663798(70) Å; α=γ=90.0 degree and β=89.55283(63) degree] as shown in the Fig.5-10.
For room-temperature XRD data, Rietveld refinement gives two sites for transition metals in table 5-1, both sites have six oxygen around and form a TMO6 octahedral coordination. Since the XRD can only tell the distance around but not atoms, we tried to distinguish them from some reference. First we compare the average Mn-O bond length between PrSrCoMnO6 to La1-xCaxMnO3 perovskite, x=0, 0.3, 0.5, 0.9 and x=1 in table 5-2[23~27]. For a higher valence of Mn ion, the average bond length should become shorter, so the site-2 has more chance to be the Mn site. Second, we compare with the La2-xSrxCoMnO6(x=0 and 0.4) double perovskite[28,29] in table 5-3, which also show site-2 <Mn-O>=1.9202 Å might be the Mn site. Now we compare the average Co-O bond length of CoO6 coordination with ReCoO3 (Re=Eu, Sm, La) perovskite[30~32] in table 5-4, which are all Co3+ case.
In the CoO6 octahedral environment, the Co 3d degenerate state was separated into eg and t2g state with 10Dq difference by the crystal field, and the eg state was separated into x2-y2 and 3z2-r2 with ∆eg difference by the distortion. Depending on the ratio between Hund’s coupling 10Dq and JH splitting, Co3+ ions (3d6) may exhibit either low-spin (LS,S=0) or high-spin (HS,S=1) states as shown in Fig.5-11.
35
An easy way to calculate the total energy of HS or LS state is to set the t2g energy level to be zero, gain one crystal field energy 10Dq for each electron which stays in the eg state, and also consider about the exchange interaction (Hund’s coupling) between each 3d electrons.
H ex ex F C total J m m n n E E E E ] 2 ) 1 ( 2 ) 1 ( [ .
n is the number of spin up electrons, m is the number of spin down electrons, JH is the Hund’s coupling energy. For Ni2+
, the total energy of HS and LS can be describe as :
H LS HS H LS H HS 4J -10Dq E -E 6J -10Dq * 0 E 10J -10Dq * 2 E
HS state would be ground state in a small crystal field case.
In the Co L-edge XAS data, PrSrCoMnO6 shows a high spin like spectrum shape and ReCoO3 shows low spin spectra, which means the crystal field in PrSrCoMnO6 is smaller than those three else, so Co ions should stay in site-1 and have the longest average Co-O bond lengh 1.9342 Å .
To give a summary, at room temperature, Co ion has a average Co-O bond length of 1.937 Å in the CoO6 coordination, and Mn ion has a average Mn-O bond length of 1.920 Å in the MnO6 coordination.
36 20 30 40 50 60 70 80 90 100 110 120 -20000 0 20000 40000 60000 80000 100000 120000 140000
PrSrCoMnO
6 c ou nt s2
(degree)
exp.
cal.
I
exp.-I
cal.XRD, T=300 K, 40 kV, 40 mA, 6s/step, step size 2 =0.006
Fig.5-8 X-ray diffraction data of powder PrSrCoMnO6 sample
32.8 33.0 33.2 33.4 33.6 -30000 0 30000 60000 90000 120000 150000 PrSrCoMnO 6 , T=300 K c oun ts 2 (degree) exp. cal. I exp.-Ical. (a) 40.4 40.6 40.8 41.0 41.2 41.4 -10000 0 10000 20000 30000 40000 50000 60000 PrSrCoMnO6 , T=300 K c oun ts 2 (degree) exp. cal. I exp.-Ical. (b) 47.2 47.4 47.6 47.8 48.0 0 20000 40000 60000 80000 PrSrCoMnO6 , T=300 K c oun ts 2 (degree) exp. cal. I exp.-Ical. (b) 58.5 58.8 59.1 59.4 59.7 -20000 0 20000 40000 60000 80000 PrSrCoMnO6 , T=300 K c oun ts 2 (degree) exp. cal. I exp.-Ical. (b)
Fig.5-9(a,b,c,d) Details of X-ray diffraction data and simulations on PrSrCoMnO6.
37
Fig.5-10 Solved crystal structure of PrSrCoMnO6 at T=300 K.
Site-1
Site-2
Co/Mn-O
1(Å )
1.87(11)
1.98(12)
Co/Mn-O
2(Å )
1.97(12)
1.89(12)
Co/Mn-O
3(Å )
1.970(73)
1.889(73)
d
ave(Å )
1.937(101) 1.920(104)
38
Table 5-2. Mn-O bond lengh in MnO6 coordination
Table 5-3. Mn-O bond lengh in double perovskite samples
39
Fig. 5-11. High spin and low spin in Ni2+ (3d8) case.
On the other hand, we also did the XRD experiment on PrSrCoMnO6 at T=12 K. The XRD data and the Rietveld refinement results are shown in the Fig.5-12,13(a~d). The low temperature crystal structure is solved to have monoclinic P21n space group [a=5.438825(83) Å , b=5.395555(91) Å , c=7.62190(12) Å ; α=γ=90.0 degree and β=89.9572(19) degree] as shown in Fig.5-14. The solved crystal structure also shows two transition metal sites with different TM-O bond length. Table 5-5 shows the comparison of lattice parameter in PrSrCoMnO6 between T=300 K and T=12 K. PrSrCoMnO6 still keeps the space group P21n at low temperature, same as that in the
room temperature. An interesting thing is that the lattice volume become smaller and the average Mn-O bond length also become shorter at low temperature, but the average Co-O bond length become 1.980(57) Å at low temperature, which is longer than the Co-O bond length at room temperature.
40 20 30 40 50 60 70 80 90 100 110 120 0 50000 100000 150000 200000 250000 300000 350000 400000 450000
exp.
cal.
I
exp.-I
cal.PrSrCoMnO
6XRD,
T=12 K
, 40 kV, 40 mA, 36s/step, step size 2 =0.012coun
ts
2
(degree)
Fig.5-12 X-ray diffraction data of powder PrSrCoMnO6 sample at T=12K.
32.6 32.8 33.0 33.2 33.4 33.6 -100000 0 100000 200000 300000 400000 500000 PrSrCoMnO6 , T=12 K exp. cal. Iexp.-Ical. count s 2 (degree) (a) 40.4 40.6 40.8 41.0 41.2 41.4 -20000 0 20000 40000 60000 80000 100000 120000 PrSrCoMnO 6 , T=12 K exp. cal. Iexp.-Ical. count s 2 (degree) (b) 47.0 47.2 47.4 47.6 47.8 48.0 48.2 0 50000 100000 150000 200000 PrSrCoMnO6 , T=12 K exp. cal. Iexp.-Ical. count s 2 (degree) (c) 58.5 58.8 59.1 59.4 59.7 60.0 0 40000 80000 120000 160000 PrSrCoMnO6 , T=12 K exp. cal. Iexp.-Ical. count s 2 (degree) (a)
Fig.5-13 (a,b,c,d) Details of X-ray diffraction data and simulations on PrSrCoMnO6 at T=12 K
41
Fig.5-14 Solved crystal structure of PrSrCoMnO6 at T=12 K.
42
5-5 XANES theoretical calculation by XTLS
To confirm the spin state of Co3+ in PrSrCoMnO6, we also discussed the theoretical calculations of L2,3 XAS line shape by XTLS software from A. Tanaka [8] using the full atomic multiplet theory, together with hybridization of Co 3d orbital with the O 2p ligands and the point charge crystal field in CoO6 cluster. The simulation input files were provided by Dr. Z. Hu.
If compare the room temperature PrSrCoMnO6 spectrum with the Co3+ HS and LS spectra more carefully, we find there shows a shoulder characteristic at 777.7 eV in PrSrCoMnO6 spectrum, and this characteristic do not come from Co3+ HS spectra or Co3+ LS spectra. Compare the 777.7 eV characteristic with CoO spectrum, the shoulder characteristic match well with the first peak of L3-edge in CoO, means there exist few oxygen absence at sample surface and cause few presence of Co2+ ions. To get a pure Co3+ spectrum, we subtract a suitable ratio of CoO spectrum as shown in Fig. 5-15.
In the simulation of room temperature data, we use the hybridization coefficient
pdσ = -1.70 eV [4], set ∆eg = 0 eV (since distortion doesn’t change the Co3+ spin state). We focus on the peak splitting and ratio of intensity in both L2 and L3 edge, a shoulder characteristic in L3-edge and a charge transfer characteristic at 788.5 eV. Finally we get a best fit to PrSrCoMnO6 spectra in 10Dq=0.495 eV (see Fig.5-16).
In the theoretical calculation from XTLS software, the calculation result gives the ground state and first 15 exciting states. For a given temperature parameter, the calculation result spectrum shows the combination from the 16 states and obeys the Boltzmann rule. Table.5-6 shows the energy and total spin S(S+1) for each state, ∆E is the energy difference related to the ground state. The total spectrum considered the thermal excitation at finite temperature. In state-1, the total spin S(S+1) = 0.4339917 presents a low spin state (LS, S=0), while the state-2~4 show the S(S+1) = 5.983913
43
means the total spin is very close to the high spin state (HS, S=2).
Fig. 5-17 shows the ground state of several simulations in different fitting parameter 10Dq, and find the ground changes from LS (10Dq=0.47259 eV) to HS (10Dq=0.47258). From the Co L2-edge XAS spectra line shape, we obviously see that PrSrCoMnO6 is neither pure high spin nor pure low spin state
So far, from the list of each state, we assume the cobalt ion is a HS-LS mixed system and can be described as the combination of the ground state (state-1) and the triply degenerate 1st exciting state (state-2~4).
775 780 785 790 795 800 0.0 0.2 0.4 0.6 0.8 1.0 1.2 N o rm al iz ed i n te n si ty ( ar b . u n it s) Co-L 3 Co-L2
Co
L-edge XAS (TEY)
Photon Energy (eV)
PrSrCoMnO6 T=300 K,raw data CoO (Co2+)
PrSrCoMnO6 T=300 K,pure Co+3
Fig. 5-15 Co L-edge XAS spectra with Co2+ impurities
775 780 785 790 795 800
N
or
m
al
iz
ed
in
te
ns
ity
(a
rb
. u
ni
ts
)
Co-L2Photon Energy (eV)
exp. PrSrCoMnO6 theo. 10Dq=0.495 eV XAS spectra at room temperature Co-L3
44
state Energy (eV) S(S+1) ∆E (eV)
State-1 -7.8035207919660046 0.4339917 0 State-2 -7.7709324835719755 5.983913 0.032588 State-3 -7.7709324835719746 5.983913 0.032588 State-4 -7.7709324835719746 5.983913 0.032588 State-5 -7.7484215104846887 5.910728 0.055099 State-6 -7.7484215104846879 5.910728 0.055099 State-7 -7.7442833378101614 5.946827 0.059237 State-8 -7.7442833378101605 5.946827 0.059237 State-9 -7.7442833378101597 5.946827 0.059237 State-10 -7.7089677557410514 5.530704 0.094553 State-11 -7.7078332127177269 5.872373 0.095688 State-12 -7.7078332127177269 5.872373 0.095688 State-13 -7.7078332127177269 5.872373 0.095688 State-14 -7.7037092828197791 5.875087 0.099812 State-15 -7.7037092828197808 5.875087 0.099812 State-16 -7.7037092828197800 5.875087 0.099812
Table 5-6 Energy and total spin S(S+1) for each state in 10Dq=0.495eV by XTLS
775 780 785 790 795 800 0.0 0.2 0.4 0.6 0.8 1.0 1.2 N o rm a li z e d i n te n si ty ( a rb . u n it s) Co-L2
photon energy (eV)
PrSrCoMnO
6, T=300 K
10Dq=0.47258 eV
10Dq=0.47259 eV XAS simulation <Ground state only>
Co-L3
![Fig. 2-4. Magnetization measurement of Ni(NO 3 ) 2 At 2 K under magnetic field. [2]](https://thumb-ap.123doks.com/thumbv2/9libinfo/8111826.165567/16.892.229.624.507.795/fig-magnetization-measurement-ni-k-magnetic-field.webp)
![Fig. 2-5 Double perovskite structure of LaCaMnCoO 6 . [6]](https://thumb-ap.123doks.com/thumbv2/9libinfo/8111826.165567/17.892.144.760.499.1036/fig-double-perovskite-structure-of-lacamncoo.webp)