臺灣非營利醫療機構之財務報表分析:資料包
絡分析法的應用
The Financial Statement Analysis of Not-for-profit Medical
Institutions in Taiwan: An Application of the DEA Approach
郭振雄
Jenn-Shyong Kuo
羅光達
Kuang-Ta Lo
國立臺北大學會計學系
國立政治大學財政學系
Department of Accountancy, National Taipei University and Department of Public
Finance, National Chengchi University
(Received August 28, 2012; Final Version December 25, 2013)
摘要:本文採用資料包絡分析法 (data envelopment analysis; DEA) 來計算臺灣46家非營利醫療 機構的財務績效指標。本文在計算非營利醫療機構的財務績效指標時,亦將其商業與社會的角 色同時納入考量。本研究的實證結果顯示,透過DEA方法計算而得的財務績效指標與八個傳統 財務比率之間具有高度的相關性。同時,DEA方法計算的財務績效指標,不僅涵蓋醫療機構的 獲利性與資產使用效率的資訊,也包括其提供社區公益服務的資訊。此外,實證結果也顯示, 醫療機構的健保給付等級與其財務績效指標間呈現正向關係。換言之,本研究的樣本顯示醫院 的健保給付等級愈高,除了表示其醫療品質愈高之外,同時也會有著較佳的財務績效表現。因 此,本研究認為透過由DEA所計算而得的整體財務績效指標與傳統財務比率的共同分析,更能 夠提供非營利醫療機構完整且互補的財務表現之訊息。 關鍵詞:非營利醫療機構、資料包絡分析法、績效指標、社區公益服務
Abstract: This study employs the data envelopment analysis (DEA) to compute the financial
performance index of 46 not-for-profit medical institutions in Taiwan. The results suggest that our DEA financial performance index relates highly with eight major financial ratios that represent both
operational and social roles of not-for-profit medical institutions. The DEA financial performance index encompasses not only profitability and information regarding the efficiency of assets usage, but also information regarding services of benefit to the community. In addition, the results further show that not-for-profit medical institutions in different accreditation statuses also have different financial performance. In our sample, a hospital with a higher accreditation status or better medical quality will have better financial performance. Hence, this study concludes that complementing the DEA approach with the traditional ratio analysis permits more detailed analysis of performance measures for not-for-profit medical institutions in Taiwan.
Keywords: Not-for-profit Medical Institutions, Data Envelopment Analysis, Performance Index,
Community Benefit Service
1. Introduction
The Ministry of Health and Welfare (MOHW) supervises and assists medical institutions according to their provision of health care, ensuring that all citizens have access to proper health-care services. A good financial status is a necessary condition for medical institutions to provide high-quality and adequate medical service. If financial difficulties occur and further cause medical institutions to be out of business, it will not only affect citizens’ hospitalization rights but increase the burden of the government. Therefore, understanding whether a medical institution has proper financial performance becomes an important issue.
Unlike profit medical institutions, not-for-profit hospitals provide medical services together with lots of community benefit services free to consumers and societies These community services are mainly supported by the revenues from operating activities and donations. However, if there is a financial crisis so that a medical institution files for bankruptcy or financial distress, the local government or the organization designated by the government will take over the ownership according to the Medical Care Law. In other words, when a medical institution encounters a financial crisis, the government can either take over the medical institution or provide financial support. Either alternative will lead to extra tax burden of taxpayers. Therefore, the MOHW should pay much closer attention to the financial situations of not-for-profit medical institutions.
As of 2008, there are 46 not-for-profit medical institutions in Taiwan, including 7 academic medical centers, 19 metropolitan hospitals, 13 local community hospitals, and 7 pathological
health-care institutions. Belonging to different accreditation statuses has some financial impacts to these medical institutions.1 For example, in order to achieve a higher accreditation status, not-for-profit hospitals are willing to invest more financial resources into education training and facility replacement. Besides, a hospital with a higher accreditation status can receive higher payments and funding from the National Health Insurance (NHI). Moreover, to ensure that the referrals and the hierarchy of the medical services system are practicable, the NHI stipulates that outpatients have to pay a higher co-payment ratio if their first visit is not to a local medical institution.
The stakeholders of not-for-profit hospitals include donors, the board of directors, the management, the government and the community. Each interested party can survey the reference information of financial performance, which is usually available in financial statement reports, to monitor the operations and confirm whether its own interests are properly protected. Thus, it is important to understand and inspect how not-for-profit hospitals manage their financial performance. Scholars and managers traditionally use a single financial index or ratio to evaluate the financial performance; for instance, the return on assets, the cash return on sales, and the asset turnover. However, the ratio analysis is not able to perceive the comprehensive financial performance, and the result is sensitive to the choice of financial index. As Feroz et al. (2003) argued the appeal of ratios is its convenience and ease to compute but its interpretation is quite problematic, especially when two or more ratios provide conflicting signals. In truth, an analyst has to pick and choose ratios in order to assess the overall performance of an organization; hence, the ratio analysis is often criticized on the grounds of subjectivity. Moreover, a single financial ratio is also difficult to capture the social role represented by community services, which is an important performance for a not-for-profit hospital. In order to have a more comprehensive index capable to include different aspects of financial performance and the community services of a not-for-profit hospital together, this study tries to utilize the data envelopment analysis (DEA) approach to aggregate multiple financial information, and then compute a composite financial performance index of not-for-profit hospitals.
It is worth noting that previous studies using the DEA approach in healthcare institutions mostly try to measure the technical efficiency; however, this study tries to investigate the financial performance via the DEA approach instead. Furthermore, this study also examines the relationship between the accreditation status and the financial performance of a not-for-profit hospital to demonstrate whether a hospital with a higher accreditation status would have better or worse financial
1 The accreditation status of a medical institution is evaluated by the Taiwan Joint Commission on Hospital
Accreditation sponsored by the MOHW.
performance. Thus, the objective of this study is to devise a financial performance index for a not-for profit hospital by using the DEA approach, and to evaluate and compare this DEA measure with various financial ratios commonly used to indicate performance levels.
Our results show that the use of DEA approach allows different measures of financial performance to be considered simultaneously in determining a single overall measure of financial performance, but the ratio analysis also can provide additional information that is not available from the DEA approach. Hence, complementing the DEA approach with the traditional ratio analysis permits more detailed analysis of performance measures for not-for-profit hospitals.
The rest of this paper is organized as follows. Section 2 discusses the issues in the literatures. Section 3 describes our estimation models, data and also defines the variables. Empirical results are presented in Section 4. Section 5 finally concludes this study.
2. Literature Review
The financial ratio analysis is a standard approach to evaluate financial performance (Beaver, 1966, 1968; Altman, 1968). It can predict the possibility of an organization facing a financial crisis, a bankruptcy, or being out of business. Different criteria can measure profitability, asset utilization, capital structure, and liquidity (Zeller et al., 1996). However, a single financial ratio only can interpret a specific financial condition (Wilcox-Gök, 2002; Valdmanis, 1990). Thus, the limitation of the financial ratio analysis is that only two activities, as represented by the numerator and denominator, are examined for any particular indicator. In other words, the traditional ratios either examine only a part of organizational activities, or break down multiple dimensions into a single unsatisfactory accounting number (Smith, 1990). Moreover, a higher or a lower ratio may be manipulated or preferable, depending on the addressed issue and the analysts’ perspectives. To deal with this uncertainty, some earlier studies attempt to make ad hoc assumptions to combine ratios by using a weighting method (Cleverley, 1985; Caruana and McHugh, 1980), while other studies adopt an objective weighted method based on a mathematical model (Smith, 1990; Ozcan and McCue, 1996; Bowlin, 1999). Either method can develop a weighted optimal financial performance index to provide a clear and definite measure for a supervisor to oversee the organization’s activities.
Nowadays, many studies have applied the DEA method to evaluate technical efficiency and/or cost efficiency of medical institutions. The DEA method is an efficient tool for performance evaluation which was originally developed to measure the relative efficiency of peer decision making units (DMUs) in the multiple-input and multiple-output settings. In a DEA framework, performance is
evaluated with respect to an efficient frontier. The efficient frontier is constructed by examining linear combinations of DMUs and determining the minimum input usage necessary to achieve a given output level (Hua et al., 2007). Smith (1990) adopts the DEA method to extend the traditional financial ratio analysis by means of various weighting systems. Ozcan and McCue (1996) constructed an aggregate measure of financial performance by DEA approach from a random sample of acute care hospitals, and also compared this DEA measure with the conventional ratio analysis. The results showed their DEA measure has captured what various financial ratios indicate independently, and the development of the DEA measure across many financial ratios eases the comparison of an individual hospital with its peers. They thus concluded the DEA index is able to serve as an effective measure of overall financial performance. Besides, they also showed that, on average, profitable hospitals are usually those who have efficient DEA scores of one; conversely, poor performing hospitals with low DEA scores incurred net losses or earned minimal profits.
Bowlin (1999) examined the financial performance of defense-oriented business and compared to non-defense business from 1983 to 1992. His approach took advantage of the characteristics of the DEA methodology and illustrated its potential as an alternative and complementary tool for financial analysis. He finally argued that the DEA method is supplemented by, and compared to, traditional financial ratio analysis which provides additional insight into the financial performance of defense-business segments. Bowlin (2004) also assessed the financial stability of Civil Reserve Air Fleet (CRAF) participants from 1988 to 1997 using DEA method complemented by the traditional ratio analysis. Similarly, he also concluded that the use of DEA for financial analysis offers the advantage of being able to compute an aggregate performance measure from several financial ratios without resorting to some type of weighting scheme. Ferrier et al. (2006) concluded that there are several benefits of using DEA approach to evaluate hospital performance. First, this approach can accommodate the multiple inputs and outputs that characterize hospital production. This multiplicity, especially on the output side, is not as readily accommodated in econometric models of production. Second, unlike parametric methods, this methodology does not require the imposition of a particular functional form on the relationship between inputs and outputs. Third, this approach requires only quantity data, which are readily available in the case of hospitals, rather than price data which are less readily available and may not be accurate when they are available. However, one drawback of the DEA method is that there is no allowance for disturbance. As a result, all deviations from the frontier are typically attributed to inefficient performance.
plowing back excess revenues into recurrent expenditure makes them attractive to meeting physician demands for more advanced medical technology and other hospital substitutes for physician input. Nonetheless, these incentives may be offset by the need to ensure financial viability to expand some services, especially those that will lose money; for instance, research and charity care. Ferrier et al. (2006) argued that uncompensated care, such as charity care, could bring in financial difficulties for hospitals. Uncompensated care requires the use of resources that could have otherwise been used to produce healthcare for which compensation could have been received. This crowding out of compensated care, and its associated revenue, by uncompensated care represents an opportunity cost to the hospitals that provide it. In order to control this possible crowding-out effect, they include the uncompensated care as an output in their DEA model. They showed that the congestion associated with uncompensated care was responsible for decreasing compensated care by 2%.
Following Ozcan and McCue (1996) and Bowlin (1999), this study uses DEA approach to create a financial performance index by weighting multiple kinds of financial information. More importantly, to emphasize the importance of uncompensated care of not-for-profit hospitals, as argued by Worthington (2004) and Ferrier et al. (2006), this paper includes the community benefit service expenditure of hospitals to reflect their social role. Hence, computing a financial performance index in this way can explain the behavior of a not-for-profit hospital that is altruistic and self-seeking simultaneously.
Our study has two major differences from previous DEA research focusing on medical institutions. Firstly, unlike previous healthcare DEA papers which mainly study the technical efficiency of hospitals,2 our paper is focus on the financial statement analysis of hospitals via DEA approach. Secondly, most previous DEA studies of not-for-profit hospitals did not consider the variable of uncompensated care expenditure, which is the major difference between profit and
2
The major techniques of previous studies regarding the efficiency and productivity of medical institutions are mainly based on non-parametric frontier method (i.e. DEA and two stages DEA-regression), The non-parametric method is used over 50% of hospitals’ frontier efficiency analysis and most studied are cross sectional (Hollingsworth, 2008). However, there is an increasing use of parametric techniques such as stochastic frontier analysis (SFA). Besides, when measuring efficiency of medical institutions, the health gains of patients ideally should be the final output; however, patients’ healthcare consumption and condition are restraint so that most published research commonly use intermediate output variables in term of patients treated; for example, inpatient days or discharges (Newhouse, 1994; Jacob et al., 2006). Some studies use the case-mix adjusted outcome to increase accurate measure of intermediate output. On the other hand, the input variables of hospitals are mainly the staff and capital employed. Interested readers can refer to Hollingswroth (2003, 2008) and Shen et al. (2007) for greater detailed literature review.
not-for-profit hospitals. Our paper therefore emphasizes the community benefit service that is the important element when building the financial performance index for not-for-profit hospitals.
3. Methodology and Data
3.1 DEA method
This paper tries to use the DEA method to combine several pieces of financial information and community services information to obtain a comprehensive financial performance index, and also applies the concept of input-output production function to interpret this index. As Mostafa (2009) states that the first and very crucial step in conducting a DEA index is the determination of inputs and outputs. The main point in this process is that the input-output variables should be chosen in accordance with the type of efficiency being assessed (Sherman and Rupert, 2006). Efficiency in DEA is not confined to a traditional sense of operating efficiency; it can be generalized to represent relative evaluation of performance in any performance dimension if the inputs and outputs are specified according to the performance dimension considered (Manandhar and Tang, 2002).
Following Bowlin (1999), this paper selects six major variables of financial information to measure the financial performance under the DEA framework. Especially, according to the Article 46 of Medical Care Act in Taiwan, the medical institutions are requested to provide uncompensated activities and health education to the public, we thus consider community benefit service as the output of not-for-profit hospitals. Hence, for the variables of financial outputs, total revenues (TR), net income (NI), operating cash flows (OCF) and community benefit service expenditures (CBSE) are included. On the other hand, total assets (TA) and total operating expenses (TOE) are considered as the financial inputs. These variables are selected based on the following considerations. First, these variables are financial aspects of the production process; in other words, they involve the use of financial terms to measure inputs and outputs. For example, medical institutions use resources (e.g. total assets and operating expenses) to fulfill their objectives (e.g. profit, market share, cash flow, and community benefit service). Second, these variables relate to traditional financial ratios. For instance, total assets and net income can be used to calculate the return on assets (ROA), allowing us to compare the DEA index to traditional financial ratios. Third, all variables are easy to collect because they are declared in the financial statements of medical institutions. Finally, performing community benefit service is one of the most important charitable and community missions of not-for-profit hospitals. Allocating their resources to benefit the community through charitable activities and indigent health-care services, outreach programs, medical research and education, and health service programs
can help not-for-profit medical institutions to fulfill their charitable missions. In addition, the outputs of a not-for-profit hospital are not only the net incomes, but also uncompensated medical services, unsponsored research and education expenses, price differential from neighboring profit hospitals, and so on (Clement et al., 1994; Smith et al., 1995). Thus, Ferrier et al. (2006) considered uncompensated medical services as one of not-for-profit hospitals’ outputs. In this study, we use community benefit services as the social outputs of not-for-profit hospitals. The detailed definitions of these six financial variables are described as follows:
(1) Total Revenue (TR): It includes net outpatient revenue, net inpatient revenue, other medical service revenue, and non-medical activities revenue. Total revenue is a proxy for market share, which is one of main objectives of the not-for-profit medical institutions. Thus, total revenue is also an output of not-for-profit medical institutions.
(2) Net income (NI): It represents total revenue after deducting total operating expenses. The net income can measure the profit-making ability of the medical institution and evaluate its ability to utilize its resources. Net income is generally considered the key financial index in evaluating the financial position of organizations.
(3) Operating cash flow (OCF): It is from the operations section of cash flow statements. An income statement is an indicator to evaluate profit-making ability, but cannot figure out the cash flow situation of the medical institution. In other words, a medical institution may generate a large operating profit, but it still falls short of cash flow. Operating cash flow signals whether the medical institution’s productive activities generate sufficient cash flow to operate the medical institution and pay the bills. Beaver (1966) suggests the operating cash flow to be the best predictor of corporate financial distress.
(4) Community benefit service expenditure (CBSE): It includes all expenditures of charitable giving, education training and research projects, community health service programs, charity care, and indigent health-care assistance services. According to the Article 46 of Medical Care Act in Taiwan, a medical care institution shall allot at least 10 percent of the annual medical care income to conduct related research and development, professional training, and health education; in addition, it also has to allot at least 10 percent of the annual medical care income to conduct uncompensated activities, such as medical relief, community medical care services, and other community services. Because the MOHW seldom enforces this regulation, community benefit services thus becomes an ethical rather than an obligatory behavior of not-for-profit hospitals. Namely, not-for-profit hospitals provide community benefit services at their free will. Therefore,
this study uses the total expenditure of all different types of community benefit services as a proxy variable for the social role of not-for-profit hospitals.
(5) Total assets (TA): It represents the capacity available to produce medical and non-medical activities. This paper uses the book value of total assets as a proxy variable for the production capacity of a medical institution.
(6) Total operating expenses (TOE): It includes the medical related expenses (e.g. personnel expenses, medicine expenses, and general administration expenses) and the non-medical related expenses (e.g. fundraising expenses, interest expenses, and donations giving, etc.). This variable acts as a proxy measure for the amount of effort expended and resources consumed in producing medical services and community benefit services to generate profits, sales, cash flow, and the positive social image of a not-for-profit hospital.
After Charnes et al. (1978) proposed the DEA model, it has been applied to many research topics, and it also has several modifications. In order to compute a comprehensive finance performance index of not-for-profit hospitals, this study follows the DEA model suggested by Banker et al. (1984) where it allows a variable returns to scale (VRS) production process together with the an input-oriented DEA specification. Assuming that there are n (j=1…n) medical institutions that use two financial inputs (total assets and total operating expenses) to produce four financial outputs (total revenues, net income, operating cash flow, and community benefit service). The ratio for the financial performance of the kth medical institution is:
max hk=(𝑢𝑢NINIk+𝑢𝑢OCFOCF(νTAkTA+𝑢𝑢kTR+νTRTEkTE+𝑢𝑢kCBSE) CBSEk−𝑢𝑢0) (1)
subject to �𝑢𝑢NINIj+ 𝑢𝑢OCFOCFj+ 𝑢𝑢TRTRj+ 𝑢𝑢CBSECBSEj− 𝑢𝑢0� �νTATAj+ νTETEj� ≤ 1
𝑢𝑢NI, 𝑢𝑢OCF, 𝑢𝑢TR, 𝑢𝑢CBSE, νTA, νTE≥ 0, j = 1,2, … ,46
where, yj = (NIj, OCFj, TRj, CBSEj) is the financial outputs vector of jth medical institution and xj =
(TAj, TEj) is financial inputs vector of jth medical institution. 𝑢𝑢 = (𝑢𝑢𝑁𝑁𝑁𝑁, 𝑢𝑢𝑂𝑂𝑂𝑂𝑂𝑂, 𝑢𝑢𝑇𝑇𝑇𝑇, 𝑢𝑢𝑂𝑂𝐶𝐶𝐶𝐶𝐶𝐶) is a 4×1
vector of output weights and ν′= (νTA, νTE) is a 2×1 vector of input weights. Setting 𝑢𝑢0 = 0 allows
the medical institution to be evaluated under constant returns to scale (CRS). Medical institutions can be evaluated under variable returns to scale (VRS) without limited scales of operation by setting 𝑢𝑢0 as
a variable in Equation (1). The value of hk is the financial performance score of the kth medical
higher the value of hk, the higher the financial performance of the medical institution.
This ratio formulation might have infinite number of solutions. Imposing the constraint υx0= 1 can avoid this problem. Therefore, we can rewrite the linear programming problem to the multiplier form of kth medical institution:
max ∑4r=1 μryrk− μ0 (2) subject to � μr 4 r=1 yrk− � υi 2 i=1 xik− μ0 ≤ 0 � υi 2 i=1 xik= 1 υi, μr≥ 0, j = 1,2, … ,46,
r = NI,OCF, TR, CBSE, i = TA, TE
According to the duality in linear programming, we can derive an equivalent envelopment form as follows: min θ,λθk (3) subject to � λj 46 j=1 yj≥ yk � λj 46 j=1 xj≤ θkxk � λj 46 j=1 = 1, λj ≥ 0, j = 1,2, … ,46
where θk is a scalar and λ is a 46×1 vector of constants. This envelopment form has fewer constraints than the multiplier form so that it is more preferred to use.3 The value of θk solved from the envelopment form indicates the efficiency score of kth not-for-profit hospital. θk lies between 0 and 1, with the value of 1 implying a point on the frontier and hence an efficient unit.
Equation (3) is able to provide measures of technical efficiency of a not-for-profit hospital relative to the others within the same sample. It is worth noting that although technically inefficient not-for-profit hospitals can be ranked in order of their measured levels of efficiency, those who are found to be efficient are all ranked equally by the criterion. Therefore, Andersen and Petersen (1993)
3 We use this envelopment form to obtain the financial performance DEA index of not-for-profit hospitals.
suggest an alternative criterion that permits one to rank order firms that have all been found to be at 100% technical efficiency by DEA. According to their super-efficiency criterion, if two hospitals both are technically efficient, the one with greater room for reducing its output without becoming inefficient is, in a sense, more super-efficient than the other. Hence, we can rewrite Equation (3) to a super-efficiency problem with an input-oriented VRS specification as follows:
min θk−,λθk− (4) subject to � λj 46 j=1,j≠k yj≥ yk � λj 46 j=1,j≠k xj≤ θk−xk � λj 46 j=1,j≠k = 1, λj≥ 0, j = 1,2, … ,46; j ≠ k
when θk− is greater than unity, the kth not-for-profit hospital is defined as super-efficient.
Charnes et al. (1978) and Cooper et al. (2004) illustrated that DEA provides a relative efficiency measure for peer decision making units DMUs with multiple inputs and outputs. Under this approach, multiple inputs and multiple outputs are used to construct a piece-wise linear “best-practice’’ frontier. DEA derives the best-practice frontier by solving linear programming problems. The efficiency of an individual hospital is then gauged by its position relative to the best-practice frontier. Since the best-practice frontier likely diverges from the true underlying production frontier, the DEA relative efficiency measures can be thought of as lower bounds on the actual level of inefficiency present among the hospitals in the sample (Ferrier et al., 2006). The DMUs with efficiency values equal to 1 are defined as the efficient hospitals, so all DMUs with efficiency values of 1 can constitute a “facet reference set”. If a DMU’s efficiency value is smaller than 1, it indicates that such DMU appears inefficient as compared with the facet reference set, and its efficiency can be improved by means of various management measures (Lin et al., 2009). It is worth noting that in most models of DEA, all of the best performers have the full efficient status denoted by unity. In order to discriminate between these efficient DMUs, this paper also adopts Super-efficiency DEA model in Equation (4) to solve this problem. The top of Table 1 summarizes the descriptive statistics of four financial outputs and two financial inputs, and the financial performance index computed by the DEA approach in this study.4
4
Due to the space limitation of the paper, the DEA financial performance index of each not-for-profit hospital is available upon the request.
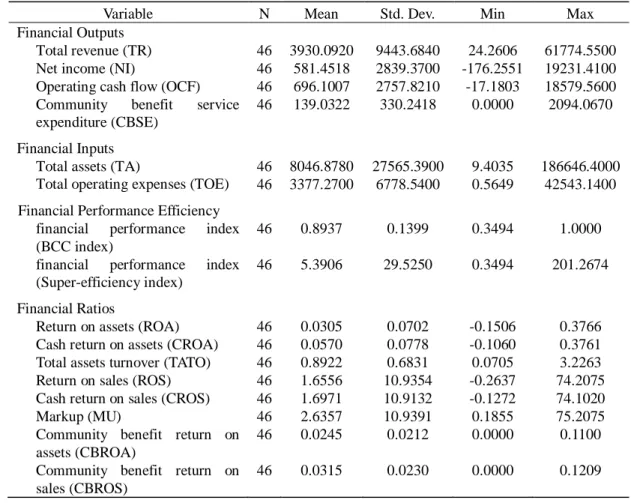
Table 1 Summary statistics of financial inputs and outputs
Variable N Mean Std. Dev. Min Max Financial Outputs
Total revenue (TR) 46 3930.0920 9443.6840 24.2606 61774.5500 Net income (NI) 46 581.4518 2839.3700 -176.2551 19231.4100 Operating cash flow (OCF) 46 696.1007 2757.8210 -17.1803 18579.5600 Community benefit service
expenditure (CBSE) Financial Inputs
46 139.0322 330.2418 0.0000 2094.0670
Total assets (TA) 46 8046.8780 27565.3900 9.4035 186646.4000 Total operating expenses (TOE) 46 3377.2700 6778.5400 0.5649 42543.1400 Financial Performance Efficiency
financial performance index (BCC index)
46 0.8937 0.1399 0.3494 1.0000
financial performance index (Super-efficiency index)
46 5.3906 29.5250 0.3494 201.2674
Financial Ratios
Return on assets (ROA) 46 0.0305 0.0702 -0.1506 0.3766 Cash return on assets (CROA) 46 0.0570 0.0778 -0.1060 0.3761 Total assets turnover (TATO) 46 0.8922 0.6831 0.0705 3.2263 Return on sales (ROS) 46 1.6556 10.9354 -0.2637 74.2075 Cash return on sales (CROS) 46 1.6971 10.9132 -0.1272 74.1020 Markup (MU) 46 2.6357 10.9391 0.1855 75.2075 Community benefit return on
assets (CBROA)
46 0.0245 0.0212 0.0000 0.1100
Community benefit return on sales (CBROS)
46 0.0315 0.0230 0.0000 0.1209
Notes: Monetary features are measured in NT$ millions.
The mean value of traditional BCC DEA financial performance index is 0.8937. That is, on average, the not-for-profit hospitals in our sample could have saved about 10.63% financial inputs, without reducing any financial outputs, if they had performed on the efficient frontier.5,6
5
The mean value of DEA financial performance index obtained from the Super-efficiency DEA model is 5.3906.
6
The authors are also grateful to the reviewers for suggesting us using the SBM model and the Super-SBM model to take account of the existence of slacks and also to rank the units that are all rated at the efficiency frontier. The empirical results of the SBM and Super-SBM model are concluded as follows: (1) the DEA financial performance index computed from the SBM model and the Super-SBM model are both highly correlated to eight traditional financial ratios; (2) the DEA index of efficient not-for-profit hospitals remains significantly different from those of inefficient ones; (3) the DEA index still indicates that the financial performance of academic medical centers is better than that ofmetropolitan hospitals and local community hospitals. Because the empirical findings of the SBM and Super-SBM model are very similar to those of the models we used in the paper, we therefore only discuss the results of traditional BCC model and the super-efficiency model.
3.2 Financial ratio analysis
As mentioned earlier, the financial ratio analysis is a traditional and standard approach to evaluate the financial performance for any organization. Therefore, although this study has calculated the financial performance index from the DEA method, we also compute eight single financial ratios for each not-for-profit hospital in order to compare our DEA financial performance index and the traditional financial ratios. The financial ratios selected in this study are as follows.
(1) The return on assets (ROA = NI / TA): It measures the ability to use total assets to generate profits.
(2) The cash return on assets (CROA = OCF / TA): It indicates the ability to use total assets to generate cash (Giacomino and Mielke, 1993).
(3) Total asset turnover (TATO = TR / TA): It represents the efficiency of using total assets to produce total revenues.
(4) The return on sales (ROS = NI / TE): It stands for the ability to use total expenses (TE) to produce net income.
(5) The cash return on sales (CROS = OCF / TE): It depicts the ability to use expensed effort (total expense) to produce operating cash flow.
(6) Markup (MU = TR / TE): It describes the ability of total expenses to generate revenue on every dollar. The markup represents the returns on sales (NI/TE) plus 1.
(7) The community benefit service return on assets (CBROA = CBSE / TA): It expresses the ability of medical institutions using total assets to provide community benefit services.
(8) The community benefit service return on sales (CBROS = CBSE / TE): It shows how effectively a medical institution uses total expenses to produce community benefit services. The community benefit service return on sales is also the program ratio, a factor that influences the decisions of donors and stakeholders to contribute (Baber et al., 2001; Okten and Weisbrod, 2000). Higher program ratios indicate that a larger proportion of total expenses is directed toward the charitable mission (Krishnan et al., 2006).
As seen, the above financial ratios, (1)-(6) are common indicators for evaluating the financial performance of medical institutions in terms of profit, cash flow, and total revenues. The ratios (7) and (8) can evaluate the abilities and incentives of the medical institutions using the resources to undertake community benefit services. The bottom of Table 1 provides the descriptive statistics of the above eight financial ratios.
4. Empirical Results
The DEA financial performance index is a composite measure where it considers different financial inputs and outputs simultaneously, whereas the traditional financial ratios only can stand for a single aspect of financial performance. It is true that when most traditional financial ratios of a not-for-profit hospital perform very well, its DEA index should be at the efficient frontier. However, it is also possible that a hospital can be still on the DEA efficient frontier while it only has a few financial ratios that are very outstanding. Thus, it is important to investigate a not-for-profit hospital’s financial performance from both the DEA index and traditional financial ratios; otherwise, medical institutions are free to adopt various financial strategies that can lead them to the efficient frontier.
In order to assess the validity of the DEA financial performance index, this study compares the DEA index and the above eight traditional financial ratios by the following three steps. We first defines not-for-profit hospitals on the frontier (DEA index=1) as efficient financial performers, and those not on the frontier (DEA<1) as inefficient financial performers. Next, we examine whether the eight financial ratios are significantly different between efficient and inefficient groups by using the t test and the Wilcoxon (rank sum) test. Finally, according to the conventional theory, there is a trade-off relationship between medical service quality and financial performance. This is because a higher level of medical service quality usually needs to spend more expenditure, leading to financial difficulties for hospitals. In this study, we consider the community benefit services as one of financial outputs. According to the Article 46 of the Medical Care Act in Taiwan, community benefit services are composed of uncompensated health care, such as charity care, and educational and research activities. Both are not financial rewarded activities, but educational and research activities could improve the medical quality and equipment in the future. In order to investigate whether better medical service quality is associated with worse financial performance, this study further tests whether a higher accreditation-status hospital would have a higher DEA financial performance index.
The DEA method essentially classifies all DMUs into two groups: efficient and inefficient. It is worth noting that when most DMUs are classified as efficient or as inefficient units based on the DEA index, this index in fact has no discrimination power to differentiate observations. To improve DEA’s discriminating power, the experience is that the number of DMUs should be at least two or three times the total number of inputs and outputs in any DEA application.7,8 Table 2 provides the numbers of
7
Golany and Roll (1989) establish a rule of thumb that the number of units should be at least twice the number of inputs and outputs considered. Bowlin (1998) suggests to have three times as the number of input and output variables. Dyson et al. (2001) recommend a total of two times the product of the number of input and output
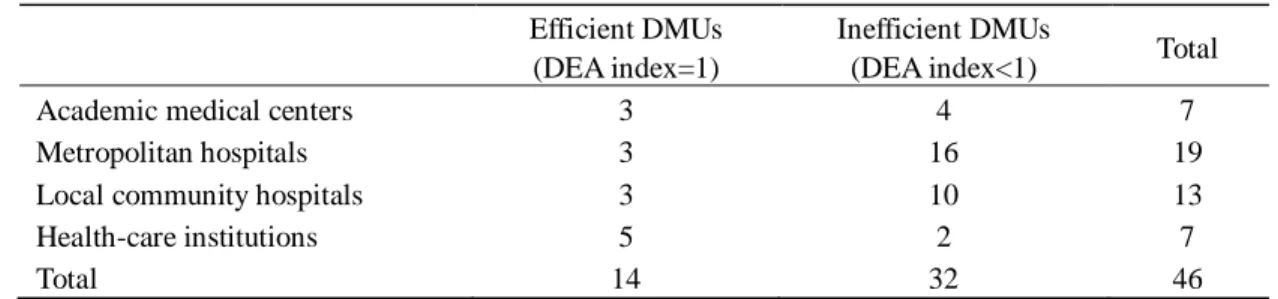
Table 2 The numbers of efficient and inefficient DMUs
Efficient DMUs (DEA index=1)
Inefficient DMUs
(DEA index<1) Total Academic medical centers 3 4 7
Metropolitan hospitals 3 16 19
Local community hospitals 3 10 13
Health-care institutions 5 2 7
Total 14 32 46
efficient and inefficient units in our sample according to the DEA index. Fourteen of the forty-six medical institutions are classified as efficient financial performers, among which, three are the academic medical centers, three are the metropolitan hospitals, three are the local community hospitals, and other five are the health-care units. On the other hand, the DEA index also identifies thirty-two not-for-profit medical institutions as inefficient financial performers as compared to their peers. Among these, four are academic medical centers, sixteen are metropolitan hospitals, ten are local community hospitals, and two are health-care units. The above evidence indicates that the health-care units have the highest proportion of units (5/7=0.71) that are identified as efficient financial performers, followed by academic medical centers (3/7=0.43), community hospitals (3/13=0.23), and lastly, the metropolitan hospitals (3/19=0.16).
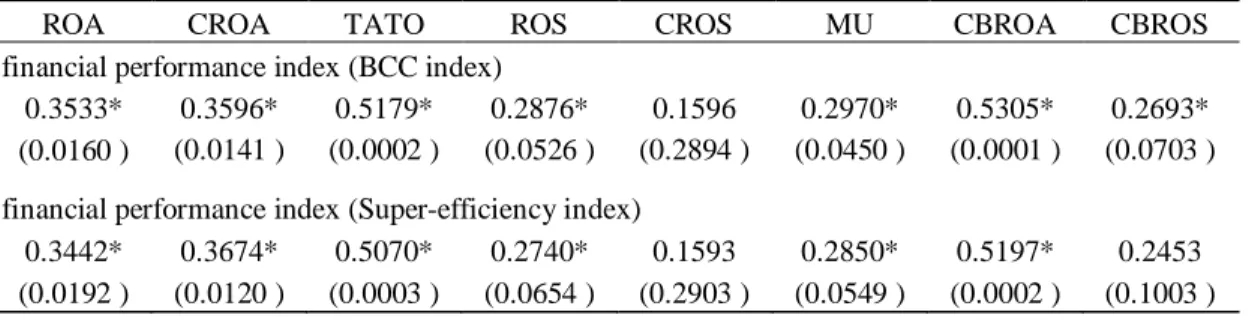
The purpose of this study is to compute an overall measure to represent the performance, including financial outputs and social service perspectives, of not-for-profit hospitals by the DEA approach. Thus, this DEA index should be correlated to each traditional financial ratios that are considered in the DEA application process. Table 3 provides the Spearman correlation coefficient of the DEA index and each traditional financial ratios. As shown in Table 3, the Spearman correlation coefficients are all significantly positive with the exception of cash return on sales (CROS) in both the BCC model and the Super-efficiency model, and the community benefit service return on sales (CBROS) in the Super-efficiency model only.
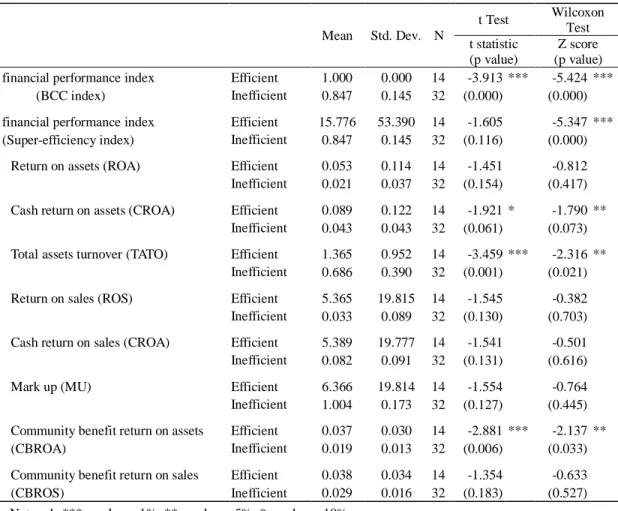
In addition, as seen in Table 4, the average return on assets (ROA), cash return on assets (CROA), total assets turnover (TATO), return on sales (ROS), cash return on sales (CROS), markup (MU), community benefit return on assets (CBROA), and community benefit return on sales (CBROS) are all
variables.
8
In this study, we adopt 4 outputs and 2 inputs to compute the DEA index from 46 not-for-profit medical institutions.
Table 3 The Spearman correlation coefficients with DEA index
ROA CROA TATO ROS CROS MU CBROA CBROS financial performance index (BCC index)
0.3533* 0.3596* 0.5179* 0.2876* 0.1596 0.2970* 0.5305* 0.2693* (0.0160 ) (0.0141 ) (0.0002 ) (0.0526 ) (0.2894 ) (0.0450 ) (0.0001 ) (0.0703 ) financial performance index (Super-efficiency index)
0.3442* 0.3674* 0.5070* 0.2740* 0.1593 0.2850* 0.5197* 0.2453 (0.0192 ) (0.0120 ) (0.0003 ) (0.0654 ) (0.2903 ) (0.0549 ) (0.0002 ) (0.1003 )
Notes: 1. Numbers in parentheses indicate p-values. 2. * p value <10%.
higher for not-for-profit hospitals that are on the frontier. In order to examine whether the DEA index and eight traditional financial ratios are statistically different between efficient and inefficient groups, we adopt the t test and the Wilcoxon test in this study. The results are shown in Table 4.
Both t test and the Wilcoxon test have similar results. They indicates efficient performers and inefficient performers are significant different in terms of cash return on assets (CROA), the total assets turnover (TATO) and the community benefit return on assets (CBROA). This result implies that the efficient performers defined by the DEA index in general have better financial performance than the inefficient performers in terms of different traditional financial ratios. Therefore, according to the Spearman correlation coefficient, t test and the Wilcoxon test, the DEA index computed in this study is justified to serve as an overall measure of financial performance of not-for-profit hospitals.
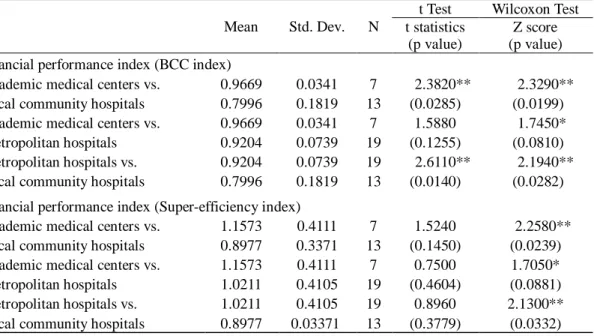
In our sample, the average values of DEA financial performance index computed from the BCC model for academic medical centers, metropolitan hospitals, and local community hospitals are 0.9669, 0.9204, and 0.7996, respectively (Table 5).9 As discussed earlier, a hospital evaluated in a higher accreditation level indicates better quality of medical services. These figures hence lead to the question of whether a hospital with better medical quality, represented in higher accreditation status, would have better or worse financial performance.10 We adopts the t test and the Wilcoxon test to identify whether the DEA financial performance index are significantly different between academic medical centers and local community hospitals, academic medical centers and metropolitan hospitals, and
9
On the other hand, the average DEA values calculated from the Super-efficiency model for academic medical centers, metropolitan hospitals, and local community hospitals are 1.1573, 1.0211, and 0.8977, respectively.
10
Because the health-care institutions are not included in the accreditation system in Taiwan, we exclude them in this discussion.
Table 4 t Test and Wilcoxon Test-by Different Efficient DMUs
Mean Std. Dev. N t Test Wilcoxon Test t statistic (p value) Z score (p value) financial performance index
(BCC index)
Efficient 1.000 0.000 14 -3.913 *** -5.424 *** Inefficient 0.847 0.145 32 (0.000) (0.000) financial performance index
(Super-efficiency index)
Efficient 15.776 53.390 14 -1.605 -5.347 *** Inefficient 0.847 0.145 32 (0.116) (0.000) Return on assets (ROA) Efficient 0.053 0.114 14 -1.451 -0.812 Inefficient 0.021 0.037 32 (0.154) (0.417) Cash return on assets (CROA) Efficient 0.089 0.122 14 -1.921 * -1.790 **
Inefficient 0.043 0.043 32 (0.061) (0.073) Total assets turnover (TATO) Efficient 1.365 0.952 14 -3.459 *** -2.316 **
Inefficient 0.686 0.390 32 (0.001) (0.021) Return on sales (ROS) Efficient 5.365 19.815 14 -1.545 -0.382 Inefficient 0.033 0.089 32 (0.130) (0.703) Cash return on sales (CROA) Efficient 5.389 19.777 14 -1.541 -0.501 Inefficient 0.082 0.091 32 (0.131) (0.616)
Mark up (MU) Efficient 6.366 19.814 14 -1.554 -0.764
Inefficient 1.004 0.173 32 (0.127) (0.445) Community benefit return on assets
(CBROA)
Efficient 0.037 0.030 14 -2.881 *** -2.137 ** Inefficient 0.019 0.013 32 (0.006) (0.033) Community benefit return on sales
(CBROS)
Efficient 0.038 0.034 14 -1.354 -0.633 Inefficient 0.029 0.016 32 (0.183) (0.527) Notes: 1. *** p value < 1%, ** p value < 5%, * p value < 10%.
2. Efficient: DEA index >=1; Inefficient: DEA index <1.
metropolitan hospitals and local community hospitals. The results are presented in Table 5. According to the Wilcoxon test, all values are rejected based on different significance levels.11 This result indicates that not-for-profit hospitals in different accreditation statuses also will have different financial performance. In our sample, a hospital with a higher accreditation status or medical quality will have better financial performance, which is contradictory to the conventional theory of a trade-off relationship between medical service quality and financial efficiency.
11
However, the results of t test are not significant in the Super-efficiency model.
Table 5 t Test and Wilcoxon Test-by Different Accreditation Statuses
Mean Std. Dev. N
t Test Wilcoxon Test t statistics
(p value)
Z score (p value) financial performance index (BCC index)
Academic medical centers vs. Local community hospitals
0.9669 0.0341 7 2.3820** (0.0285)
2.3290** (0.0199) 0.7996 0.1819 13
Academic medical centers vs. Metropolitan hospitals 0.9669 0.0341 7 1.5880 (0.1255) 1.7450* (0.0810) 0.9204 0.0739 19 Metropolitan hospitals vs. Local community hospitals
0.9204 0.0739 19 2.6110** (0.0140)
2.1940** (0.0282) 0.7996 0.1819 13
financial performance index (Super-efficiency index) Academic medical centers vs.
Local community hospitals
1.1573 0.4111 7 1.5240 (0.1450)
2.2580** (0.0239) 0.8977 0.3371 13
Academic medical centers vs. Metropolitan hospitals 1.1573 0.4111 7 0.7500 (0.4604) 1.7050* (0.0881) 1.0211 0.4105 19 Metropolitan hospitals vs. Local community hospitals
1.0211 0.4105 19 0.8960 (0.3779)
2.1300** (0.0332) 0.8977 0.03371 13
Notes: *** p value < 1%, ** p value < 5%, * p value < 10 %.
5. Discussion
This study utilizes the DEA approach (BCC model and Super-efficiency model) to compute a comprehensive financial performance index for 46 not-for-profit medical institutions in Taiwan. According to our empirical results, some findings are discussed as follows. First, the DEA financial performance index developed by this study is able to measure the multiple objectives of medical institutions simultaneously, such as profitability, market share, cash flow and community benefit services. The profit-oriented hospitals sometimes would provide community benefit services to society but the monetary reward is their main operational goal. Besides, due to the limited resources and diverse needs, the public hospitals usually cannot satisfy all individuals’ requests. Therefore, providing community benefit services become one of the major objectives of not-for-profit hospitals, and it is also the reason why they could receive donations and have tax deductions or exemptions. If a not-for-profit hospital tries to maintain sufficient financial resources, it may neglect community benefit service and focus only on business that may damage their social goals. In order to evaluate the overall outputs and multiple goals of not-for-profit hospitals, this study suggests using the DEA financial performance index, computed by the information from the social perspective (community benefit service) and the information from the business perspective (total revenue, net income and operating
cash flow). The DEA method conforms to the flexibility of multiple goals of not-for-profit hospitals. The flexible weighted scheme can reflect the performance of multiple-goal organizations, and the priorities among the goals can be ranked by the shadow prices of the objects using normalized virtual weights (Färe and Grosskopf, 2002).
Second, our DEA efficiency index is computed based on both financial perspectives and community services perspectives; therefore, it is possible that an efficient not-for-profit hospital (DEA index=1) might not perform properly in financial outcomes but perform well in community benefit services. For example, the return on assets (ROA) and the cash return on assets (CROA) of some medical institutions in our sample are lower than the overall average whereas their community benefit service return on sales (CBSR) are higher than the average. This situation still will lead them to an efficient performance under the DEA framework. However, it is worth noting that community benefit services are provided to the public without any charges. Thus, although not-for-profit hospitals may perform inefficiently in financial outputs in the short run, they still need to have sufficient financial resources to support their community services in the long run.
Third, community benefit service comprises a wide range of medical activities, such as medical education programs, medical research plans, charitable care, the dissemination of knowledge about hygiene in the community, and preventive inoculation programs.12 It is worth to mention that providing community benefit services will lower the current profitability of a not-for-profit hospital because they are usually free to the public, but on the other hand, they might bring in more private donations in the future.
Fourth, the medical system in Taiwan has been undergoing a major reform. One of the important issues is to improve the financial performance but still to maintain high standards of medical quality of hospitals. According to the hospital accreditation system in Taiwan, the higher accreditation status of a hospital is, the better medical quality provides. In this study, we have further shown that a higher accreditation-status hospital is associated with more efficient financial performance. Thus, it is possible that there is no trade-off relationship between financial efficiency and medical quality.
According to the results, some implications can be provided to managers, regulators, and the public. For managers, based on the framework of the DEA approach, two strategies can enhance the DEA financial performance index of hospitals. One strategy is to perform better than the peers in every operational aspect; the other strategy is to perform excellently only in some specific targets. For
12
According to the Article 46 of the Medical Care Act in Taiwan, community benefit services are composed of educational and research activities, and uncompensated health care.
example, in order to be at the DEA efficient frontier, a not-for-profit hospital can choose to perform perfectly in all financial outputs and community services, or to perform outstandingly only in community benefit services but not quite well in financial outputs. For regulators, since the DEA index can be manipulated by two strategies as above, it cannot replace the functions of financial statement analyses. In other words, the DEA financial performance index complements rather than serves as a substitute for the traditional financial ratios. For the public, our DEA index simultaneously provides the information of operational efficiency and charity behaviors. This can be a reference for potential donors.
6. Conclusion
In previous studies, a single financial ratio is often used to evaluate the financial performance of hospitals. However, this approach is not able to perceive the comprehensive financial performance, and the result is sensitive to the choice of financial ratios. Additionally, a single financial ratio is also difficult to capture the social role represented by community services of a not-for-profit hospital. In order to have a comprehensive index which include different aspects of financial performance and the community services of a not-for-profit hospital simultaneously, this study utilizes the DEA approach to construct a performance index according to multiple operational information. We demonstrate that the DEA performance index developed in this study can indicate the overall performance of not-for-profit hospitals both from their commercial aspects and social goals. Moreover, the results also show that academic medical centers have better financial performance than metropolitan hospitals and local community hospitals. This finding implies that improving a not-for-profit hospital’s medical quality which is measured by the different accreditation statuses would not damage financial performance.
This study also investigates the relationship of an overall financial performance measure, constructed by DEA, with traditional financial performance ratios. The findings supported our DEA performance index as an effective measure of overall financial performance, and can augment the traditional ratio analysis; therefore the DEA approach complements ratio analysis (and vice versa), and provides additional insights into the performance of the not-for-profit hospitals. As argued by Bowlin (2004), it is not appropriate to directly compare the DEA and ratio analysis because of their different characteristics. DEA is a methodology of frontier analysis while ratio analysis is an averaging technique. Also, DEA captures multiple interactions simultaneously that occur from having multiple outputs and inputs, while ratio analysis isolates on one relationship at a time. Consequently, the two methodologies do not allow for a direct comparison, but taken together can improve an analysis.
Concluding speaking, the use of DEA for financial analysis offers the advantage of being able to compute an aggregate performance measure from several financial ratios without resorting to some type of weighting scheme. It also does not require a priori specification of a production function. Both of these characteristics allow each hospital to determine its own path to better financial performance. Thus, complementing DEA approach with traditional ratio analysis permits more detailed analysis of performance measures for not-for-profit hospitals.
Although our DEA performance index, which simultaneously provides information regarding business and social activities, can serve as valuable reference information for the donors when they made their donation decisions, it should be used with some cautions. First, people have to be aware that managers have two different strategies that both serve to improve the DEA index; that is, hospitals may perform better than the peers in every operational aspect, or to perform well only in some specific targets. Second, the regulators can use this DEA index as a signal for management, but it only can be used as a complement rather than a substitute for financial statement analyses.
References
Altman, E., “Financial Ratios, Discriminate Analysis and the Prediction of Corporate Bankruptcy,”
Journal of Finance, Vo. 23, No. 4, 1968, pp. 589-609.
Andersen, P. and Petersen, N.C., “A Procedure for Ranking Efficient Units in Data Envelopment Analysis,” Management Science, Vol. 39, No. 10, 1993, pp. 1261-1264.
Baber, W. R., Roberts, A. A., and Visvanathan, G., “Charitable Organizations’ Strategies and Program-Spending Ratios,” Accounting Horizons, Vol. 15, No. 4, 2001, pp. 329-343.
Banker, R.D., Charnes, A., and Cooper, W. W., “Some Models for Estimating Technical and Scale efficiencies in Data Envelopment Analysis,” Management Science, Vol. 30, No. 9, 1984, pp. 1078-1982.
Beaver, W. H., “Financial Ratios as Predictors of Failure,” Journal of Accounting Research, Vol. 4 , Supplement, 1966, pp. 71-111.
Beaver, W. H., “Market Prices, Financial Ratios, and the Prediction of Failure,” Journal of Accounting
Research, Vol. 6, No. 2, 1968, pp. 179-192.
Bowlin, W. F., “Measuring Performance: An Introduction to Data Envelopment Analysis (DEA),”
Journal of Cost Analysis, Vol. 15, No. 2, 1998, pp. 3-27.
Bowlin, W. F., “An Analysis of The Financial Performance of Defense Business Segments Using Data Envelopment Analysis,” Journal of Accounting and Public Policy, Vol. 18, No. 4-5, 1999, pp.
287-310.
Bowlin, W. F., “Financial Analysis of Civil Reserve Air Fleet Participants Using Data Envelopment Analysis,” European Journal of Operational Research, Vol. 154, No 3, 2004, pp. 691-709.
Caruana, R. and McHugh, E.T., “Comparing Ratios Shows Fiscal Trends,” Hospital Financial
Management, Vol. 34, No. 1, 1980, pp.12-18.
Charnes, A., Cooper, W.W., and Rhodes, E., “Measuring the Efficiency of Decision Making Units,”
European Journal of Operational Research, Vol. 2, No. 2, 1978, pp. 429-444.
Clement, J. P., Smith, D. G., and Wheeler, J. R. C., “What Do We Want and What Do We Get From Not-for-Profit Hospitals?” Hospital and Health Services Administration, Vol. 39, No. 2, 1994, pp. 159-78.
Cleverley, W. O., “Predicting Hospital Failure with the Financial Flexibility Index,” Hospital
Financial Management, Vol. 39, No. 5, 1985, pp. 29-38.
Cooper, W. W., Seiford, L. M., and Zhu, J., Handbook on Data Envelopment Analysis, Boston: Kluwer Academic Publisher, 2004.
Dyson, R. G., Allen, R., Camanho, A. S., Podinovski, V. V., Sarrico, C. S., and Shale, E. A., “Pitfalls and Protocols in DEA,” European Journal of Operational Research, Vol. 132, No. 2, 2001, pp. 245-259.
Färe, R, and Grosskopf, S., “Two Perspectives on DEA: Unveiling the Link between CCR and Shephard,” Journal of Productivity Analysis, Vol. 17, No.1-2, 2002, pp. 41-47.
Ferrier, G. D., Rosko, M. D., and Valdmanis, V. G., “Analysis of Uncompensated Hospital Care Using a DEA Model of Output Congestion,” Health Care Management Science, Vol. 9, No. 2, 2006, pp. 181-188.
Feroz, E.H., Kim, S., and Raab, R.L., “Financial Statement Analysis: A Data Envelopment Analysis Approach,” Journal of the Operational Research Society, Vol. 54, No. 1, 2003, pp. 48-58.
Giacomino, D. and Mielke, D., “Cash Flows: Another Approach to Ratio Analysis,” Journal of
Accountancy, Vol. 175, No. 3, 1993, pp. 55-58.
Golany, B. and Roll, Y., “An Application Procedure for DEA,” Omega, Vol. 17, No. 3, 1989, pp. 237-250.
Hollingsworth, B., “Non-Parametric and Parametric Applications Measuring Efficiency in Health Care,” Health Care Management Science, Vol. 6, No. 4, 2003, pp. 203-218.
Hollingsworth, B., “The Measurement of Efficiency and Productivity of Health Care Delivery,” Health
Hua, Z. S., Bian, Y. W., and Liang, L., “Eco-Efficiency Analysis of Paper Mills Along the Huai River: An Extended DEA Approach,” Omega, Vol. 35, No. 5, 2007, pp. 578-587.
Jacobs, R., Smith, P. C., and Street, A., Measuring Efficiency in Health Care, Cambridge University Press: Cambridge, UK, 2006.
Krishnan, R., Yetman, M. H., and Yetman, R. J., “Expense Misreporting in Nonprofit Organizations,”
Accounting Review, Vol.81, No. 2, 2006, pp. 399-420.
Lin, T.T., Lee, C.C. and Chiu, T. F., “Application of DEA in Analyzing a Bank's Operating Performance,” Expert Systems with Applications, Vol., 36, No. 5, 2009, pp. 8883-8891.
Manandhar, R. and Tang, C., “The Evaluation of Bank Branch Performance Using Data Envelopment Analysis: A Framework,” Journal of High Technology Management Research, Vol. 13, No. 1, 2002, pp. 1-17.
Mostafa, M. M., “Modeling the Efficiency of Top Arab Banks: A DEA – Neural Network Approach,”
Expert Systems with Applications, Vol. 36, No. 1, 2009, pp. 309-320.
Newhouse, J.P., “Frontier Estimation: How Useful a Tool for Health Economics?” Journal of Health
Economics, Vol. 13, No. 3, 1994, pp. 317-322.
Okten, C. and Weisbrod, B. A., “Determinants of Donations in Private Nonprofit Markets,” Journal of
Public Economics, Vol. 75, No. 2, 2000, pp. 255–272.
Ozcan, Y. A. and McCue, M. J., “Development of a Financial Performance Index for Hospitals: DEA Approach,” Journal of the Operational Research Society, Vol. 47, No. 1, 1996, pp. 18-26.
Shen, Y. C., Eggleston, K., Lau, J. and Schmid, C. H., “Hospital Ownership and Financial Performance: What Explains the Different Findings in the Empirical Literature?” Inquiry, Vol. 44, No. 1, 2007, pp. 41-68.
Sherman, H. and Rupert, T., “Do Bank Mergers Have Hidden or Foregone Value? Realized Operating Synergies in One Bank Merger,” European Journal of Operational Research, Vol. 168, No. 1, 2006, pp. 253-268.
Smith, D. S., Clement, J. P., and Wheeler, J. R., “Philanthropy and Hospital Financing,” Health Service
Research, Vol. 30, No. 5, 1995, pp. 615-635.
Smith, P., “Data Envelopment Analysis Applied to Financial Statements,” OMEGA: International
Journal of Management Science, Vo.18, No. 2, 1990, pp. 131-138.
Valdmanis, V. G., “Ownership and Technical Efficiency of Hospitals,” Medical Care, Vol. 28, No. 6, 1990, pp. 552-561.
Performance of Hospitals,” Applied Economics, Vol. 34, No. 4, 2002, pp. 479-489.
Worthington, A. C., “Frontier Efficiency Measurement in Health Care: A Review of Empirical Techniques and Selected Applications,” Medical Care Research and Review, Vol. 61, No. 2, 2004, pp. 135-170.
Zeller, T. L., Stanko, B. B., and Cleverley, W. O., “A Revised Classification Pattern of Hospital Financial Ratios,” Journal of Accounting and Public Policy, Vol. 15, No. 2, 1996, pp. 161-182.