投資者的社群行為 - 政大學術集成
94
0
0
全文
(2) Social Behavior of Investors 投資者的社群行為 by Yuxian, Eugene Liang. A Dissertation Proposal Submitted in Partial Fulfillment of. 政 治 大. Requirement for the Degree of Master of Science. ㈻㊫學. In. Management information Systems. Nat. sit. y. •‧. •‧ 國. 立立. n. al. er. io. Supervisor: Soe-Tysr Yuan, Professor, MIS, NCCU. Ch. engchi. i n U. v. NATIONAL CHENGCHI UNIVERSITY 2013 October ©Yuxian, Eugene Liang. 1.
(3) Acknowledgement First, I would like to thank my advisor Daphne Yuan Soe-Tsyr for her advice and support. This thesis would not have been possible without her and without freedom, encouragement and support she has given me over the past 2 years here at Service Science Research Center (SSRC) and AeSL Lab. I have an amazing group of fellow researchers and collaborators: lab members here at SSRC and with the professors and researchers with the Flood and Fire Research Team. Each of them deserves my gratitude: Professor Tsai-Yen Li, Professor Pailin, Professor Yu-Chung Cheng, James, Steven and Lavender. A special thanks to Professor Tsai-Yen Li for his guidance throughout my days as an undergraduate and subsequently as a research assistant at Flood and Fire Research Team. A special. 政 治 大. shoutout to James, Steven and Lavender: you guys made my days fun in lab. =). 立立. Over the past 2 years I’ve also had a great time learning as an intern at IBM China Development Lab. •‧ 國. ㈻㊫學. and at Yahoo! Taiwan, without which I would not have gained enough technical skills to work through my thesis. I want to thank TC Liou, my mentor at Yahoo for his patience and guidance during my time. •‧. at Yahoo as a summer intern and subsequently as a project intern. I also want to thank the people whom I have worked with in one way or another at Yahoo: Peter, Aaron, Zordius, Marcus, Monty, HC, Annie,. sit. y. Nat. Lily, Dino, Chi-Chia, RuRu, Jing, Scott for their help and support over the years. I also want to thank. io. technology.. er. Curtis Wei for his guidance at IBM and how to think about both the technicality and business side of. al. n. v i n I’ve also (finally) made my first foray C intohentrepreneurship e n g c h i Uwith StartUp Weekend. I want to thank. Frank, Volker and David for their guidance during this period of time and their patience in talking and explaining how entrepreneurship works. And of course, I want to thank Jordon, my partner and brotherin-arms during this amazing entrepreneurship journey. Finally, I want to thank my parents, sister, relatives and friends back in Singapore for their endless love, encouragement and support.. 1.
(4) Abstract “In a world where social structure is everything, this (Facebook) was the thing.” ~ Sean Parker1, played by Andrew Garfield2 in The Social Network3 We live in a social world. Cultures, societies to organizations are influenced by it’s social network, be it internally and externally. We know how powerful social structures are: from influencing thoughts, cultural and social norms to stereotyping of races and class of people. We also see the influence of social networks everyday, from the Internet to our daily life. Sometime ago, we made an interesting observation based on heuristics: why do people who were current. 政 治 大 politics and so on. We further think through this issue and noticed an interesting trend: alumnis of 立立 specific schools have a strong tendency to invest in startups started by their juniors. students or alumni’s of Ivy Leagues or other popular schools tend to do well in life? Be it in businesses,. •‧ 國. ㈻㊫學. Examples are aplenty, especially in the case of universities of Ivy League status: Google received their. •‧. angel funding from Andy Bechtosheim, co-founder of Sun Microsystems and PhD in Stanford’s electrical engineering; Yahoo!’s early financing rounds was led by Michael Moritz of Sequoia Capital,. Nat. sit. n. al. er. io. alumni.. y. alumni of University of Pennsylvania. Facebook’s angel investment was made by Peter Thiel, a Stanford. i n U. v. Are these coincidences? Or are there other forces at work? Such as an old school-boy network? In this. Ch. engchi. research, we sought to understand these trends and build a predictive model.. 1. http://en.wikipedia.org/wiki/Sean_Parker. 2. http://en.wikipedia.org/wiki/Andrew_Garfield. 3. http://en.wikipedia.org/wiki/The_social_network. 2.
(5) Table of Contents CHAPTER 1: INTRODUCTION ............................................................................................................ 1 1.1 Introduction ..................................................................................................................................... 1 1.2 Contribution to Literature ............................................................................................................... 2 1.2.1 Modeling prediction of investment behavior as a link prediction problem ............................. 2 1.2.2 Combining multiple link prediction techniques to gain greater insight of social networks ..... 2 1.2.3 Providing general rules of thumb for companies seeking investment ..................................... 3 1.3 Research Structure .......................................................................................................................... 3 CHAPTER 2: RELATED WORK ........................................................................................................... 7 . 政 治 大. 2.1 Survey of Related Work..................................................................................................................... 7 . 立立. 2.2 Related Research on Investment Behaviors ................................................................................... 7 . •‧ 國. ㈻㊫學. 2.3 Related Research on Social Network Analysis .............................................................................. 8 . •‧. 2.4 Other Related Research .................................................................................................................. 9 2.5 Link Prediction as a Model to Predict Investor Behavior .............................................................. 9 . y. Nat. sit. CHAPTER 3: PROSPERITY TAIWAN ............................................................................................... 11 . n. al. er. io. 3.1 Prosperity Taiwan Project Backgroud .......................................................................................... 11 . i n U. v. 3.2 Taiwan’s Economic Strengths and Current Economic Landscape .................................................. 11 . Ch. engchi. 3.3 The “Prosperity” in Prosperity Taiwan ............................................................................................ 12 3.4 Vision of Prosperity Taiwan ............................................................................................................ 12 3.5 Culture, Arts and Creativity as an Example..................................................................................... 12 3.5 Intelligent Service Machines to aid Economic Transformation ...................................................... 13 3.5.1 The V+ Platform ....................................................................................................................... 14 CHAPTER 4: METHOLOGY ............................................................................................................... 17 4.1 Methodology ................................................................................................................................. 17 i.
(6) 4.2 Dataset.............................................................................................................................................. 20 4.2.1 CrunchBase Dataset .................................................................................................................. 20 4.2.2 Data Selection ........................................................................................................................... 22 4.3 Concepts, Definitions and Examples ............................................................................................... 23 4.3.1 People ........................................................................................................................................ 23 4.3.2 Companies ................................................................................................................................. 24 4.3.3 Financial Organization .............................................................................................................. 24 4.3.4 Investors .................................................................................................................................... 24 4.3.5 Social Graph .............................................................................................................................. 24 . 政 治 大. 4.3.5 Investment Graph ...................................................................................................................... 25 . 立立. 4.3.6 More definitions ........................................................................................................................ 26 . •‧ 國. ㈻㊫學. 4.4 Social Behavior of Investors in Facebook’s Small World .............................................................. 28 4.4.1 Understand Social Behavior using Descriptive Mining ............................................................ 29 . •‧. 4.4.2 Shortest Path .............................................................................................................................. 30 . y. Nat. sit. 4.4.3 Adamic/Adar ............................................................................................................................. 33 . n. al. er. io. 4.4.3 Jaccard Coefficient .................................................................................................................... 35 . i n U. v. 4.4.4 Common Neighbors .................................................................................................................. 38 . Ch. engchi. 4.4.5 Preferential Attachment............................................................................................................. 39 4.4.6 Number of Shortest Paths between Investor and Company ...................................................... 40 4.4.7 Where’s the Money? Guidelines for Seeking Investments. ...................................................... 41 4.4.8 Summary of Intuition ................................................................................................................ 41 4.5 Investors Are Social Animals: Modeling Investment Behavior as a Link Prediction Problem....... 41 4.5.1 Modeling Social Relationship ................................................................................................... 43 4.5.2 Learning Algorithms ................................................................................................................. 43 ii.
(7) 4.5.3 Significance of Methodology .................................................................................................... 44 4.6 Experiment Setup ............................................................................................................................. 45 4.6.1 Evaluation Metrics .................................................................................................................... 45 4.6.2 Evaluation.................................................................................................................................. 45 4.6.3 Cross Comparison of Performance Across Different Learning Algorithms ............................. 46 4.6.4 Ground Truth Labels ................................................................................................................. 46 4.6.5 Data Split for Training and Testing........................................................................................... 46 4.6.6 Experiment Runs ....................................................................................................................... 46 CHAPTER 5: EXPERIMENTS ............................................................................................................. 48 . 政 治 大. 5.1 Experiment Result ............................................................................................................................ 48 . 立立. 5.1.1 Aggregate Performance ............................................................................................................. 48 . •‧ 國. ㈻㊫學. 5.1.2 Industry Performance ................................................................................................................ 50 5.1.3 Summary of Performance Categorical Performance .............................................................. 53 . •‧. 5.2 General Performance ....................................................................................................................... 53 . y. Nat. sit. 5.2.1 Visualizing the Decision Process .............................................................................................. 54 . n. al. er. io. CHAPTER 6: VERFICATION .............................................................................................................. 56 . i n U. v. 6.1 Verification of Prediction Model ..................................................................................................... 56 . Ch. engchi. 6.2 Data Split for Experiments............................................................................................................... 56 6.3 Results for RenRen’s Small World .................................................................................................. 56 6.3.1 Aggregate Experiment............................................................................................................... 56 6.3.2 Industry Performance ................................................................................................................ 58 6.4 Comparing experiment results between Facebook and RenRen..................................................... 62 CHAPTER 7: SOUNDNESS OF SOCIAL NETWORK FEATURES AS INVESTMENT BEHAVIOR INDICATORS ................................................................................................................... 63 . iii.
(8) 7.1 Soundness of Social Network Features as Investment Behavior Indicators ................................. 63 7.1.1 Performance between Datasets.................................................................................................. 63 7.1.2 Differences in Performance ....................................................................................................... 63 Chapter 8: The Capital+ IT System....................................................................................................... 66 8.1 Architecture of Capital+ .................................................................................................................. 66 8.2 Capital+ Walk Through ................................................................................................................... 67 8.2.1 Exploring relationships ............................................................................................................. 67 8.2.2 Recommended Investors and or Companies ............................................................................. 71 8.2.3 Visualizing relationships between Investors and Companies ................................................... 73 . 政 治 大. CHAPTER 9: CONCLUSION AND FUTURE WORK ...................................................................... 75 . 立立. 9.1 Conclusion and Future Work ........................................................................................................... 75 . •‧ 國. ㈻㊫學. 9.2 Summary of Contributions ............................................................................................................... 75 9.2.1 Social Features are Reliable Features for Predicting Investment Behavior .............................. 75 . •‧. 9.2.2 Multiple Link Predictors Can Be Used to Gain Deeper and Broader Insight to the Network .. 76 . y. Nat. sit. 9.2.3 Rules of thumb of when Investors will invest in Companies. ................................................... 76 . n. al. er. io. 9.3 Vision for the future ......................................................................................................................... 77 . i n U. v. 9.3.1 Network Evolution of Investors ................................................................................................ 77 . Ch. engchi. 9.3.2 Application of Results to China’s Startup Environment ........................................................... 79 Reference .................................................................................................................................................. 81 . iv.
(9) LIST OF FIGURES FIGURE 1.1: ORGANIZATIONAL DESIGN AND INFORMATION SYSTEMS DESIGN ACTIVITIES (ADAPTED FROM J. HENDERSON AND N. VENKATRAMAN, STRATEGIC ALIGNMENT: LEVERAGING INFORMATION TECHNOLOGY FOR TRANSFORMING ORGANIZATIONS, IBM SYSTEMS JOURNAL (32:1), 1993.) ................................................................................................. 3 FIGURE 1.2: INFORMATION SYSTEMS RESEARCH FRAMEWORK ................................................................................................. 5 FIGURE 3.1: A SIMPLE SERVICE MACHINE IS A HYBRID OF STS AND SSME ............................................................................... 13 FIGURE 3.2: THE V+ PLATFORM ................................................................................................................................................ 14 FIGURE 4.1: SYSTEM ARCHITECTURE AND COMPONENTS FOR EXPERIMENT .......................................................................... 18 FIGURE 4.2: A PARTIAL SCREENSHOT ROM CRUNCHBASE SHOWING FACEBOOK’S COMPANY PROFILE ................................. 21 FIGURE 4.3: FACEBOOK’S NETWORK ......................................................................................................................................... 22 FIGURE 4.4: FACEBOOK’S SOCIAL GRAPH ................................................................................................................................. 25 FIGURE 4.5: FACEBOOK’S INVESTMENT GRAPH ........................................................................................................................ 26 . 政 治 大. FIGURE 4.5: NETWORK VISUALIZATION OF COMPANIES, PEOPLE AND FINANCIAL ORGANIZATIONS. .................................... 29 FIGURE 4.6: SHORTEST PATH VERSUS INVESTMENT COUNT .................................................................................................... 30 . 立立. FIGURE 4.7: FUNDING ROUNDS OF INVESTORS AND COMPANIES WHEN SHORTEST PATH IS DOES NOT EXIST BETWEEN . •‧ 國. ㈻㊫學. THEM ............................................................................................................................................................................... 32 FIGURE 4.8: OCCURRENCE OF INVESTMENTS IN VARIOUS INDUSTRIES WHERE SHORTEST PATH IS NULL .............................. 32 FIGURE 4.9: ADAMIC/ADAR ...................................................................................................................................................... 33 . •‧. FIGURE 4.10: OCCURRENCE OF INVESTMENTS WHEN ADAMIC/ADAR SCORE IS ZERO ............................................................ 34 . y. Nat. FIGURE 4.11: OCCURRENCE OF INVESTMENTS IN VARIOUS INDUSTRIES WHEN ADAMIC/ADAR SCORE IS ZERO. ................... 35 . sit. FIGURE 4.12: CORRELATION BETWEEN JACCARD COEFFICIENT AND INVESTMENT COUNT .................................................... 36 . er. io. FIGURE 4.13: OCCURRENCE OF INVESTMENTS WHEN JACCARD COEFFICIENT IS ZERO ........................................................... 37 FIGURE 4.14: OCCURRENCE OF INVESTMENTS IN VARIOUS INDUSTRIES WHEN JACCARD COEFFICIENT SCORE IS ZERO ........ 37 . n. al. i n U. v. FIGURE 4.15: COMMON NEIGHBORS VERSUS INVESTMENT OCCURRENCES ........................................................................... 38 . Ch. engchi. FIGURE 4.16: PREFERENTIAL ATTACHMENT VERSUS INVESTMENT OCCURRENCES ................................................................. 39 FIGURE 4.17: RELATIONSHIP BETWEEN NUMBER OF SHORTEST PATHS AND OCCURRENCES OF INVESTMENTS .................... 40 FIGURE 4.18: DIAGRAMMATIC REPRESENTATION OF A NETWORK CONTAINING INVESTORS AND COMPANIES .................... 42 FIGURE 5.1. AREA UNDER CURVE (AGGREGATE). ..................................................................................................................... 48 FIGURE 5.2. TRUE POSITIVE RATE (AGGREGATE) ...................................................................................................................... 49 FIGURE 5.3. FALSE POSITIVE RATE ( AGGREGATE ) ................................................................................................................... 49 FIGURE 5.4. AREA UNDER CURVE BY CATEGORIES. .................................................................................................................. 51 FIGURE 5.5. TRUE POSITIVE RATES BY CATEGORIES. ................................................................................................................ 51 FIGURE 5.6. FALSE POSITIVE RATES BY CATEGORIES. ................................................................................................................ 52 . v.
(10) WE SEE NAÏVE BAYES PERFORMING BETTER THAN DECISION TREES AND SVM IN TERMS OF FPR, BUT UNDERPERFORMS AGAINST DECISION TREES AND SVM IN TERMS OF TPR. INTERESTINGLY ENOUGH, NAÏVE BAYES OUTPERFORMS BOTH DECISION TREES AND SVM IN TERMS OF AUC ACROSS VARIOUS CATEGORIES. ............................................................. 52 FIG 5.7: VISUALIZING THE DECISION PROCESS .......................................................................................................................... 55 FIGURE 6.1: AREA UNDER CURVE FOR AGGREGATE EXPERIMENT ........................................................................................... 57 FIGURE 6.2: TRUE POSITIVE RATE FOR AGGREGATE EXPERIMENTS ......................................................................................... 57 FIGURE 6.3: FALSE POSITIVE RATE FOR AGGREGATE EXPERIMENTS ........................................................................................ 58 FIGURE 6.4: AREA UNDER CURVE FOR INDUSTRY PERFORMANCE ........................................................................................... 59 FIGURE 6.5: TRUE POSITIVE RATES FOR CATEGORIES ............................................................................................................... 60 FIGURE 6.6: FALSE POSITIVE RATES FOR CATEGORIES .............................................................................................................. 61 FIGURE 7.1. NUMBER OF EXAMPLES FOR EACH CATEGORY. .................................................................................................... 65 . . 65 . FIGURE 8.1: SYSTEM ARCHITECTURE OF CAPITAL+ ................................................................................................................... 66 . 政 治 大. FIGURE 8.2: HOME SCREEN OF CAPITAL PLUS .......................................................................................................................... 68 . 立立. FIGURE 8.3: INTERACTIVE HELPER TO LET END USERS KNOW WHAT TO TYPE ......................................................................... 69 FIGURE 8.4: A WAITING SCREEN FOR BUILDING NETWORK DIAGRAMS ................................................................................... 70 . ㈻㊫學. •‧ 國. FIGURE 8.5: A NETWORK DIAGRAM THAT SHOWS THE CONNECTION BETWEEN GOLDMAN SACHS AND FACEBOOK ............ 70 FIGURE 8.6: ERROR MESSAGE ................................................................................................................................................... 71 . •‧. FIGURE 8.7: GOLDMAN SACHS IS RECOMMENDED IF WE ARE VIEWING FROM FACEBOOK’S POINT OF VIEW. ...................... 72 FIGURE 8.8: FINDING A LIST OF COMPANIES TO INVEST IMPERSONATING AS GOLDMAN SACHS ........................................... 73 . n. al. er. io. sit. y. Nat. FIGURE 8.9: VISUALIZING THE CONNECTIONS BETWEEN INVESTORS AND COMPANIES .......................................................... 74 . Ch. engchi. vi. i n U. v.
(11) CHAPTER 1: INTRODUCTION 1.1 Introduction With Facebook’s IPO fresh in our minds and strings of startups, startup incubators popping up in Silicon Valley and around the globe, many entrepreneurs will have come across the act of raising funds from investors. Such behavior is not limited to startups: small medium enterprises or even large companies seek external investments as a way to enhance cashflow or meet various business objectives. While the topic of funding is one of the most widely discussed topics in the realm of investing, business and entrepreneurship, there are limited studies that provide evidence as to how companies can raise. 政 治 大 funding from investors is to understand what investors are looking for, that is factors that affect 立立 investing behavior.. funds from investors. One way to understand how companies can increase their chances of receiving. •‧ 國. ㈻㊫學. There are many studies (Barnea et al.,2011;Tan, et al 2011;Doran et al 2010;Bakker et al 2010,Giot et al. •‧. 2011; Grinblatt et al 2000) that seek to understand investment behavior. Factors such a psychological, geographic differences, investment experiences and even genetic have been proposed as what spurs. Nat. sit. n. al. er. io. and companies.. y. investments. However, most research fails to consider the role of social relationship between investors. i n U. v. We believe that social relationship is an important factor that affects investment behavior. Take for. Ch. engchi. example the idea of homophily (McPherson et al., 2001), where “birds of a feather flock together”: individuals tend to associate and bond together with others due to similarities. Such social relations are likely found within our small world (Backstrom et al, 2011, Travers et al., 1969) via weak ties (Granovetter 1973). Will social relationships translate into investments? Our research suggests that social relationships do translate into investments. Our main hypothesis is that investors have a tendency to invest in companies that have similar social relationships with. In general, the greater the similarity in terms of social relationship, the more likely the investor will invest in that particular company.. 1.
(12) In order to prove our hypothesis, we first perform descriptive statistical analysis on the CrunchBase dataset, after which we create a predictive model that builds on top of our descriptive statistical analysis experiments that sought to predict if an investor will invest an a company based on social relationships.. 1.2 Contribution to Literature Our contributions to the literature are as follows:. 1.2.1 Modeling prediction of investment behavior as a link prediction problem We build a social network using data from Crunchbase4, the largest public database with profiles about companies, individuals and financial organizations. Using this social network, we attempt to predict if. 政 治 大. an Investor will invest in a Company through their social relationship. To the best of our knowledge, our. 立立. work is amongst the first to model investment behavior as a link prediction problem.. •‧ 國. ㈻㊫學. 1.2.2 Combining multiple link prediction techniques to gain greater insight of social. •‧. networks. y. Nat. Various link prediction techniques such as Common Neighbors, Shortest Path, Jaccard Coefficient and. sit. others provide useful insights as to how a pair of nodes may be related within a social network.. er. io. Nonetheless, each technique only reveals certain aspect of a social network: for example Common. al. n. v i n C h of hops between while Shortest Path measures the shortest number e n g c h i U two nodes in a social network. We Neighbors measure the number of neighbors that are common between two nodes in a social network believe that combining multiple approaches will provide us with a holistic view of a social network.. 4. CrunchBase – http://www.crunchbase.com. 2.
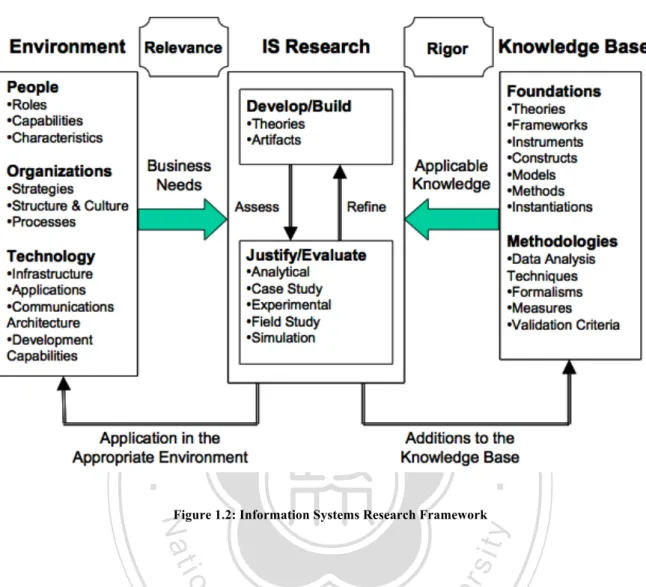
(13) Marriage of social network analysis with investing behavior: We explore how similarity between investors and companies affect investing behavior through social network analysis. Also, our work is amongst the first to use data from CrunchBase as a social network for research purposes.. 1.2.3 Providing general rules of thumb for companies seeking investment Our recommendations for companies seeking investment are based on intuitive and common similarity measures to show where companies can find potential investors within their social network. Using these general rules, we hope to increase companies’ chances of getting funded from investors.. 1.3 Research Structure. 政 治 大. The thesis is structured based on ideas summarized by Alan, Salvatore, Jinsoo, and Sudha on 2004 et al. 立立. in 2004 as shown in Figure 1.1:. •‧. •‧ 國. ㈻㊫學. n. er. io. sit. y. Nat. al. Ch. engchi. i n U. v. Figure 1.1: Organizational Design and Information Systems Design Activities (Adapted from J. Henderson and N. Venkatraman, Strategic Alignment: Leveraging Information Technology for Transforming Organizations, IBM Systems Journal (32:1), 1993.). 3.
(14) For any IT systems to be useful, it must take into account of various factors, ranging from stakeholders, organizational structure, available IT systems architecture and strategy required to implement this system. In this research, we focus on reducing the market inefficiency cost of getting investors meet companies and vice versa; an IT artifact is a reasonable solution for this problem because an IT artifact cannot only scale up, but also scale down: companies, whether large or small will require external capital at some time or another. Large companies generally have little issues with securing external investments, but smaller companies such as startups not only have limited financial resources, they have limited manpower to seek external funding. Having an IT artifact, which allows access 24/7, provides a cheaper solution for companies, large and small.. 政 治 大 may span across geographic regions are likely sources of investees; an IT artifact will allow them 立立 effective access to potential investees. The same could be said for companies.. In addition, investors are no longer limited to their own geographic location; their social network which. •‧ 國. ㈻㊫學. Lastly, there are available algorithms and open source software to provide the required IT. •‧. implementation and recommendations; which points to the fact that the IT artifact can be implemented with current technologies.. y. Nat. sit. Going deeper into this research structure, we need a research framework for not only the implementation. n. al. er. io. of this IT artifact, but also provide strong theoretical foundations for this system:. Ch. engchi. 4. i n U. v.
(15) 立立. 政 治 大. •‧. •‧ 國. ㈻㊫學 er. io. sit. y. Nat. Figure 1.2: Information Systems Research Framework. al. v i n Cour first cover related literature pertaining to topic and h eresearch i U related state of art. In chapter 3, we h n c g briefly go through how this research work is part of a larger picture known as Prosperity Taiwan. In n. The research framework is also inspired by Alan, Salvatore, Jinsoo, and Sudha (2004): in chapter 2 we. Chapter 4, we focus on theoretical foundations on how we intend to solve the problem of predicting investments by modeling it based on the classic link prediction problem, where given a network at time0, we attempt to predict new links created at time1 where time1 represents a time in the future. In our network, we have 2 node types: Investor and Company. Next in chapter 5, we perform experiments and evaluate the effectiveness of our methods using classic metrics for machine learning problems: Area Under Curve, True Positive Rate and False Positive Rate. To further strengthen the evaluation aspect of this research, we verify our model using a different subset of our database; this is performed in chapter 6. In chapter 7, we focus on the reasoning on the use of social network features and our prediction models 5.
(16) varied performance. A walkthrough of the result IT artifact is shown in chapter 8. Finally, we summarize and conclude this research work with various possibilities of extending this research work.. 立立. 政 治 大. •‧. •‧ 國. ㈻㊫學. n. er. io. sit. y. Nat. al. Ch. engchi. 6. i n U. v.
(17) CHAPTER 2: RELATED WORK 2.1 Survey of Related Work We have two parts for related works since our research focuses on the use of social network analysis on investment behavior: previous research on investment behaviors and previous research on social network analysis.. 2.2 Related Research on Investment Behaviors Prior studies on investment behaviors can be categorized into 6 categories based on the type of factors that drive investment behaviors.. ㈻㊫學. •‧. 2.. 立立. Personal Opinions. Doran, Peterson and Wright (Doran et al., 2010) studied the role of personal opinions of finance professors on the efficiency of the stock market in the United States and found out that personal opinions do not affect investment behaviors. Rather, investment behaviors found in financial professors were largely driven by the same behavioral factor as amateur investors. Investment Experience. Gorat et al., 2011 analyzed the differences in the investment behaviors of experienced and novice private equity firms and found out that novice firms tend to invest more slowly than experienced funds but the size and value of the funding size of novice firms tend to be larger. Geographic Identities. Grinblatt et al., 2000 discovered that investment behaviors can be determined by the investors geographic identity: foreign investors in Finland tend to purchase past winning stocks and sell past losers. On the other hand, domestic investors sell past winning stocks and purchase losing stocks. Online versus Offline Communities. Tan et al., in 2011 explored the roles played by online and offline communities and discovered that offline communities are more influential over investing behaviors. This is expected since offline communities often mean that interaction are offline and hence more likely in person, thus increasing the level of influence. Psychology. Bakker et al., in 2010 on the other hand investigated into psychological factors that impact market evaluation and found out that trust and social influence affects the stability of investment markets. Genetics. Barnea et al in 2010 investigated the relationship between genetics and investment behavior by studying the investment behaviors of identical and fraternal twins. They discovered that “a genetic factor” explains up to a third of twins investing behavior, though not long lasting.. •‧ 國. 1.. 政 治 大. n. al. er. io. sit. y. Nat. 3.. 4.. 5.. 6.. Ch. engchi. 7. i n U. v.
(18) 2.3 Related Research on Social Network Analysis There are numerous studies on social network analysis. More importantly in recent years we begin to see the marriage of social network analysis with management science, computer science and other fields, giving rise to what most of us term as “social computing” or “network science”. Common social network analysis topics and its relevant techniques and applications are, but not limited to centrality analysis (Leskovec et al 2010), community detection (Girvan et al., 2010, Newman et al., 2006, Leskovec et al., 2007) link prediction label prediction (Gallagher et al., 2008, Kajdanowicz et al., 2010), information diffusion (Leskovec et al., 2007, Kempe et al., 2003 ) and team formation (Lappas et al., 2009, Kargae et al 2011).. 政 治 大 information networks, collaboration立立 networks, biological networks and social networks.. Other related work includes statistical features of networks (Nowell et al., 2007, Newman 2011) such as. •‧ 國. ㈻㊫學. The similarities of the above applications is that the use of social network analysis techniques often improve the performance of the solution for the given problem domain. We often see the use of. •‧. algorithms or similarity measures ranging from Common Neighbors, shortest paths, Katz, PageRank,. sit. y. Nat. Jaccard Coefficient, Adamic/Adar etc or its variants to help provide measures.. er. io. Link prediction is one of the most important topics in social network analysis. Link prediction seeks to predict the changes in terms of edges or nodes of social networks over time. Link prediction in social. n. al. Ch. i n U. v. networks can be problematic: Nowell and Kleinberg performed extensive studies on link prediction in. engchi. social networks and noted that there is no singular technique that can ensure the best performance. In fact, the techniques used shows limited performance. The techniques used for link prediction include PageRank (Page et al 1998), HITS (Kleinberg 1998), Adamic/Adar Adamic et al., 2001), Jaccard Coefficient, shortest paths etc. Moreover, Nowell and Kleinberg proposed that performance may be improved by taking into account of node-specific information. More recently, link prediction has been applied to datasets in popular social networks, which includes Twitter, Facebook and others as covered by Leskovec, Huttenlocher, Krause, Guestrin and Falousos (2007, 2010) and Fire, Puzis and Elovici in 2011. These studies include the prediction of positive and negative links to recommending friends on Facebook to using computationally efficient topologic features. 8.
(19) 2.4 Other Related Research Guang, Zheng, Wen, Hong, Rose and Liu (Xiang et al., 2012) performed studies using the CrunchBase dataset and predicted company acquisition with factual and topic features using profiles and news articles on TechCrunch. Although they made use of a similar dataset as our work, their work did not make use of social relations as part of their feature set and focused on a different domain of mergers and acquisitions. In particular, they made use of node information, such as age of company, number of financing rounds and categories in addition to news articles related to mergers and acquisitions to build machine learning features. On the other hand, this research makes use of social relationships, represented by social network features to predict the act of investments; mergers and acquisitions are not covered in my work.. 政 治 大. 2.5 Link Prediction as a Model to Predict Investor Behavior. 立立. •‧ 國. ㈻㊫學. The originality of this paper is that we propose the use of social relationship as the main feature to predict if investments will occur. For example, given an Investor and a Company, can we predict if the. •‧. Investor will invest in that particular Company just by understanding their social relationships? We believe that this will be a much easier approach for companies seeking investments since they are more. sit. y. Nat. likely to understand their social relations with potential investors.. n. al. er. io. We opted to use link prediction as a way to model investor behavior instead of other social network analysis methods due to the following reasons:. Ch. engchi. i n U. v. 1. We find that link prediction suits our problem as it sought to predict new links within a social network as time progresses. This is very similar to how investors and start-up investing operate: as time progresses, will new links (investments) occur between different pairs of investors and companies. Link prediction usually focuses on addition of link and do not take into account of removal of links, which suits our problem perfectly: we hardly see an investor pull off their investment after an investment is made into a company. 2. Link prediction allows us to input different characteristics of individual entities, which also reflects reality of investment behaviors and transactions: investors and companies both reflect different characteristics in terms of relationships and node information, both of which can be 9.
(20) readily reflected using network structures (such as “closeness” using shortest paths and similarity using Jaccard Coefficient) and investor/company information such as age and industries. 3. In addition and as pointed out by Kleinberg and Nowell, prediction models that uses only a singular metric (such as common neighbors only) yield less than satisfactory results; by taking into account different metrics (shortest paths, Jaccard Coefficient, common neighbors, adamic/adar, preferential attachment and number of shortest paths) we can derive a more complete perspective of the network we are dealing with.. 立立. 政 治 大. •‧. •‧ 國. ㈻㊫學. n. er. io. sit. y. Nat. al. Ch. engchi. 10. i n U. v.
(21) CHAPTER 3: PROSPERITY TAIWAN 3.1. Prosperity Taiwan Project Backgroud. My research work is part of a larger research project dubbed “Prosperity Taiwan”. The main goal of “Prosperity Taiwan” is to create a set of IT-enabled policies and workflows that aids Taiwan’s economic transformation. My thesis represents the area of financing: helping companies gather investment and or helping investors find suitable companies to invest.. 3.2 Taiwan’s Economic Strengths and Current Economic Landscape. 治 政 大 economic strength stems from its maintaining at a growth rate excess of 7% per year. Taiwan’s 立立 manufacturing capabilities, especially in terms of information technology related products. Bulk of As one of the Four Asian Tigers, Taiwan’s economic growth from 1960s to 1990s has been exceptional,. •‧ 國. ㈻㊫學. Taiwan’s business comes from building and manufacturing white-label products that is later branded with American or European brands. However, Taiwan’s greatest economic strength turns out to be its. •‧. biggest liability in recent years due to changes in the global economic landscape.. sit. y. Nat. The present global economic landscape presents several challenges for the Taiwanese economy: increase in cheaper manufacturing alternatives such as manufacturers from China or Brazil. This leads to. io. n. al. er. increased price competition, severely cutting profit margins for Taiwanese manufacturers. There is also. i n U. v. an increased premium placed on brand recognition and intellectual property; despite Taiwanese’s. Ch. engchi. manufacturing prowess when it comes to building world class hardware such as iPhone, iPods and other globally recognized devices, Taiwanese manufacturers often receive up to only 3 to 5% of the profit share of each device sold. This is because the Taiwanese manufacturers do not own the brand and or intellectual property of the device. In response to the above challenges, the Taiwanese government highlighted several industries poised for growth including medical services, bio-technology, green energy, culture/arts/creativity and high technology agricultural.. 11.
(22) 3.3 The “Prosperity” in Prosperity Taiwan Prosperity comes in various forms. While most people associate “Prosperity” with material wealth, we are interested in creating all-round prosperity. They are namely: Material Prosperity, Spiritual Prosperity, Physical Prosperity and Social Prosperity.. 3.4 Vision of Prosperity Taiwan The vision for Prosperity Taiwan is to create sustainability in economic development by moving up the value chain. The five major goals are as follows:. 政 治 大. 1. Enhance university-industrial cooperation. 2. Kick start Taiwan’s economic transformation by creating “industrial modules”. 立立. 3. Create a model for industry transformation. •‧ 國. 5. Internationalize based on successful industrial transformation. ㈻㊫學. 4. Start small, go big. er. io. sit. y. •‧. Nat. 3.5 Culture, Arts and Creativity as an Example. al. n. v i n C hsweet spot due toUTaiwan’s unique heritage and mix of that the culture/arts/creativity is Taiwan’s engchi For a start, Prosperity Taiwan focuses on the culture/arts/creativity industry. The research team believes. Chinese and Western influences. We also believe that this group of people and its related stakeholders will benefit most from our research work. We find that the following characteristics define the culture, arts and creativity industry: •. Not limited liability or private limited companies. •. They have limited ability to scale its production capabilities. •. Typically lack financial support or lack knowledge on funding options. 12.
(23) •. Business owners are at best conservative regarding the growth prospects of the culture and arts. On an industry level, the market exhibits the following characteristics: •. Market lacks a system for evaluating intangible assets. •. Industry lacks interdisciplinary talent. •. Lack of financial support or lack transparency in terms of funding options. •. The industry lacks economies of scale to support growth. •. Multiple stakeholders with political, economical, social and environmental objectives.. To combat the above issues, we propose the use of intelligent service machines to aid industry transformation.. 立立. 政 治 大. •‧ 國. ㈻㊫學. 3.5 Intelligent Service Machines to aid Economic Transformation Intelligent Service Machine(s) (Tung and Yuan, 2010) refers to an intelligent design of the service. •‧. machine featuring the embodied cognition of co-production in terms of modeling and automating the. y. Nat. cognitive process and knowledge representations as required. Conceptually, a simple service machine is. n. al. er. io. and automating service processes.. sit. a socio-technical system (STS) that comprises of people, model, architecture, technologies for modeling. Ch. engchi. i n U. v. Figure 3.1: A simple service machine is a hybrid of STS and SSME. 13.
(24) 3.5.1 The V+ Platform The V+ platform (Figure 3.2) is an intelligent service machine that comprises of 5 simple service engines aimed at solving problems of industry transformation as exemplified in the independent movie makers and the industry as a whole.. 立立. 政 治 大. Figure 3.2: The V+ Platform. •‧ 國. ㈻㊫學. On a macro-level, we have Capital+ forming the base of the V+ platform, since every stage of a product. •‧. life cycle in various industries will most likely involve some form of funding activities. On top of Capital+. Next, we have Discover+ which helps businesses discover new insights, which can be further. sit. y. Nat. strengthened or extended by the design insight patterns recommended by Design Intelligence+. Finally, Sourcing+ can readily translate design insights into market opportunities by bringing about various. io. n. al. er. operant resources from possible stakeholders in an industry under a holistic system thinking view.. i n U. v. Finally, Intellectual Property (IP+) comes into play by ensuring that proper IP strategies can be formed. Ch. engchi. based on the operant resources identified in Sourcing+. On a micro-level, each engine works as such: •. Capital+ - designed to solve the problem of funding and investment on an individual level and the industry as a whole. It provides a prediction model for individuals to estimate which investor(s) has a higher possibility of funding them. In addition, Capital+ seeks to provide personalized updates to an entity’s small world; changes to investors, companies or persons that might be of interest to the requestor of information. It also provides recommendations to investors looking for potential companies to invest in and vice versa. 14.
(25) •. Discover+ - an IT-artifact with common sense knowledge aimed to facilitate design insight discovery process. The common sense knowledge in this engine is powered by ConceptNet. Discover+ is targeted at assisting novice and enterprise designers with only the goods-dominant logic mindsets.. •. Design Intelligence+ - is developing the framework and method to externalize, formalize and facilitate “insight combination” that is a process of discovering connection between “insights” and “design patterns” and combining them to generate idea or inspiration for service design.. •. Sourcing+ - a service machine targeted at Small and Medium Sized enterprises (SMEs) to enable them to discover niche markets as stipulated in the Long Tail Theory when given design insights. Sourcing+ is also an IT-enabled system that exploits open new operant sources from various stakeholders to provide discovery of market opportunities found in the Long Tail.. 政 治 大 up the value chain either through forging alliances or as a litigation/patent strategy according to 立立 the identified operant resources by Sourcing+. It provides a framework based on value network Intellectual Property+- aims at fostering the use of intellectual property as a means for moving. ㈻㊫學. •‧ 國. •. that help companies to pursue, manage and maneuver their IP strategy.. •‧. V+ platform is designed to act as a generic service engine that can be applied to most situations. For. y. Nat. n. al. er. io. applied in the next section.. sit. simplicity and demonstration sake, we explain an application scenario of how V+ platform can be. Ch. 3.5.1.1 Application Scenario of V+ platform . engchi. i n U. v. Consider the various issues ranging from political, economical, environmental and social factors when a company or business sets up a factory in a less developed region. Very often, the company may face protests from local residents or even local governments due to concerns over environmental pollution, negative impact on way of life of local residents or even adverse effect on the local economy. The V+ platform works by helping various stakeholders search and suggest possible solutions to this problem. Let us assume that the agreed solution is to create a museum to educate the general public on environmental protection.. 15.
(26) In this scenario, we are expecting multiple stakeholders and not all funding for building the museum will come from the company. Therefore, V+ platform can help to source for multiple investors based on the stakeholders involved. This can happen at various stages of the construction of the museum. The main engine used for sourcing investment is done via Capital+. Discover+ creates new insights based on the stakeholders’ objectives. These stakeholders include the local residents, governments, potential visitors to the museum and the company involved. After gathering the stakeholders’ requirements, these requirements are used as inputs for the Discover+ engine, where new and potential insights maybe created for framing and reframing process. Such information is useful for museum designers or related service designers. The output of Discover+ is then used as an input for Sourcing+. Design Intelligence+ then helps elevate the insights to foster the degree of impacts. 政 治 大. in terms of the scalability of stakeholders involved or the service values incurred.. 立立. Sourcing+ analyzes the insights provided by Discover+ and maps out possible required market. •‧ 國. ㈻㊫學. intelligence and or related trends. For example, what can one expect from a museum? What form of services, artifacts, displays, etc. can one expect from a museum given various stakeholders? Sourcing+ helps answer these questions by integrating current trends and expectations, such as screening. •‧. documentaries or educational movies on environmental protection, interactive learning for children and. y. Nat. so on as inputs for market sensing. The market sensing capabilities of Sourcing+ then facilitates research. er. io. sit. between various stakeholders and generates possible answers to aforementioned questions.. al. v i n C h resources identified the overall patent value based on the operant e n g c h i U by Sourcing+. Take for instance, the n. Intellectual Property+ adds support to our scenario by providing IT-enabled support for understanding. museum might be interested in deploying an operant resource of interactive TV. The related technologies and hence patents may be related to such as those used in Microsoft’s Kinect. Such knowledge will help potential implementation avoid litigation and hence pave the overall patent/litigation strategy.. 16.
(27) CHAPTER 4: METHOLOGY 4.1. Methodology. While various factors have been proposed for explaining investing behaviors, little or no studies have incorporated the use of social network analysis of investment behaviors. Our intuition is that investing is an act based on social relationships, be it personal or professional. We propose that investors are more likely to invest in a company where they are of greater similarity in a social network context. The notion of similarity between two vertices in a social network has been studied extensively, more notably in the area of social sciences. Algorithms and methodologies have also been developed to measure similarity.. 治 政 similarities of Investors and Companies within a social network.大 As such, we propose that Investors are 立立 they are of greater similarity in a social network context. more likely to invest in Companies when. For the purposes of our research, we use the measures covered in Section II extensively to compute the. •‧ 國. ㈻㊫學. Here’s a diagrammatic illustration of system architecture and components for the research:. •‧. n. er. io. sit. y. Nat. al. Ch. engchi. 17. i n U. v.
(28) Collect Data CrunchBase CrunchBase Dataset Results of Pairwise comparison of Investors and Companies MongoDB Servers. Construct Social and Investment Graph. 立立. Compute Relationship. 政 治 大. Social and Investment Graphs. •‧ 國. ㈻㊫學. Amazon EC2 Servers. •‧. Figure 4.1: System Architecture and Components for Experiment. sit. y. Nat. io. n. al. er. The architecture works as such:. i n U. v. 1. Data is first collected from CrunchBase via its API (Application Programming Interface) in the Collect Data component.. Ch. engchi. 2. The data collected from 1 is stored into the Datastore, which is based on MongoDB5 and running on top of Amazon EC26. 5 6. MongoDB – http://www.mongodb.org Amazon EC2 - http://aws.amazon.com/ec2/. 18.
(29) 3. A network representation of Investors and Companies are constructed by the Construct Social and Investment Graph component: a. The network is a graph representation that takes into consideration of Investors, Companies, social relationships and investment relationships. b. The network is passed to the Compute Relationship component of the architecture. 4. The Compute Relationship component receives the network from 3 and performs pairwise comparison between every pair of Investor and Company: a. The following scores are computed between each pair of Investor and Company: i. Shortest Path – we believe that Investor’s will be more likely to invest in a Company if there are less hops between them ii. Jaccard Coefficient – we believe that Investors are more likely to invest in a. 治 政 大greater weight to rarer features, we Adamic/Adar – although Adamic/Adar gives 立立 believe that the idea that Investors are more likely to invest in a Company that are of Company if there are of greater similarity. iii.. •‧ 國. ㈻㊫學. greater similarity still holds.. iv. Common Neighbor – Investors are more likely to invest in a Company if they have. •‧. more common neighbors between them. v. Preferential Attachment – Preferential Attachment states that the “Rich get richer”.. Nat. sit. y. Similarly as a Company becomes more popular in terms of receiving investments,. er. io. such companies are more likely to receive preferential treatment from investors. vi. Number of shortest paths between each pair of Investor and Company – we. n. al. Ch. i n U. v. hypothesize that if there are more shortest paths connecting an Investor and a. engchi. Company, the investor is more likely to invest in that company ? b. The Compute Relationship component is based on various Python scripts running on top of Amazon EC2 that processes the network and computes the required score. 5. The result of every pairwise comparison from 4a is stored into the Collect Data component of the architecture.. 19.
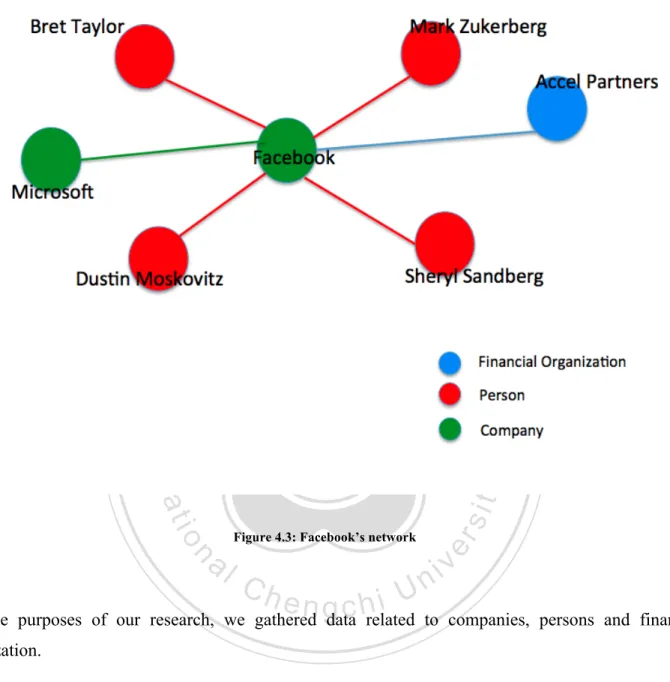
(30) 4.2 Dataset 4.2.1 CrunchBase Dataset The CrunchBase dataset is a TechCrunch’s open database with information about startups, investors, trends, milestones, companies etc. and it relies on the web community to edit most of its pages. It consists of a rich source of companies, people, and financial organization information of the technology world in the United States. As of 1st April 2012, the profiles found at CrunchBase consisted of 86,224 companies, 114,406 persons, 7600 financial organizations, 4,171 service providers, 27,290 funding rounds and 6453 acquisitions.. 治 政 copy of the data in February 2012, which consisted of about 95% 大 of the dataset compared to 1 立立 2012.. The CrunchBase dataset allows public access of its data via a JSON API, and we’ve collected a local st. April. •‧ 國. ㈻㊫學. While it may not be obvious, the CrunchBase dataset represents a rich multi-modal social network of investors and companies. For instance, each company shows a list of people who are currently (or. •‧. previously worked) for a company; drilling further we get to see the person’s profile which states his list. y. Nat. of companies (or financial organizations) which is involved in. An example shown here is Facebook’s. n. al. er. io. sit. company profile on CrunchBase:. Ch. engchi. 20. i n U. v.
(31) 立立. 政 治 大. •‧. •‧ 國. ㈻㊫學. n. er. io. sit. y. Nat. al. Ch. engchi. i n U. v. Figure 4.2: A Partial Screenshot rom CrunchBase showing Facebook’s Company Profile. In addition, here’s a small sampling of Facebook’s network:. 21.
(32) 立立. 政 治 大. •‧. •‧ 國. ㈻㊫學. n. engchi. er. io. Ch. sit. y. Nat. al. Figure 4.3: Facebook’s network. i n U. v. For the purposes of our research, we gathered data related to companies, persons and financial organization.. 4.2.2 Data Selection Since we are interested in the investing behaviors of investors within a small world context, without loss of generalization we chose Facebook as the seed node, and gathered People, Companies and Financial Organizations found within its social, funding and investment relationships within 4 degrees of separation from Facebook. 22.
(33) We selected Facebook as the seed node due to the company’s meteoric rise in the social network industry and its recent IPO. We chose 4 degrees of separation as a cutoff point as opposed to 6 degrees of separation due to the fact that recent advances in technology has somewhat reduced the degrees of separation between people as shown in (Backstromet al., 2011). In addition, there are limits to the “Horizon of Observability” (Friedkin et al., 1981) from the viewpoint of using Facebook as a seed node. The strategy of selecting Facebook as a seed node stems from the following reasons: •. As discovered by Backstromet (2011), 4 hops can theoretically allow a node to reach any other node within a network. •. Since information about nodes reduces as the hops increases, it does not make any sense to gather more information regarding nodes that are over 4 degrees of separation; according to. 政 治 大. Friedkin (1981), awareness of neighbors drops to almost 0% when the degree of separation hits 4. 立立. hops.. Since our assumption is that CrunchBase is a social network, a dataset of up to 4 degrees of. •‧ 國. ㈻㊫學. •. separation given any seednode is representative of CrunchBase.. As shown in the verification section of this research, we used the same strategy of selecting a. •‧. •. single seed node and fan out by up to 4 degrees of separation and repeated the experiment with. sit. y. Nat. comparable results.. al. n. separation from Facebook.. er. io. We identified 11916 companies, 1122 financial organizations and 12127 people within 4 degrees of. Ch. engchi. i n U. v. 4.3 Concepts, Definitions and Examples 4.3.1 People. People refer to founders, executives and other persons working for a particular company or organizations. Examples from our dataset include Mark Zuckerberg of Facebook and Peter Thiel formerly from PayPal and an early financial backer of Facebook .. 23.
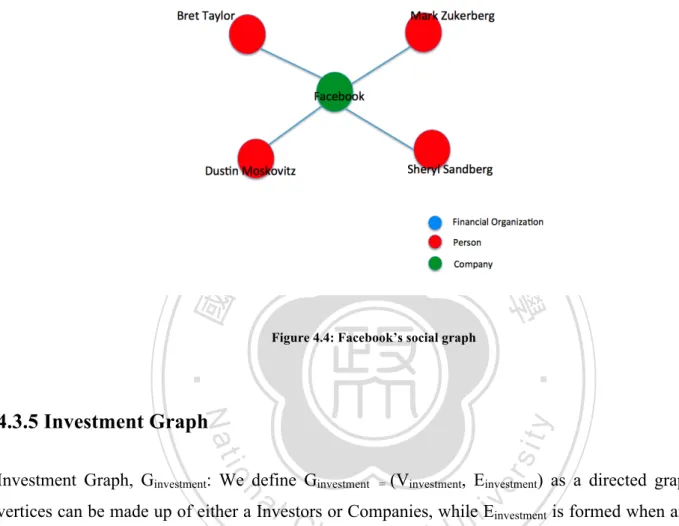
(34) 4.3.2 Companies Some examples of Companies include Google, Facebook and Microsoft.. 4.3.3 Financial Organization Financial Organizations are organizations that typically perform the act of investment on Companies. Prominent examples in our dataset include Accel Partners7 (invested in prominent companies such as Facebook, Dropbox 8 , Groupon 9 Angry Birds 10 and more) and Digital Sky Technologies 11 (an international investment firm focused solely on the Internet sector and also invested in Facebook and Groupon).. 4.3.4 Investors. 立立. 政 治 大. Investors consist of People, Companies and Financial Organizations. This is due to duality of roles. •‧ 國. ㈻㊫學. played by People, Companies and Financial Organizations in the CrunchBase dataset. For example, companies like Microsoft plays the role of a Company yet performed an act of investment on other. •‧. companies such as Facebook in the early days. Similarly, Peter Thiel is a Person entity, yet invested in. y. sit. n. al. er. io. 4.3.5 Social Graph. Nat. Facebook.. Ch. i n U. v. Social Graph Gsocial: We define Gsocial = (Vocial, Esocial) as a undirected graph, where vertices can be made. engchi. up of either a People, Companies or Financial Organizations, while Esocial is formed when a particular. 7. http://www.accel.com/. 8. https://www.dropbox.com/home. 9. http://www.groupon.com/. 10. http://www.angrybirds.com/. 11. http://dst-global.com/. 24.
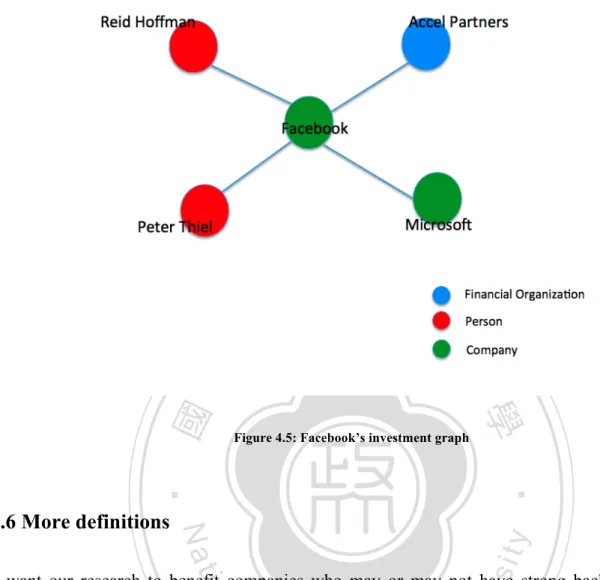
(35) Person has a relationship ( such as employment ) with a Company or Financial Organization. There are 1152 people, 922 financial organizations and 7745 companies found in the social graph. A small example of a social graph can be seen in the next figure:. 立立. 政 治 大. •‧ 國. ㈻㊫學 Figure 4.4: Facebook’s social graph. •‧. Investment Graph, Ginvestment: We define Ginvestment. =. (Vinvestment, Einvestment) as a directed graph, where. er. io. sit. y. Nat. 4.3.5 Investment Graph. n. al v vertices can be made up of either a Investors or Companies, while Ei is formed when an Investor n Ch U invests in a particular Company. There aree11756 h i 6634 financial organizations and 756 n g cpeople, investment. companies found in the investment graph. Take note that there are overlap between entities found in the social graph and the investment graph. An example of an investment graph of Facebook is shown below:. 25.
(36) •‧ sit. y. Nat. 4.3.6 More definitions. Figure 4.5: Facebook’s investment graph. ㈻㊫學. •‧ 國. 立立. 政 治 大. er. io. We want our research to benefit companies who may or may not have strong background in social. al. v i n paths, C Adamic/Adar, Coefficient, h e n g c Jaccard hi U. n. network analysis. Hence, we selected the following 5 methods for our analysis due to its simplicity and ease of understanding: shortest. Common Neighbors and. Preferential Attachment. We initially conducted experiments on GSocial and GInvestment based on the metrics such as number of edges, nodes and number of triads in order to compare the graphs on a global scale, but we find that the metrics provided limited information as to how social relationships can affect investments. Therefore, we chose to use graph distance (shortest paths) and methods based on node neighborhoods (Jaccard Coefficient, Adamic/Adar, Common Neighbors and Preferential Attachment) as it allows us to do a one-on-one comparisons between each Investor and Companies. We selected these metrics as each of these metrics represent an aspect of social relationship and hence allows us to build a predictive model: 26.
(37) •. Shortest paths represents “closeness” between 2 nodes. •. Common Neighbors, Jaccard Coeffecient and Adamic/Adar represents neighborhood similarity; will investors invest in companies based on homophily. •. Preferential Attachment demonstrates the social phenomena of “rich get richer”; do companies that received more investments prior result in getting more investments from investors?. In addition, since we are interested in the small world of investing behaviors, methods based on node neighborhoods should provide us with insights as to how social similarity can affect investment behavior. All methods used for our analysis assign a score (x, y) to pairs of nodes <x, y>, based on the input graph Gsocial. Nodes X and Y are defined as follows: Node X represents Investor, while node Y denotes Company.. 政 治 大. This is because we want to compare the similarities of Investors and Companies for the purposes for our. 立立. research. No comparisons are made when node X equals node Y. We define the set of neighbors of node. •‧ 國. .. ㈻㊫學. x to be. In general, the greater the similarity based on the scores, the greater the likelihood of investment. The. •‧. algorithms used for comparing similarities are as follows:. y. Nat. sit. n. al. er. io. 1. Shortest Path. We simply consider the shortest path between Investors and Companies. The general intuition is that the “closer” Investors are to Companies (and vice-versa) the more likely that Investors will invest in such Companies. We define score (x, y) to be the length of the shortest path between an Investor and a Company, where x represents an Investor while y represents a Company. 2. Adamic/Adar. Adamic and Adar in 2001considered similarity between two personal homepages by computing features of the pages and defining the similarity between two pages to be:. Ch. engchi. i n U. v. where we consider the similarity feature, z to be the common neighbors, while x represents Investor’s features while y represents a Company’s features. 3. Jaccard Coefficient. The Jaccard Coefficient measures the probability that both x and y have a feature f, for a randomly selected feature f that either x or y has. Here, we take f to be neighbors in Gsocial since we are interested in node neighborhood, leading us to the measure score : 4. Common Neighbors. It is considered as the most direct implementation. According to Newman (2012), the general intuition is that the number of common neighbors of node X and node Y has a correlation with the probability that they will collaborate in the future, under the context of a 27.
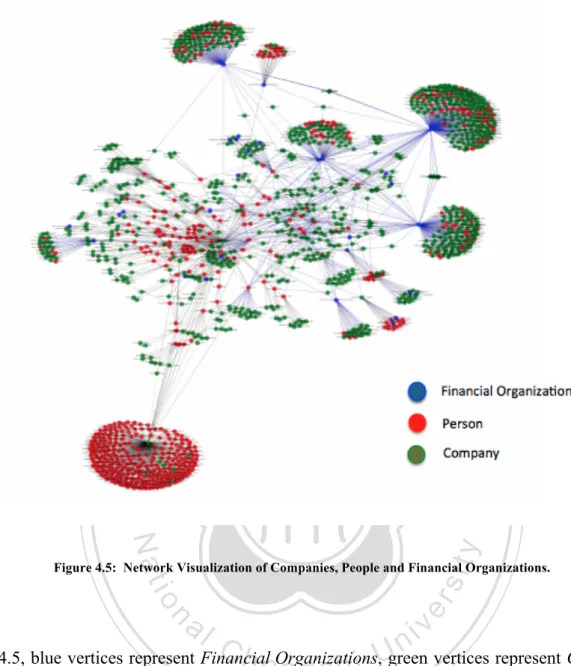
(38) collaboration network. The Score(x,y) for common neighbors is defined as follows: 5. Preferential Attachment. Preferential Attachment suggests that the probability that a new edge has node x as an endpoint is proportional to the current number of neighbors of x (Jeffrey and Milgram, 1969). In our use case, this models the “rich get richer” phenomena where companies which already received investments should receive even more investments as time progresses. The Score(x, y) for preferential attachment is defined as follows: We use these algorithms to compare each pair of Investor and Company node in the GSocial. For each pair, we take note of the score for each algorithm and mark if the Investor invested in the Company or not. 6. Number of Shortest Paths between Investor and Company. We calculate the shortest path between an Investor and a Company and aggregate the number of paths with the same shortest path score. A node may appear more than once amongst these paths. The intuition here is that an Investor is more likely to invest in a Company if there are more shortest paths connecting them. This is because more paths could mean that the Company or Investor is more easily reached via multiple shortest paths.. 政 治 大. 4.4 Social Behavior of Investors 立立 in Facebook’s Small World. •‧ 國. ㈻㊫學. In general, we believe that greater the similarity between an Investor and a Company the greater the likelihood that investments will occur. We attempted a visualization of a subset of the diagram and we. •‧. see that certain investors cluster companies that they have invested in based on their social relationships:. n. er. io. sit. y. Nat. al. Ch. engchi. 28. i n U. v.
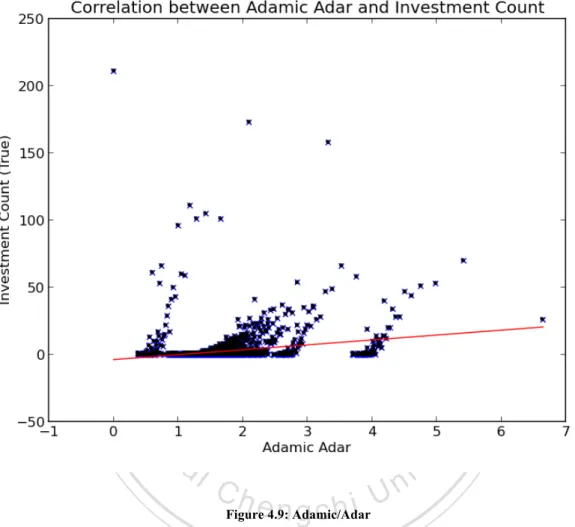
(39) 立立. 政 治 大. •‧. •‧ 國. ㈻㊫學 sit. y. Nat. io. er. Figure 4.5: Network Visualization of Companies, People and Financial Organizations.. al. n. v i n C h Organizations,Ugreen vertices represent Companies and In Figure 4.5, blue vertices represent Financial engchi. red vertices represent People. Blue edges represent Investment relationships while black edges represent social relationships. Visually, we can see clusters of social and investment relationships: social relationships are somewhat present where investment relationships are present. . 4.4.1 Understand Social Behavior using Descriptive Mining We performed descriptive data mining (Liang and Yuan, 2012) and our initial findings matched our intuition: the greater the similarity, the more investments are likely to occur. This is the case based on results using Shortest Path and Adamic/Adar. On the other hand, trends based on Common Neighbors, 29.
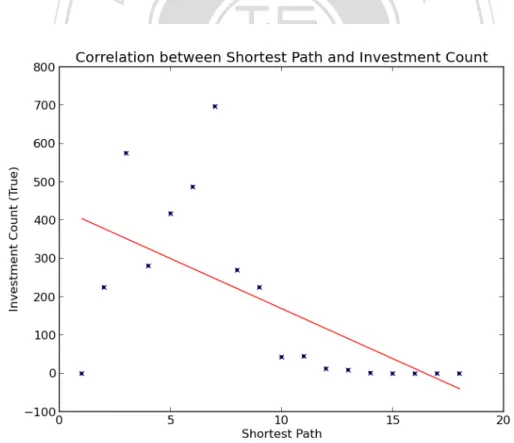
(40) Jaccard Coefficient and Preferential Attachment showed counter-intuitive results and we will offer explanations in the section that follow. We plot the data on a scatter-plot diagram with investment count as the y-axis and the relevant social feature as the x-axis. We also plot the best fit line (in red) to visually understand the general trend of investment and the various social features. The algorithms used for analysis are generally adapted from graph theories and social network analysis. The general intuition is that the greater the similarity between an Investor and a Company, the greater the likelihood that the Investor will invest in that particular Company.. 4.4.2 Shortest Path. 治 政 We find that 60% of the investments occurred at shortest path 大 lengths at 14 and below. Approximately 立立 49% of the investment occurred at Shortest Path length of 7 and below. In fact, no investment activities •‧. •‧ 國. ㈻㊫學. are found when the shortest path is greater than 14.. n. er. io. sit. y. Nat. al. Ch. engchi. i n U. v. Figure 4.6: Shortest Path versus Investment Count. 30.
數據
+7
相關文件
Since we use the Fourier transform in time to reduce our inverse source problem to identification of the initial data in the time-dependent Maxwell equations by data on the
To this end, we introduce a new discrepancy measure for assessing the dimensionality assumptions applicable to multidimensional (as well as unidimensional) models in the context of
We will give a quasi-spectral characterization of a connected bipartite weighted 2-punctually distance-regular graph whose halved graphs are distance-regular.. In the case the
We give a quasi- spectral characterization of a connected bipartite weighted 2-punctually distance- regular graph whose halved graphs are distance-regular.. In the case the
For the data sets used in this thesis we find that F-score performs well when the number of features is large, and for small data the two methods using the gradient of the
- - A module (about 20 lessons) co- designed by English and Science teachers with EDB support.. - a water project (published
• To achieve small expected risk, that is good generalization performance ⇒ both the empirical risk and the ratio between VC dimension and the number of data points have to be small..
• A sequence of numbers between 1 and d results in a walk on the graph if given the starting node.. – E.g., (1, 3, 2, 2, 1, 3) from
