鈰鈷釕銦單晶成長與壓力下超導效應之研究 - 政大學術集成
48
0
0
全文
(2) Content Abstract ................................................................................................................................................ IV 摘要 ......................................................................................................................................................... V Chapter1. Introduction ........................................................................................................................ 1. Chapter2. Background ......................................................................................................................... 3. 2.1. Heavy fermion ............................................................................................................................ 3. 2.1.1 2.2. Kondo effect ............................................................................................................................... 4. 2.2.1 2.3. RKKY Interaction ............................................................................................................... 4. 政 治 大. Kondo lattice ....................................................................................................................... 5. Superconductivity ....................................................................................................................... 6. 立. Zero resistance .................................................................................................................... 8. 2.3.2. Meissner Effect ................................................................................................................... 8. ‧ 國. 2.4. 學. 2.3.1. Specific heat introduction ......................................................................................................... 11. 2.4.1. Electronic specific heat Principle ...................................................................................... 12. ‧. 2.4.2 Phonon specific heat Principle .......................................................................................... 12 Magnetism ................................................................................................................................ 15. Nat. y. 2.5. sit. 2.5.1 Paramagnetism .................................................................................................................. 15. 2.5.3. Diamagnetic ...................................................................................................................... 18. 2.5.4. Antiferromagnetism .......................................................................................................... 18. 3.1. n. Chapter3. al. er. Ferromagnetism ................................................................................................................ 16. io. 2.5.2. Ch. engchi. i n U. v. Experiment ........................................................................................................................ 20. Growth of single crystal ............................................................................................................ 20. 3.1.1. Flux method ...................................................................................................................... 20. 3.2. X-ray Diffraction ...................................................................................................................... 22. 3.3. Electron transport properties measurement............................................................................... 23. 3.3.1. Four terminal resistance measurements ............................................................................ 24. 3.4. Magnetic Measurement............................................................................................................. 25. 3.5. Specific Heat Measurement ...................................................................................................... 26. Chapter4. Results and Discussion ..................................................................................................... 29. 4.1. CeCoIn5 X-ray diffraction data ........................................................................................... 29. 4.2. CeCoIn5 resistance data ............................................................................................................ 31. 4.3. CeCo1-xRuxIn5 (x=0-0.5) XRD data........................................................................................ 34 I.
(3) 4.4. CeCo1-xRuxIn5 (x=0-0.5) susceptibility and specific heat ......................................................... 36. 4.5. CeCoIn5 susceptibility on pressure ........................................................................................... 39. Chapter5. Conclusion ......................................................................................................................... 40. Reference ............................................................................................................................................... 42. 立. 政 治 大. ‧. ‧ 國. 學. n. er. io. sit. y. Nat. al. Ch. engchi. II. i n U. v.
(4) Content of figure Figure.2.3-1. Mercury resistance vs. temperature chart ................................................................... 7. Figure.2.3.2-1 Meissner Effect ............................................................................................................ 9 Figure.2.3.2-2 Type-I superconductor behavior ................................................................................ 10 Figure.2.3.2-3 Type-I superconductor behavior ................................................................................ 10 Figure.2.5.1-1 Paramagnetism.......................................................................................................... 16 Figure.2.5.2-1 Ferromagnetic ........................................................................................................... 17 Figure 3.1-1 Flux method ................................................................................................................. 21 Figure 3.2-1 X-ray diffraction machine ............................................................................................. 23. 政 治 大. Figure 3.2-2 Bragg diffraction ........................................................................................................... 23. 立. Figure 3.3-1 SQUID machine............................................................................................................. 24. ‧ 國. 學. Figure 3.3.1-1 four probe method .................................................................................................... 24 Figure 3.5-1 Specific heat chip .......................................................................................................... 28. ‧. Figure 5-1 X-ray diffraction pattern of the CeCoIn5 single crystal. ..................................................... 29. y. Nat. Figure 5-2 powder X-ray diffraction data for CeCoIn5. ...................................................................... 30. sit. Figure 5-7 Temperature dependence of resistivity for CeCoIn5 ......................................................... 32. n. al. er. io. Figure 5-8 the R-I curve to search critical current. ............................................................................ 33. i n U. v. Figure 5-10 Nominal X Ru dependence of a-axis and c-axis for CeCo1-xRuxIn5 (x=0-0.5) .................... 34. Ch. engchi. Figure 5-11 X-ray diffraction data for (a) CeCoIn5, (b) CeCo0.9Ru0.1In5,. (c)CeCo0.8Ru0.2In5, (d). CeCo0.7Ru0.3In5, (e) CeCo0.6Ru0.4In5, (f) CeCo0.5Ru0.5In5 ....................................................................... 36 Figure 5-15 Temperature dependence of moment for CeCoIn5 ......................................................... 40. III.
(5) Abstract In 1975, Andres, Graebner and Ott measured the specific heat and temperature dependence, and observed that the γ value in CeAl3 at low temperature is 1000 times larger than that in normal metals. Therefore, the effective mass of the electron in CeAl3 is 1000 times larger than that in normal metals. For such reason CeAl3 is so-called “heavy fermion material”. Recently, the heavy fermion materials, Ce(Co,Rh,Ir)In5, had attracted much. 政 治 大 one is superconductivity with 立 transition temperature at 0.4 K under high pressure (5. attention of physicists. There are two kinds of phase transitions observed in CeRhIn5,. ‧ 國. 學. GPa), the other is antiferromagnetism with transition temperature at 3.8 K. The superconducting transition temperature of CeIrIn5 was observed at 0.4 K. In this thesis,. ‧. we focused on the CeCoIn5 heavy fermion system.. sit. y. Nat. We fabricated the CeCoIn5 single crystal bulk by flux method. The. n. al. er. io. electronic transport, magnetic, and specific heat measurements were used to. i n U. v. characterize the physical properties of the CeCoIn5. The tetragonal structure of the. Ch. engchi. CeCoIn5 was confirmed by XRD patterns. The composition of the Ce:Co:In=1:1:5 was also checked by EDS measurements. The superconducting transition temperature of the CeCoIn5 was 2.26 K in atmosphere, which was confirmed by the temperature dependence of resistivity, susceptibility, and specific heat. In addition, the transition superconducting temperature was enhanced from 2.1 to 2.4 K as the pressure increased from 0 to 1 GPa.. IV.
(6) 摘要 1975 年,科學家 Andres, Graebner 和 Ott 在量測 CeAl3 材料比熱對溫度的 變化中,發現在低溫度處具有一個巨大的γ值,此種有別於一般金屬γ值大於 1000 倍的材料稱為重費米子材料。可視為其電子等效質量大於電子質量 1000 倍, 此電子被稱為重費米子。 近幾年來大家研究專注在 Ce(Co,Rh,Ir)In5 的重費米子材料中。在這系統中, CeRhIn5 本身具有超導和反鐵磁的特性,其超導特性需要外加壓力 5 GPa 才看的. 政 治 大 與 CeIrIn 超導的溫度的過低,所以我們選擇此系統裡超導溫度最高的 CeCoIn 立. 到在 0.4K 有超導轉變溫度。而 CeIrIn5 在 0.4k 時有超導的現象。但因為 CeRhIn5 5. 5. ‧ 國. 學. 來作為我的研究主題,其在常壓下其超導相轉變溫度為 2.26 K,因此我們試著 以調變外加壓力來改變此材料的超導轉變溫度來研究壓力對變溫度的關係。. ‧. 我們利用 flux 方法成長 CeCoIn5 單晶塊材,並對其進行了電性、磁性、與. sit. y. Nat. 比熱上的分析。首先,我們利用了 XRD 來確認我們塊材樣品為四方晶系的單晶結. al. er. io. 構。而在成份方面由 EDS 所得到數據來確認 Ce:Co:In 為 1:1:5 的比例。. v. n. 在電阻率、磁化率、比熱對溫度的量測,都可以明顯的看出常壓下 CeCoIn5 的超導轉變溫度為 2.26 K。. Ch. engchi. i n U. 我們利用量測磁化率對溫度的曲線來觀察在改變外加壓力下 CeCoIn5 的超導 轉變溫度,我們施加壓力從 0 到 1 GPa,我們觀察到其超導轉變溫度從 2.1 K 線 性增加到 2.4 K。. V.
(7) Chapter1. Introduction. In the 1970s, Heavy fermion behavior was discovered by Andres, Graebner and Ott, who observed enormous magnitudes of the linear specific heat capacity in CeAl3. That is to say, they get enormous magnitudes of γ from specific heat electron’s term. The γ value is larger 1000 times than normal metal.. Heavy fermion materials play an important role in current scientific research.. 政 治 大. Because the heavy fermion systems provide a unique opportunity to study the. 立. long-range magnetic order, unconventional superconductivity (SC), non-Fermi liquid. ‧ 國. 學. behavior, quantum critical point, valence fluctuations and etc.. ‧. For usual superconductors the attractive interaction between two electrons. sit. y. Nat. forming a Cooper pair is due to a lattice instability and magnetic impurities are pair. io. er. breaking. The actual interaction of heavy fermion between localized magnetic moments and conduction electrons in heavy fermion compounds is still not. n. al. completely understood.. Ch. engchi. i n U. v. In recent years, the series of Ce-based Heavy fermion superconductors arouse interest. In particular, Ce-based Heavy fermion of CeTIn5 (T=Co, Rh, and Ir) is widely fancied scientists. For a series of Ce-based compound, only one other structure type is known where one finds Superconductivity. In this series, it may be the main structure to enhance the Tc. Therefore CeTIn5 (T=Co, Rh, and Ir) can be referred to a variant of CeIn3. Based on a nearly antiferromagnetic Fermi-liquid (NAFFL) theoretical assumption, the large increase of Tc with respect to that of CeIn3 is attributed mainly to the reduced effective electronic dimensionality introduced by the TIn2 layers. The crystal structure 1.
(8) consists of alternating layers of CeIn3and TIn2 stacking along the [00l] direction. Due to its cubic structure, CeIn3 is good model system to study the appearance of superconductivity at quantum critical point where magnetic order is suppressed. However, CeIn3 have only Tc 0.2 K at 2-3 GPa. The family of CeTIn5 (T=Co, Rh, and Ir) has attracted great deal of attention since they possess relatively high transition temperature (Tc) such as Tc = 2.3 K (γ= 300mJ/mol K2) for CeColn5, CeRhIn5 is an antiferromagnet at ambient pressure TN ≈3.8 K (γ= 400mJ/mol K2, TN: Neel temperature), CeIrIn5 is also a Superconductivity Tc ≈ 0.4 K (γ= 750mJ/mol K2).. 政 治 大 In fact, The CeCoIn T is second only to heavy fermion PuCoGa with a T about 立 5. c. 5. c. 18 K. However, the material is on the one hand there is the danger of radiation on the. ‧ 國. 學. other hand is too scarce elements of Pu. So that it is difficult for us to study.. ‧. Application of pressure is a useful experimental method for controlling the. sit. y. Nat. magnetic interaction and hybridization between f electrons and conduction electrons. io. er. in uranium and cerium compounds, where the RKKY interaction and the Kondo effect compete with each other. As pressure is applied to compounds with magnetic. n. al. orderings.. Ch. engchi. i n U. v. The CeTIn5 family is a great opportunity to investigate the tunability of Heavy fermion ground states using external control parameters such as pressure or doping. The heavy fermion materials have been a complete understanding of their underlying electronic structures. The main focus of this thesis is investigating the pressure and doping in CeCoIn5. Unconventional superconductivity has increased (Tc) when increasing pressures were found in CeCoIn5. Ruthenium-doped heavy-fermion superconductor CeCoIn5 shift Tc towards 2 K. Using the hydrostatic pressures was prospect for increasing Tc in the study of heavy-fermion. 2.
(9) Chapter2 2.1. Background. Heavy fermion. When we measured sample specific heat and temperature. According to the solid-state theory, we know the temperature much lower than Fermi temperature and Debye temperature. Metal’s heat capacity could be expressed.. C = γT + β𝑇 3. 政 治 大. Some metal compound γ coefficient was compared higher two to three order. 立. ‧ 國. 學. than normal metal. However 𝑚𝑒∗ α γ was represented effective mass. The effective. mass was called heavy fermion that was higher two to three order than normal metal. When we describe under Fermi liquid strong interaction’s quasiparticals, at a. ‧. io. sit. Nat. er. 2 2 2 a = l C𝑘𝐵 𝜋 𝑁(𝜀𝐹 )𝑇 n=i v 𝛾 𝑇 3 hen hi U gc. n. 𝐶𝑝𝑐𝑐. χ = 2µ2𝐵 𝑁(𝜀𝐹 ). y. temperature equal to zero, the specific heat and magnetic susceptibility, respectively:. 𝜇𝐵 = 𝐵𝐵ℎ𝑟 𝑚𝑚𝑚𝑚𝑚𝑚𝑚𝑚 𝑘𝐵 = 𝐵𝐵𝐵𝐵𝐵𝐵𝐵𝐵𝐵 𝑐𝑐𝑐𝑐𝑐𝑐𝑐𝑐 𝑁(𝜀𝐹 ) = 𝑑𝑑𝑑𝑑𝑑𝑑𝑑 𝑜𝑜 𝑒𝑒𝑒𝑒𝑒𝑒𝑒𝑒 𝑠𝑠𝑠𝑠𝑠𝑠 γ = electronic specific heat. Since 𝑁(𝜀𝐹 ) and 𝑚∗ was proportional, so γ could be written.. γ=. 2 1𝑘𝐵. 2ℎ. ∗ (𝑚 𝑘𝐹 ) 2. The electron’s density come from kF, but didn’t judge Fermion compound configuration different with normal metal. So we will be obtained through the experiment very large electronic specific coefficient. It was attributed to the effective 3.
(10) mass m*. The composition of metallic state quasiparticals called heavy electrons or heavy fermion. Generally speaking, we have no interaction of the gas for general metal conduction electrons. We used to describe Fermi-Dirac statistical. And we were described the lattice by Debye model. The metal temperature was lower Debye temperature. Fermi temperature was relatively lower than Debye temperature. Metal electrons and lattice did not react with each other. In this case the metal resistance was decreased with decreasing temperature. For heavy fermion compounds, we have to. 政 治 大 lattice interaction. It was called Kondo effect. 立. consider conduction electrons and core electrons, and the conduction electrons and the. RKKY Interaction. ‧ 國. 學. 2.1.1. ‧. Magnetic ion was released to blend non-magnetic ions in the solid state of the. sit. y. Nat. material. It was important to exist between the conduction electron gas in the ions and. io. er. the interaction that coupling becomes important. Conduction electrons were magnetized nearly magnetic ions, and made magnetic interaction between the ions can. n. al. be generated.. 2.2. Ch. engchi. i n U. v. Kondo effect. Back in the 1940s scientists had discovered if the non-magnetic metal was doped in solution when mixed with a magnetic impurity as the temperature decreases. The resistance is reached after a sudden increase in the minimum, that cause the temperature and the resistance curve produced with a minimum. The resistance is decrease with temperature, because it is mainly conduction electron and phonon scattering. Scientists were surprised and puzzled. 1964s, Kondo proposed model for explaining this phenomenon. He assumed that already exist in the solution caused by 4.
(11) spin local magnetic moment. The spin S was coupled J interaction with the conduction electrons.it is called S-D model. He applied third perturbation theory, and he deduced Fermi level near conduction electrons scattering will produce InT contributions of resistance. His model explains successful that resistance sudden increase in dilute solid solutions of a magnetic ion in a nonmagnetic metal crystal. At Kondo effect significant temperature range, the change of the resistivity is related by spin. The resistivity can be written as 𝜌𝑠𝑝𝑝𝑝 = 𝑐𝜌𝑚 �1 +. 3𝑧𝑧 𝑙𝑙𝑙� = c𝜌0 − 𝑐𝜌1 𝑙𝑙𝑙 𝜀𝐹. 政 治 大 =exchange scattering intensity 立 measurements). (J: exchange energy; z: the number of highest nearly; c: concentration;. According to the above equation can be seen when J is negative then the spin. ‧ 國. 學. 𝜌𝑚. resistivity increases with temperature drop. Assuming this phonon resistivity. ‧. associated with T5, and the resistivity is increased. Overall resistivity of the form:. n. al. And. 𝜕𝜕 𝑐𝜌1 = 5𝛼𝑇 4 − =0 𝜕𝜕 𝑇. Ch. engchi. 𝑇𝑚𝑚𝑚 = (. 2.2.1. y. sit. io. The minimum:. er. Nat. ρ = α𝑇 5 + c𝜌0 − 𝑐𝜌1 𝑙𝑙𝑙. i n U. v. 𝑐𝜌1 1� ) 5 5𝛼. Kondo lattice. Although Kondo explained successful the phenomenon of resistance suddenly increases. However his theory at temperatures close to absolute zero resistance will diverge(InT → ∞ as T → 0). Therefore it still needs to be amended. This is the. famous “Kondo problem”. In experiment, Kondo effect studies focused on rare earth 5.
(12) element alloys (example: Ce, Yb). Because rare earth elements of the 4f electrons caused by magnetic nuclei closer. The 5s, 5p, 6s is Compared outer electron orbitals, so caused shielding. At this case, it just likes the incorporation of a smaller magnetic impurities nonmagnetic metal among multiple solutions. The fermion compound’s heavy fermion can explain from Kondo effect. There is also the 4f orbitals with magnetic electron interaction between each other is very weak, even at high concentrations of 4f electrons times it is difficult to line up orderly lattice arrangement. Such compounds we called Kondo lattice.. 政 治 大 立 2.3 Superconductivity. ‧ 國. 學. July 10, 1908 Heike Kamerlingh Onnes successfully completed the world's first. ‧. helium liquefaction of the great achievements for the low-temperature physics opens a. y. Nat. sit. new chapter has been 4.2 K new zone.. n. al. er. io. Since it measure resistance behavior of pure elements in the low temperature.. i n U. v. Because mercury is easy to purify, so he first measurement of mercury in the 4.2K. Ch. engchi. resistor temperature zone , In 1911 Onnes observed temperature of about 4.2 K, the mercury resistance suddenly jump down further than the minimum limit of the instrument low, jumped from 0.1 ohm 0.00001 ohm resistance change ratio of more than one million times (Figure.2.3-1).. 6.
(13) 立. 政 治 大. ‧. ‧ 國. 學. Figure.2.3-1. Mercury resistance vs. temperature chart. sit. y. Nat. n. al. er. io. Onnes claimed that mercury enters a new state, showing abnormal electrical. i n U. v. resistance, he initially called the supraconductivity state. Then the world is called the. Ch. engchi. superconducting state (superconductivity). The sudden disappearance of the resistance temperature is called the "critical temperature superconductors", usually represented Tc (Critical Temperature).. 7. it is.
(14) 2.3.1. Zero resistance. After the material enter the superconducting state through a resistance measurement. J. Bardeen, L.N. Cooper and R.J. Schrieffer proposed microscopic theory explaining superconductivity: BCS theory, because the electrons and ions generated under phonon interaction, the energy and momentum to pass by a same energy and momentum and spin in the opposite direction, but the b electrons, b Electronics also engaged in the same pass, causing the entire system of electrons and. 政 治 大 This paired electrons attract each other is called the superconducting electron or 立. ions, it does not seem with energy conversion in macroscopic.. Cooper pair, the whole can be regarded as no resistance and heat. Approaching to. ‧ 國. 學. certain temperature limit will be reduced to attract force sufficient to overcome the. ‧. screened Coulomb repulsion, the net attraction disappears. The electronics is not. sit. y. Nat. formed Cooper pair, and changed back to the normal state. This is a limiting. io. er. temperature superconducting critical temperature Tc, then electron net attraction strength will determine the size of Tc.. n. al. Ch engchi 2.3.2 Meissner Effect. i n U. v. In 1933, Meissner and Oschenfeld found that when the sample is cooled to below Tc and added a magnetic field. At this point the magnetic field lines have been completely unable to enter into a superconducting state in the sample. We will see the magnetic field lines are completely excluded. This is called Meissner Effect.. 8.
(15) 立. 政 治 大. ‧. ‧ 國. 學. Figure.2.3.2-1 Meissner Effect. We may distinguish between type I and II superconductors. The graph shown in. sit. y. Nat. Figure.2.3.2-2 illustrates the internal magnetic field strength, Bi, with increasing. n. al. er. io. applied magnetic field. It is found that the internal field is zero until a critical. i n U. v. magnetic field, Bc, is reached where a sudden transition to the normal state occurs.. Ch. engchi. This results in the penetration of the applied field into the interior. Superconductors that undergo this abrupt transition to the normal state above a critical magnetic field are known as type I superconductors. Most of the pure elements tend to be type I superconductors. The type II superconductors, on the other hand, respond differently to an applied magnetic field, as shown in Figure.2.3.2-3. An increasing field from zero results in two critical fields, Bc1 and Bc2. At Bc1 the applied field begins to partially penetrate the interior of the superconductor. However, the superconductivity is maintained at this point. The superconductivity vanishes above the second, much higher, critical field, Bc2. For 9.
(16) applied fields between Bc1 and Bc2, the applied field is able to partially penetrate the superconductor, so the Meissner effect is incomplete, allowing the superconductor to tolerate very high magnetic fields.. 立. 政 治 大. ‧. ‧ 國. 學. Figure.2.3.2-2 Type-I superconductor behavior. n. er. io. sit. y. Nat. al. Ch. engchi. i n U. v. Figure.2.3.2-3 Type-I superconductor behavior. 10.
(17) 2.4. Specific heat introduction. The specific heat of an object is defined as the amount of heat required to increase 1k, generally, the specific heat samples were contributed mainly from the electrons, phonons, lattices. If the sample contains a magnetic, you need to add the contribution of the magnetic. We generally can know the physical properties by measuring specific heat. (1) Generally the specific heat at low temperatures is mainly from the electron and phonon. It relationship was C=γT + βT 3 , the interception on Y axis of the C/T-T2. 政 治 大 curve is γ. Simply, when γ is much smaller than 0.505 mJ/K mol It was a poor 立 2. ‧ 國. it was conductor. (γ=0.505 mJ/K2 pure copper). 學. conductor or insulator. Conversely, if the γ was approached 0.505 mJ/K2mol then. ‧. (2) Specific heat of the magnetic substance is expressed as C=γT + βT 3 + CM(A).. y. Nat. Ferromagnetic specific heat was CM=KT3/2, Antiferromagnetic specific heat was. sit. er. io. CM(A)=KT3. (K is constant) When a magnetic field was applied, Ferromagnetic. material’s specific heat peak was moved to a higher temperature, and. al. n. v i n antiferromagnetic material’sC specific heat peak wasUmoved to a lower temperature. hengchi. (3) According to calculate the magnetic entropy specific heat. After the magnetic sample magnetic entropy was changed for extending magnetic field. (4) Specific heat can determine whether the sample impurities, Doped with other. elements was observed changes in specific heat. By the resistivity curves are often unable to know whether the sample impurities. If it had magnetic impurity then displayed magnetism peak at specific heat picture.. 11.
(18) 2.4.1. Electronic specific heat Principle. Low temperature specific heat was come mainly from electronic term γ and phonon termβ. The decline to lower the temperature, the phonon specific heat would quickly approach zero. At the electronic specific heat has become a major contribution. Electronic specific heat referred to here was the electronic degrees of freedom compared with an average contribution of heat. In classical physics, the average energy of each electron was 3 2. 3 2. 𝑘𝐵 𝑇, The heat capacity was. 政 治 大. 𝑘𝐵 (𝑘𝐵 = 𝐵𝐵𝐵𝐵𝐵𝐵𝐵𝐵𝐵 𝑐𝑐𝑐𝑐𝑐𝑐𝑐𝑐). In the quantum effect, the free electrons were not. 立. all contribute to thermal in metals. But only near the Fermi surface were contributed. ‧ 國. 學. proximity to 2𝑘𝐵 𝑇. Because the normal metal electronic specific heat at low. temperature:. ‧. n. al. er. io. sit. y. Nat. 1 2 2 C = 𝜋 𝑘𝐵 D(𝐸𝐹 )T = γT 3. v1 2 2 i n γ = 𝜋 𝑘𝐵 D(𝐸𝐹 ). Ch U 3 engchi. Therefore, the electronic specific heat coefficient was. The γ was proportional to the Fermi energy state, but free electrons and metals irrespective of the total number.. 2.4.2. Phonon specific heat Principle. Phonon specific heat is also known as lattice specific heat. When the temperature is lower, it is smaller the contribution of the heat. We generally calculate the specific heat. It is a fixed-capacity thermal capacity. (U: energy, T: temperature) 𝐶𝑣 ≡ (. 𝜕𝜕 ) 𝜕𝜕 𝑣. 12.
(19) Phonon contribution to the heat capacity of the crystal lattice is called thermal capacity, Express by 𝐶𝑣𝑣𝑣 . Crystal phonon energy can be written as the total of all the energy phonon modes at a temperature τ (≡ 𝑘𝐵 𝑇).. U ≡ � � < 𝑛𝐾,𝑃 > 𝜂𝜔𝐾,𝑃 𝐾. 𝑃. (K: wave vector, P: polarized index) The < 𝑛𝐾,𝑃 > is expressed occupation of thermal equilibrium. It is Planck’s. formula:. <𝑛> =. 1. ………2. 𝜂𝜂 exp� �−1 𝜏. 政 治 大. According to 1 and 2 formula can get:. 立. ‧ 國. 𝐾. 𝑃. 1 𝜂𝜔𝐾,𝑃 𝜂𝜔 exp � 𝜏𝐾,𝑃 � − 1. 學. U ≡ ��. For the bulk, we can replace the integral of the sum of K. Assuming the crystal at. ‧. al. n. 𝐶𝑙𝑙𝑙. 𝜆. 𝐿𝐿𝐿. Ch. 𝜂𝜂 𝜂𝜂 =𝑥= 𝜏 𝑘𝐵 𝑇. engchi. y. 1 𝜂𝜂 𝜂𝜂 exp � 𝜏 − 1�. sit. io. U ≡ � � 𝑑𝑑𝐷𝜆 (𝜔). er. Nat. a frequency range of polarization from ω to ω + dω which have 𝐷𝜆 (𝜔)𝑑𝑑 modes.. i n U. v. 𝜕𝜕 𝑥 2 𝑒𝑒𝑒𝑒 = = 𝑘𝐵 � � 𝑑𝑑𝑑(𝜔) 𝜕𝜕 exp(𝑥 − 1)2 𝜆. 𝐷(𝜔): The number of modes per unit frequency was called Mode Density. We must calculate the ground-state properties of N3electrons confined to a volume V of side length L. exp[i(Kxx+kyy+kzz)]≡exp{i[kx(x+L)+Ky(y+L)+Kz(z+L)]} Kx, Ky, Kz = 0; ±. 2𝜋 𝐿. ; ±. 4𝜋 𝐿. ; …; ±. 𝑁𝑁 𝐿. In k space, the per unit volume have a permissible value k.. 13.
(20) 𝐿 3 𝑉 ) = 3 2𝜋 8𝜋 Thus, within our imagined spherical volume of k-space, the total number of states present is (. N=(. 𝐿 3 4𝜋 3 ) 𝐾 2𝜋 3. In Debye approximation, the velocity of sound is constant each of polarization state. Just as the classical case of elastic media, the relation was written ,ω=μK,μ: velocity of sound. 𝑉𝜔2 𝐷(𝜔) = 2 3 2𝜋 𝜇. 政 治 大. If sample have N unit cell, the total phonon mode value was N. Cutoff frequency. 立. ‧ 國. 𝜔𝐷3 = 6𝜋 2 𝜇 3 𝑁/𝑉. 學. 𝜔𝐷 .. For the frequency, the k-vector:. y. ‧. Nat. 𝜔𝐷 6𝜋 2 𝑁 1� 𝐾𝐷 = =( ) 3 𝑉 𝑉. er. io. K ≤ 𝐾𝐷 :. sit. According to Debye, we don’t promise 𝐾𝐷 mode higher than k vector. When. n. al. Ch. i n U. U = � 𝑑𝑑𝑑(𝜔) < 𝑛(𝜔) > η𝜔 =. engchi. v. 𝜔𝐷 𝑉𝜔 2 𝜂𝜂 ∫0 (2𝜋2𝜇3 )(𝑒 η𝜔 −1). We assume that the phonon velocity and polarization independent. 𝜔𝐷 3𝑉𝑉 𝜔3 U = 2 3 � 𝑑𝑑 η𝜔/𝜏 2𝜋 𝜇 0 𝑒 −1 3𝑉𝑘 4 𝑇 4. 𝑥=. 𝜂𝜂 𝜏. 𝑥. 𝑥3. = 2𝜋2𝜂𝐵3 𝜇3 ∫0 𝐷 𝑑𝑑 𝑒 𝑥 −1. = 𝜂𝜂/𝑘𝐵 𝑇,𝑥𝐷 = 𝜂𝜔𝐷 /𝑘𝐵 𝑇. The Debye temperature was θ≡ 𝜂𝜔𝐷 /𝑘𝐵 , it also is 𝑥𝐷 = 𝜃/𝑇. 𝜂𝜂 6𝜋 2 𝑁 1� = ( ) 3 𝑘𝐵 𝑉 14.
(21) So the phonon’s total energy: T 3 𝑥𝐷 𝑥3 U = 9N𝑘𝐵 � � � 𝑑𝑑 𝑥 θ 𝑒 −1 0. 𝜔𝐷 𝜕𝜕 3𝑉𝜂2 𝜔4 𝑒 η𝜔/𝜏 = 𝐶𝑣𝑣𝑣 = 2 � 𝑑𝑑 η𝜔 𝜕𝜕 2𝜋 𝑘𝐵 𝑇 2 𝜇 3 0 (𝑒 𝜏 − 1)2. T 3 𝑥𝐷 𝑥4𝑒 𝑥 = 9N𝑘𝐵 � � � 𝑑𝑑 𝑥 θ (𝑒 − 1)2 0. When the temperature was low, we can make limit extended to infinity. ∞. � 𝑑𝑑 0. 𝑥3 𝜋4 = 𝑒 𝑥 − 1 15. 政 治 大 T<<θ,U ≅ 3𝜋 𝑁𝑘 𝑇 /5𝜋𝜋 ,and 立12𝜋 T T T>>θ, Heat capacity was closed to classical 3NKB. 4. 𝐵. 4. ‧ 國. er. io. sit. Paramagnetism. al. 3. y. Nat. 2.5.1. Magnetism. 𝑁𝑘𝐵 � � ≅ 234𝑁𝑘𝐵 � � 5 θ θ. ‧. 2.5. 3. 4. 學. 𝐶𝑣𝑣𝑣 =. 3. v. n. Paramagnetic susceptibility χ is a small positive number, typically between 10-3. Ch. engchi. i n U. and 10-6, the weak magnetic diamagnetic, but whose magnetization direction is the same as the applied field. Constituting because paramagnetic atoms or molecules with an unpaired electron appears inside, the paramagnetic net magnetic moment of each atom is not zero, but because the magnetic moments between atoms cancel each other in different directions so overall net moment paramagnetic substance is zero, not magnetic. When a magnetic field is applied, the unpaired electron of this magnetic field susceptible to the effects of rotation of the magnetic moment of these atoms are arranged along the direction of the applied magnetic field, thereby generating a magnetic field in the same direction with the net magnetic moment. This net magnetic 15.
(22) moment will heat disturbance, and makes the arrangement of atomic magnetic moment is damaged, so the magnetic susceptibility and temperature.. Figure.2.5.1-1 Paramagnetism. 立 Ferromagnetism. 學. ‧ 國. 2.5.2. 政 治 大. Ferromagnetic materials include Fe, Co, Ni and their compounds and alloys and. ‧. other materials, the main features is a large magnetic susceptibility, χ value is one that. sit. y. Nat. is large positive number. Ferromagnetic material and paramagnetic substances, atom. io. er. itself has an unpaired electron atom resulting net magnetic moment is not zero. However, ferromagnetic and paramagnetic materials have a very different place, is. al. n. v i n C h moments of theUtwo atoms adjacent to each ferromagnetic material of the magnetic engchi. other, there is interaction between, the interaction of the magnetic moment that is adjacent to the same direction, which is a quantum effect.. The magnetic behavior of ferromagnetic materials the magnetic field can be used (magnetic domain) to make the concept overview. Each magnetic field ranges between a few microns to 1 mm, containing approximately 1015 ~ 1016 atoms. Even without an external magnetic field, still has a ferromagnetic material arranged in neat rows from spintronics and magnetic moment. With a magnetic domain magnetic moment, due to the magnetic field between the atoms in a strong magnetic dipole coupling effect, making the magnetic moments are arranged parallel to each other and 16.
(23) pointing in the same direction, that is, each magnetic field itself will have a saturation magnetization value, called self magnetized. These magnetic domains wall between domains (domain wall) apart, each magnetic domain contains several millions of small moments. The applied magnetic field, the different moments of the magnetic field is not the same point, so the total magnetic moment of ferromagnetic substance to zero.. Figure.2.5.2-1 Ferromagnetic. 學. ‧ 國. 立. 政 治 大. ‧ y. Nat. n. er. io. al. sit. Curie temperature. i n U. v. The heat causes ferromagnetic material deviation from perfect magnetic dipole. Ch. engchi. moment parallel’s arrangement. When the temperature gradually increased, if the temperature is increased to heat the ferromagnetic material is greater than the magnetic dipole moment, the exchange arranged in parallel, because of the disturbance of the magnetic moment by thermal excitation, so that the order became messy arrangement, when the ferromagnetic material disappear into the ferromagnetic-paramagnetic. This change the magnetic properties of the temperature are called the Curie temperature TC. When a ferromagnetic material from a high temperature cooled to below the Curie temperature, the ferromagnetic Jiangzai magnetic field is formed back into a ferromagnetic material. General common bulk 17.
(24) ferromagnetic materials, Fe, the Curie temperature is about 770 ℃, Co Curie temperature of about 1123 ℃, Ni Curie temperature of about 358 ℃. 2.5.3. Diamagnetic. Diamagnetic susceptibility χ is a small negative value, usually at about -10-5. Diamagnetic effect occurs is the result of the electron orbital motion. As the anti-magnetic material each electron orbit electrons are paired, which each track has two electrons with opposite spins, the individual electronic bypass magnetic moments. 政 治 大 magnetic, and its net magnetic moment is zero. When a magnetic field applied to this 立 of nuclei generated offset each other, thus making diamagnetic substance itself is not. material, the orbit of the electrons out of balance, the electron orbital angular. ‧ 國. 學. momentum change to produce a net magnetic moment m, the cooling times (Lentz). ‧. law, the net magnetic moment in the direction of this magnetic field should be in the. sit. y. Nat. opposite direction. Diamagnetic effect in all material occurs, albeit to varying degrees.. io. er. The properties also have other magnetic materials that (eg: ferromagnetic and paramagnetic), diamagnetic almost negligible, it is called diamagnetic material is. al. n. v i n C hsubstance. The atomic generally treated with non-magnetic magnetic moment due to engchi U. induction regardless of the direction, so does not affect the thermal disturbance. magnetic permeability diamagnetic sense, so the susceptibility is independent of temperature.. 2.5.4. Antiferromagnetism. Also a weak antiferromagnetic magnetic susceptibility χ is a small positive number, the same as the magnetization direction of the applied magnetic field. Magnetic susceptibility and temperature dependent, but varies with temperature compared with paramagnetic special circumstances. When the temperature is lower 18.
(25) than the Fresnel temperature TN (Neel temperature), with the temperature, the magnetic susceptibility increases, and when the temperature is higher than TN, the magnetic susceptibility, along with the increase in temperature becomes small, paramagnetic. When the temperature is below TN, the magnetic moments tended to antiparallel arrangement.. Neel temperature. 立. 政 治 大. In the anti-ferromagnetic material, there is also a similar characteristic. ‧ 國. 學. temperature Curie temperature, when the temperature rises due to heat effect of a. ‧. disturbance, so that the arrangement of the magnetic moment became chaotic, is no. sit. y. Nat. longer anti-parallel arrangement, the antiferromagnetic magnetic begins. io. er. antiferromagnetic into paramagnetic, which is a characteristic temperature of the Fresnel transformation temperature TN. When the temperature continued to drop, the. al. n. v i n C h material will U magnetic moments of antiferromagnetic again form antiparallel. engchi. Antiferromagnetic Fresnel bulk temperature of the CoO 290 K, therefore make the antiferromagnetic CoO showing the operation to be cooled.. 19.
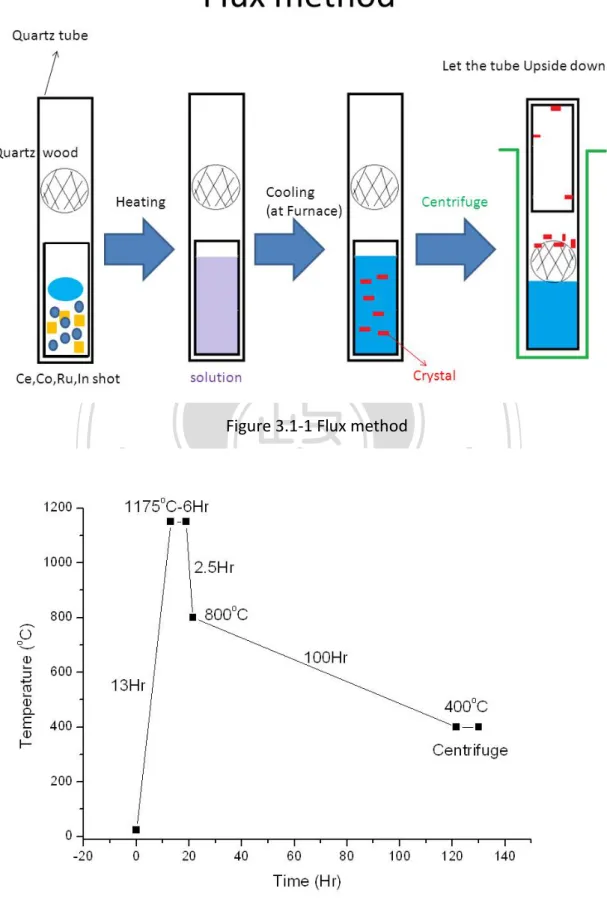
(26) Chapter3 Experiment 3.1. Growth of single crystal. Firstly the Ce ingot was exposed to the air, and it developed a deep oxide-layer. We sublimated the Ce surface using an arc melting furnace. We allocated the element in compliance with the nominal compound, and put in quintuplicate In. After measuring the compound ingot, we loaded the crucibles (Al2O3). The crucible wasn’t. 政 治 大 Second, we were loaded 立the crucible and quartz wood to silica by ordering. The. reactive to silica.. ‧ 國. 學. silica tube was sealed and evacuated (10-6 torr pressure) by using a vacuum pump. We placed the silica tube in the furnace and let the furnace heat in sequence.. ‧. Finally, the excess indium was decanted in a centrifuge. We broke the crucible. sit. io. er. Flux method al v i n C h grown by usingUa standard In-flux technique. The CeCoIn5 single crystals were engchi. n. 3.1.1. y. Nat. and retrieved the crystal.. Using the flux method can get a good quality sample, and it also can grow a lot of difference in melting point between the elements. However, a disadvantage of this technique was that the sample was too small. The size was about mm to cm. Generally, Al, Ga, In, Ge, Sn and Pb can be used as the flux solvent for the single crystal growth of intermetallic compounds. In this study, we choose crystal growth of In-rich ternary and quaternary, the reason being that In is one of the elements in the material.. 20.
(27) 立. 政 治 大. ‧ 國. 學 ‧. Figure 3.1-1 Flux method. n. er. io. sit. y. Nat. al. Ch. engchi. i n U. Figure 3.1-2 anneal pattern 21. v.
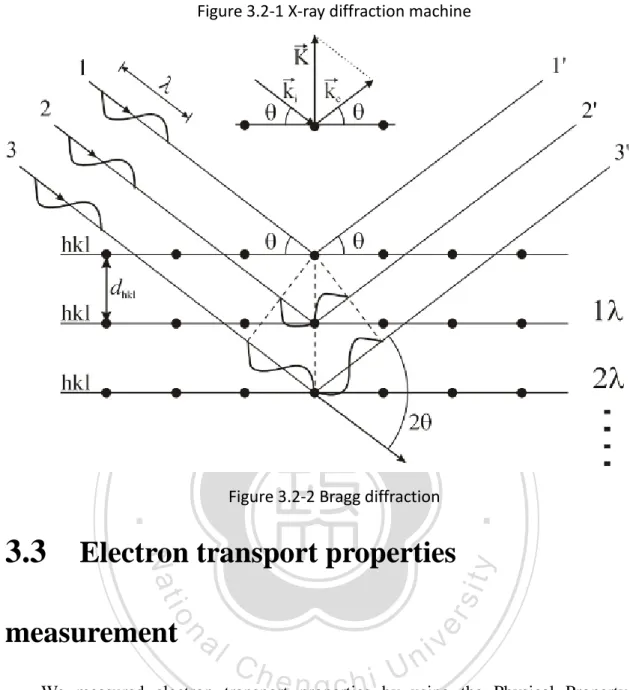
(28) 3.2. X-ray Diffraction. In X-ray diffraction, it is important to use a heating filament that releases electrons, and the electrons collide against a copper target. The X-ray is released by high pressure acceleration. The released X-ray is separated into two parts, continuous spectrum and characteristic spectrum. The continuous spectrum, K, of high energy electrons collide with a copper target, the electronic release of deceleration. The electrons from the copper target hit the inner rail to produce a hole, and the outer. 政 治 大 discontinuous characteristic spectrum K K , K . But the K 立. orbital electrons replace them. In the replacement process, it will release a α1,. α2. α1 and Kα2. β. ‧ 國. 學. close. Generally, we select the Kα1 and filter the Kα2.. angle is very. The X-ray generator and detector move simultaneously so the angle that we get. ‧. is 2θ. The incident light and the scattered light of the optical path difference is an. sit. y. Nat. integer multiple of the wavelength 2dsinθ. That will produce constructive. io. n. al. nλ=2 dhkl sinθ. Ch. engchi. 22. er. interferences. It can be explained by Bragg’s Law:. i n U. v.
(29) Figure 3.2-1 X-ray diffraction machine. 立. ‧. Electron transport properties. er. io. sit. y. ‧ 國. 學 Figure 3.2-2 Bragg diffraction. Nat. 3.3. 政 治 大. n. measurement a iv l C n he gchi U We measured electron transport n properties by using. the Physical Property. Measurement System (PPMS). We mostly measured the resistance to check the sample behavior. The following will introduce the PPMS and four probe measurements. A sectional drawing of the PPMS was shown in Fig. 1. In the outer part of the barrel there is liquid nitrogen. The nitrogen jacket helps to keep the liquid helium cool. At the bottom of the sample chamber is a 12-pin connector pre-wired to the system electronics. The 12-pin allows for data to be taken.. 23.
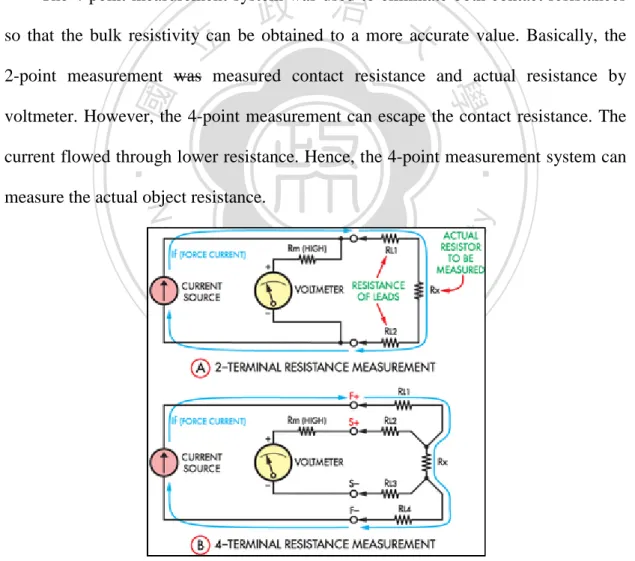
(30) Figure 3.3-1 SQUID machine. 3.3.1. Four terminal resistance measurements. 政 治 大 so that the bulk resistivity can be obtained to a more accurate value. Basically, the 立 The 4-point measurement system was used to eliminate both contact resistances. 2-point measurement was measured contact resistance and actual resistance by. ‧ 國. 學. voltmeter. However, the 4-point measurement can escape the contact resistance. The. ‧. current flowed through lower resistance. Hence, the 4-point measurement system can. n. al. er. io. sit. y. Nat. measure the actual object resistance.. Ch. engchi. i n U. v. Figure 3.3.1-1 four probe method. 24.
(31) 3.4. Magnetic Measurement. For the magnetic measurement, we used Quantum Design products of the SQUID magnetometer. The system used a high synthesis and automatic measurement technique. It was separated into seven parts at machine structure: (1) Temperature control system: using the heater and helium primarily to balance to the wanted temperature.. Range: 1.8 to 350 K. (2) Superconducting Magnet system: It was important to control current from the Range: 5 to -5 T 政 治 大. power supply to approach our magnetic field. (3) SQUID detector system:. 立. (4) Sample control system: This could translate or rotate on the detector, and the. ‧ 國. 學. mechanic wave didn’t transfer to SQUID. SQUID could provide another. ‧. length to scan, and set accordingly to the measurement requirement.. sit. y. Nat. (5) Gas control system: The system would keep the nitrogen pressure for Dewar.. io. keep liquid helium at low temperature.. al. er. (6) Liquid helium Dewar system: The Dewar was an adiabatic system that could. n. v i n C hWe will measure theUphysics quantity in sequence. (7) Computer control system: engchi. The object sample was fixed the measurement stick using cotton, and that sample was placed to purge. When the oxide enters the chamber, it will bring the temperature up to 90 K. That will interfere with the lower temperature. SQUID used 6 cm of scanning. It only uses one to average magnetic moment from the 32 scans at each point. Before the magnetic measurement, it was important to calibrate the center of sample. The Tc measurement was separated into two parts.. 25.
(32) (1) Zero-Field Cooling (ZFC) It cooled down to a lowest temperature, it was pressurized, and a magnetic field was applied. After calibrating the position, we increased the temperature in intervals of 0.1 K. The machine would confirm the temperature balance and would take measurements. It observed magnetization as well as temperature. (2) Field Cooling (FC) Firstly, the temperature was increased up to Tc, and a magnetic field was applied. After calibrating the position, we decreased the temperature in intervals of 0.1 K. The. 政 治 大 was measured the FC and ZFC by observing variation. 立. machine would confirm the temperature balance and would take measurements. We. ‧ 國. Specific Heat Measurement. 學. 3.5. ‧. Heliox Soption Pumped He3 Insert (He3cryostat) was manufactured products by. sit. y. Nat. Oxford. It could cool down temperature to 0.3 K. Using thermal relaxation method. io. er. was measured specific heat. In adaibatic, that added fix energy on sample. The sample had temperature drop T+∆T at balanceable environment. If the current was Shut down,. al. n. v i n will C drop from T+∆T to U h e n g c h i T. The. then sample temperature. relaxation time τ was. defined from T+∆T to T. According to the current could calculate ∆P. The gold silk. was conect between smaple and heat bath. K=∆P/∆T was decided to thermal conductivity by gold silk. The formula C=K × τ could get capacity. The sample would be fixed on holder, and put into the He3 cryostat.. In experiment, we would decrease temperature to 0.3 K firstly. We added the helium gas into He3 cryostat, because it could precipitate to cool down. When temperature was decrease to 50 K, The will just pass into the gas extraction. And to observe whether there was the phenomenon of return temperature. The He3 cryostat had capillary at outside. It could take advantage of capillary suction pump pumping 26.
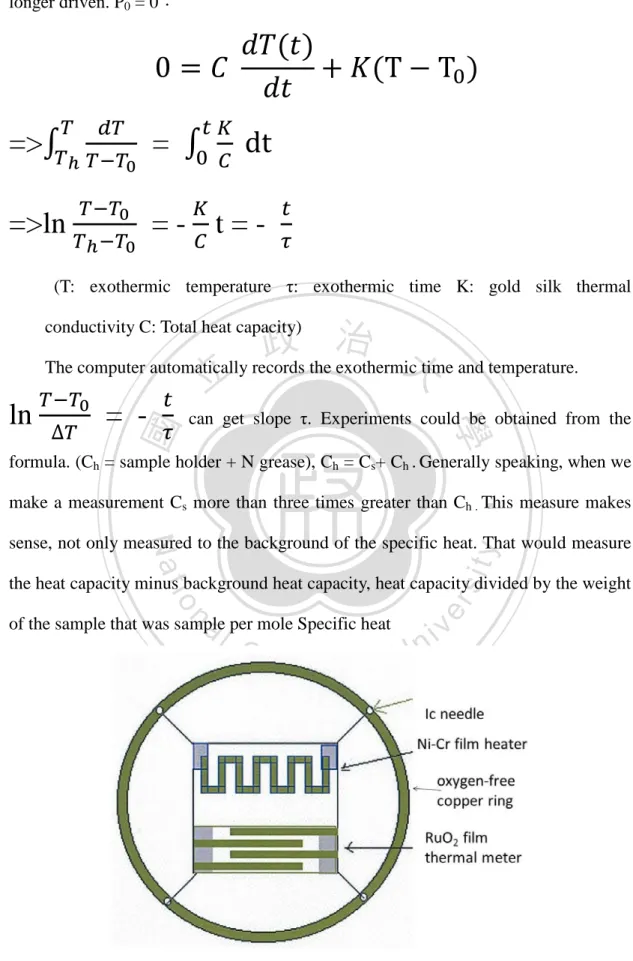
(33) liquid helium to cool 1K plate and Sorb. There was activated carbon within Sorb. When the temperature dropped 2 K will function with adsorption. He3 mainly used adsorption. If the temperature was decreased, then the activated carbon adsorption would increase. The 1 K plate mainly used to condense He3, when the temperature dropped to 2 K and then start with 1 K plate condensed down to He3. The Sorb was heated over 30 K, that was not adsorbed He3. Thus He3 passed to Sorb from He3 bucket, and He3 were condensed slowly at He3 Pot. Basically, the 1 k plate would keep from 30 minutes in 1.8 k. He3 completely would be able to condense to He3 Pot. 政 治 大 would begin adsorption He at this time. This allows the temperature to 0.3 K. 立. from He3 bucket, and Sorb heater would turn off. When Sorb encounter cold, and 3. In the measurement process, because the temperature is rapidly changing, so we. ‧ 國. 學. have no way to directly access the change of temperature mapping. So while a. ‧. Wheatstone bridge designed to read the voltage changes (∆V). We provided a constant. sit. P(t) = 𝐶. y. Nat. power P(t), and heated sample to T(K), The system's heat balance equation:. 𝑑𝑇(𝑙). io. + 𝐾 ∆ T (t)………….(a) a l conductivity ∆ T : TChip –i TvCopper ring) (t:time K: gold silk thermal n Ch U e , using g c hthei Ni-Cr was heated to P(t). Let the When temperature was fixed to T0n. n. er. 𝑑𝑙. temperature rises and reaches a stable Th;Th=T0+∆V. Chip and sample’s heat thermal resistance and heat because heat dissipation into the heat bath. If the heating power is fixed at P0, and the sample temperature reaches a steady state. Also exactly equal to the increase of heat energy dissipated by the gold silk. The sample temperature was frozen.. 𝑑𝑇(𝑙) 𝑑𝑙. =0. →. K=. 𝑃0. ∆T. , ∆ T = Th-T0. Ni-Cr film heating temperature was fixed Th, At this time the heater was no 27.
(34) longer driven. P0 = 0:. 𝑇. =>∫𝑇 =>ln. ℎ. 0=𝐶. 𝑡𝐾. 𝑑𝑑. = ∫0. 𝑇−𝑇0. 𝑇−𝑇0. 𝐾. 𝐶. 𝑑𝑇(𝑚) + 𝐾(T − T0 ) 𝑑𝑚 dt. =- t=𝐶. 𝑇ℎ −𝑇0. 𝑡. 𝜏. (T: exothermic temperature τ: exothermic time K: gold silk thermal. 政 治 大 The computer automatically records the exothermic time and temperature. 立 𝑇−𝑇 𝑡 conductivity C: Total heat capacity). = -. 𝜏. ‧ 國. ∆𝑇. 0. can get slope τ. Experiments could be obtained from the. 學. ln. formula. (Ch = sample holder + N grease), Ch = Cs+ Ch . Generally speaking, when we. ‧. make a measurement Cs more than three times greater than Ch . This measure makes. sit. y. Nat. sense, not only measured to the background of the specific heat. That would measure. n. al. of the sample that was sample per mole Specific heat. Ch. engchi. er. io. the heat capacity minus background heat capacity, heat capacity divided by the weight. i n U. v. Figure 3.5-1 Specific heat chip 28.
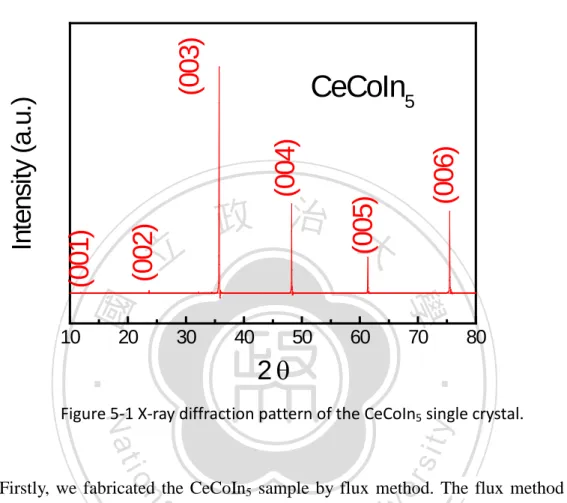
(35) Chapter4 Results and Discussion CeCoIn5 X-ray diffraction data. 20. 30. 40. 50. 60. 70. 80. ‧. 2θ. (005). 政 治 大. 學. 10. (006). CeCoIn5 (004). (002). (001). 立. ‧ 國. Intensity (a.u.). (003). 4.1. er. io. sit. y. Nat. Figure 5-1 X-ray diffraction pattern of the CeCoIn5 single crystal.. Firstly, we fabricated the CeCoIn5 sample by flux method. The flux method of. al. n. v i n C hphases in the sample. fabrication often creates different In Fig. 5-2, we can find the engchi U different phases that In and CeIn3 pick. Therefore, we should pick the crystal with the. CeCoIn5 composition that we want. In the selection of the sample, we chose a relatively flat body surface. We scan angles from 10o to 80o, and can know clearly (00L) the directions picked from Fig. 5-1: 11.727o (001), 23.58o (002), 35.695o (003), 48.24o (004), 61.435o (005), 75.609o (006), respectively.. 29.
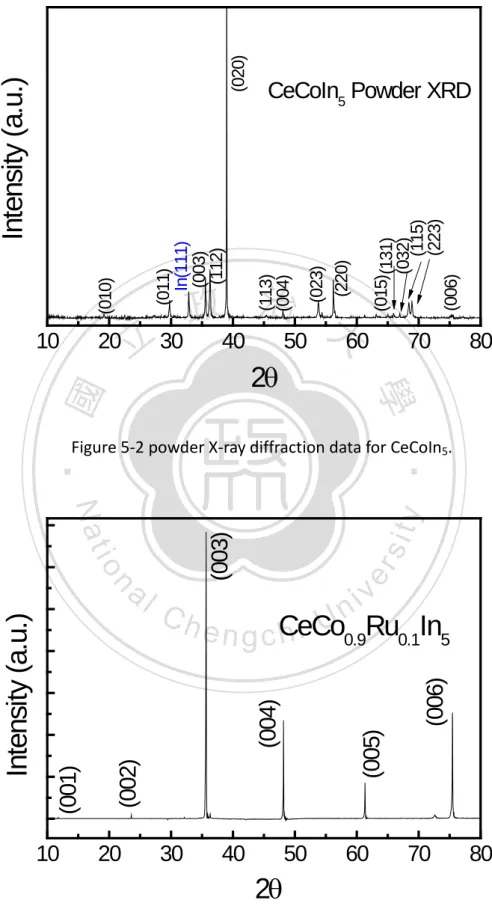
(36) (020). 立. 70. 80. 學. 2θ. (015)(131) (032) (115) (223) (006). (023) (220). 政 治 大 30 40 50 60. ‧ 國. 20. (113) (004). (010). (011) In(111) (003) (112). Intensity (a.u.) 10. CeCoIn5 Powder XRD. ‧. Figure 5-2 powder X-ray diffraction data for CeCoIn5.. er. 10. (005). (004). (006). v i n Ch e n g c CeCo h i U 0.9Ru0.1In5. (002). (001). Intensity (a.u.). n. (003). io. sit. y. Nat. al. 20. 30. 40. 50. 60. 70. 80. 2θ Figure 5-3 X-ray diffraction pattern of the CeCo0.9Ru0.1In5 single crystal.. 30.
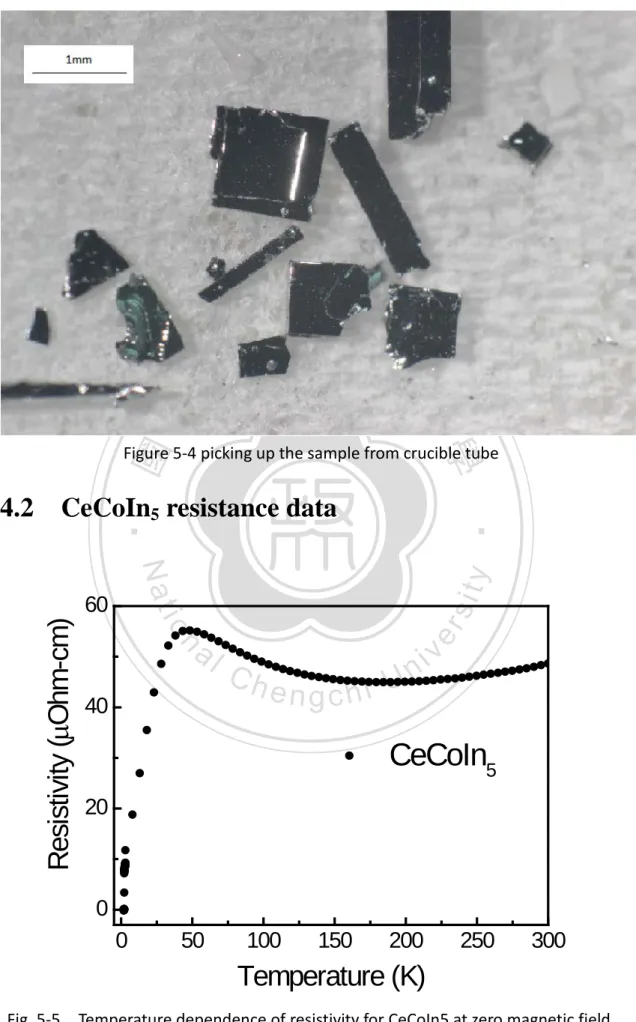
(37) 立. 政 治 大. ‧ 國. 學. Figure 5-4 picking up the sample from crucible tube. CeCoIn5 resistance data. n. al. er. io. sit. y. Nat. 60. Resistivity (µOhm-cm). ‧. 4.2. 40. Ch. engchi. i n U. v. CeCoIn5 20. 0 0. 50. 100. 150. 200. 250. 300. Temperature (K) Fig. 5-5. Temperature dependence of resistivity for CeCoIn5 at zero magnetic field. 31.
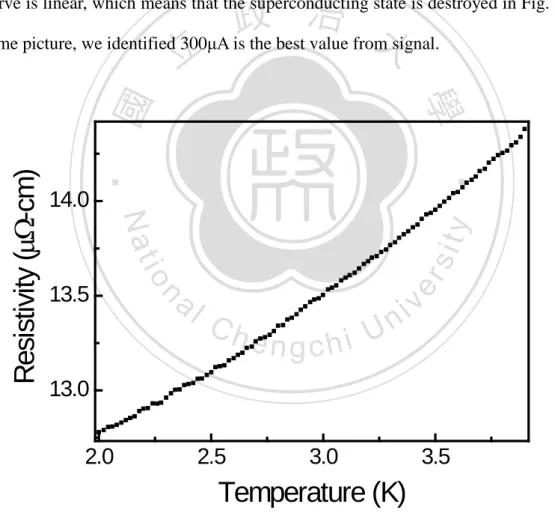
(38) From XRD analysis we can find that we want CeCoIn5. In the selection of CeCoIn5, it grown by flux method with a typical size of (1-2)×(1-2)×(~0.1)mm3. Its shape is not very regular in Fig. 5-3. In order to convenient to measure resistivity, and select relatively large pieces of samples. In the beginning, we didn’t measure superconducting state at CeCoIn5. We guess the superconducting state was broken. For the signal good, we tune the current maximum 5000μA. After that we went to in 1.8 K when the current sweep out the best current. We found that at more than 2000μA, the current dependence of resistance. 政 治 大 same picture, we identified 300μA is the best value from signal. 立. ‧. ‧ 國. 學. 14.0. sit. n. al. er. io. 13.5. y. Nat. Resistivity (µΩ-cm). curve is linear, which means that the superconducting state is destroyed in Fig. 5-7. In. Ch. engchi. i n U. v. 13.0 2.0. 2.5. 3.0. 3.5. Temperature (K) Figure 5-7 Temperature dependence of resistivity for CeCoIn5. 32.
(39) We used four terminal resistance measurement to measure the CeCoIn5 resistivity dependence of temperature by PPMS in Fig. 5-8. This is the observation of a resistance minimum with decrease of temperature because it is dominated by phonon scattering which decreases rapidly about 180 K. While below 48 K the resistance decreases with decreasing temperature dramatically and eventually get into the superconducting state at about 2.3 K. This is a typical behavior of heavy Fermion systems which can be understood in terms of competition between the RKKY interaction and the Kondo effect.. ‧ 國. y. sit. io. al. n. 0.000. er. 0.002. -0.002. ‧. 0.004. 學. 0.006. 立. Nat. Resistivity (µΩ-cm). 0.008. 政 治 大. 0. 500. Ch. engchi 1000. i n U. 1500. v. 2000. Current (µΑ) Figure 5-8 the R-I curve to search critical current.. 33. 2500.
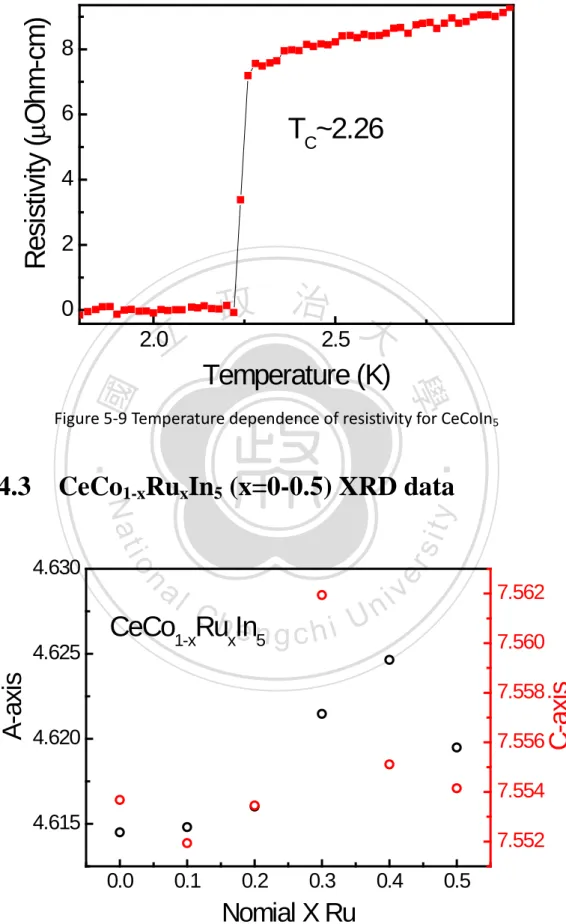
(40) Resistivity (µOhm-cm). 8 6. TC~2.26. 4 2. 政 治 大 2.5. 0. 立. 2.0. ‧ 國. 學. Temperature (K). Figure 5-9 Temperature dependence of resistivity for CeCoIn5. ‧. CeCo1-xRuxIn5 (x=0-0.5) XRD data. sit. A-axis. 4.625. C. CeCo1-xRuhxe Inn5 g c h i. i n U. v. 7.562 7.560 7.558. 4.620. 7.556. C-axis. n. al. er. io. 4.630. y. Nat. 4.3. 7.554 4.615. 7.552 0.0. 0.1. 0.2. 0.3. 0.4. 0.5. Nomial X Ru Figure 5-10 Nominal X Ru dependence of a-axis and c-axis for CeCo1-xRuxIn5 34.
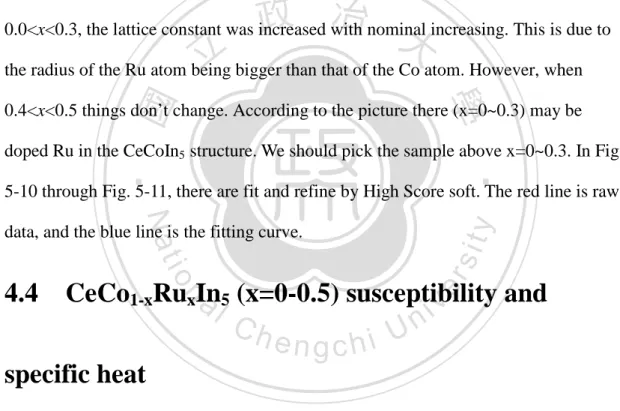
(41) (x=0-0.5). a. b. 立. 政 治 大. c. ♣ : Ce2CoIn8. * : In. n. al. d. er. io. sit. y. ‧. ‧ 國. 學. Nat. ● : CeIn3. Ch. engchi. i n U. v. e. f. 35.
(42) Figure 5-11 X-ray diffraction data for (a) CeCoIn5, (b) CeCo0.9Ru0.1In5, (c)CeCo0.8Ru0.2In5, (d) CeCo0.7Ru0.3In5, (e) CeCo0.6Ru0.4In5, (f) CeCo0.5Ru0.5In5. From CeCoIn5 experience, we can catch crystal growth conditions. Using these conditions, we try to dope Ru into the CeCoIn5 structure. We used Ru to substitute Co elements of this position and observe the changes. We pick up the several samples from different nominal and grind the samples to powder. From the measured powder, we can know powder’s X-ray diffraction pattern and calculate the lattice constant by refinement. For concentrations in the range. 政 治 大. 0.0<x<0.3, the lattice constant was increased with nominal increasing. This is due to. 立. the radius of the Ru atom being bigger than that of the Co atom. However, when. ‧ 國. 學. 0.4<x<0.5 things don’t change. According to the picture there (x=0~0.3) may be doped Ru in the CeCoIn5 structure. We should pick the sample above x=0~0.3. In Fig.. ‧. 5-10 through Fig. 5-11, there are fit and refine by High Score soft. The red line is raw. y. Nat. er. io. CeCo1-xRuxIn and a 5 (x=0-0.5) susceptibility v. n. 4.4. sit. data, and the blue line is the fitting curve.. i l C n hengchi U. specific heat From CeCo0.9Ru0.1In5 ratio to a selection can be compared with and without doping. And we take CeCo0.9Ru0.1In5 susceptibility measurements. From the magnetic susceptibility and temperature mapping, we can get Tc of sample. In order to determine whether such products exhibit no other phases in colder conditions, we use a specific heat measurements to confirm the CeCo0.9Ru0.1In5 and CeCoIn5 Tc. In Figure 5-20, the black data is copied from paper and compared to my data (red). The two slope are very close and both linear. The Tc is defined by the half of 36.
(43) ∆T. We measured high pressure susceptibility by Be-Cu DAC. We know clearly the pressure and Tc relation. This phenomenon was discovered in a 2002 paper (effect of pressure on CeCoin5). The paper was measured specific heat, but we measured the phenomena by susceptibility. The result is the same.. -0.1. 立. -0.2. y. sit er. 1.9 a 2.0. n. Figure 5-12. io. -0.6 1.8. CeCoIn5 CeCo0.9Ru0.1In5. Nat. -0.5. ‧. -0.4. ‧ 國. -0.3. 政 治 大. 學. χ (emu/Oe-χm3). 0.0. 2.1 2.2 2.3v i l C n hengchi U Temperature (K). 2.4. 2.5. Temperature dependence of susceptibility for CeCoIn5 and CeCo0.9Ru0.1In5. 37.
(44) CeCoIn5 ref. CeCo0.9Ru0.1In5. 1.5 1.0 0.5 0.5. 立. 政 1.5治 2.0 大. 2.5. Temperature (K). Temperature dependence of C/T for CeCoIn5 and CeCo0.9Ru0.1In5. ‧. ‧ 國. 學. y. Nat. io. sit. Figure 5-13. 1.0. n. al. er. C/T (J/mol K2). 2.0. Ch. engchi. 38. i n U. v.
(45) 4.5. CeCoIn5 susceptibility on pressure. -4.4x10⁻⁴. CeCoIn5 0.06 GPa CeCoIn5 0.31 GPa CeCoIn5 0.52 GPa CeCoIn5 0.74 GPa CeCoIn5 0.84 GPa CeCoIn5 0.96 GPa. 政 治 大. -4.6x10⁻⁴. 立 1.75. 2.00. 2.25. 2.50. 學. ‧ 國. χ (emu/Oe-χm3). -4.2x10⁻⁴. ‧. Temperature (K). 2.75. n. al. er. io. sit. y. Nat. Figure 5-14 Temperature dependence of magnetic moment under pressure.. Ch. engchi. i n U. v. Tc(K). 2.50. 2.25 CeCoIn5 ref. slope=0.34811 CeCoIn5 slope=0.35811. 2.00 0.0. 0.4. 0.8. p(GPa) 39. 1.2. 1.6.
(46) Figure 5-15 Temperature dependence of moment for CeCoIn5. Chapter5. Conclusion. The CeCoIn5 single crystal was grown by flux method. In this process, there are some weaknesses. From powder XRD analysis, some crystals are not what we expected. We try to pick the CeCoIn5 sample and measure with XRD. In the XRD pattern, we know the tetragonal structure and the preferred 00L planes. It is a well-. 政 治 大. known single crystal structure of CeCoIn5.. 立. In order to determine the characteristics of this material, we made electrical and. ‧ 國. 學. magnetic measurements of CeCoIn5. From the resistivity picture, we discovered the relative minimum at 180 K, and we have maximum at about 48 K. For getting critical. ‧. current, it was measured by scanning current at 1.8 K. The 2000 μA was confirmed to. y. Nat. sit. be the critical current, after 2000 μA linear current dependence of resistivity was. n. al. er. io. revealed. We get the best signal and the minimum current at 300 μA. Using the 300. i n U. v. μA to measure the resistivity, we know Tc = 2.26 K. From the magnetic measurements,. Ch. engchi. Tc was observed to be about 2.2 K, which has an extra 10 Oe field. Both of the evidences corresponded to the CeCoIn5 basic characteristics. To change the electron density, we substituted Co by Ru. We made five kinds of proportions and compared with CeCoIn5. In XRD analysis, we got a lattice constant for each sample. Ru-doped concentration from 0 to 0.3 has a significant proportion of the doping concentration with increasing lattice constants. Analyzing the Ru-doped sample with concentration ratio of 0.1 using XRD analysis, we get a 00L crystal surface and CeCoIn5 structures. In the CeCo0.9Ru0.1In5 susceptibility measurements, we determined Tc to be 2.14 40.
(47) K. In contrast with CeCoIn5, Tc moved obviously toward low temperatures. In order to check the CeCo0.9Ru0.1In5, we know Tc to be about 2.04 K from specific heat measuremnts. As CeCoIn5, Tc moves to lower temperatures with the same trend. From the literature, we know pressure effects on CeCoIn5; as the pressure increases, so does Tc. For susceptibility measurements same results were obtained. We obtained. Tc =2.1 K at 0.06. GPa; as the pressure is increased to 1 GPa, the phase. transition temperature shifts to approximately 2.3 K.. 立. 政 治 大. ‧. ‧ 國. 學. n. er. io. sit. y. Nat. al. Ch. engchi. 41. i n U. v.
(48) Reference [1] N. D. Mathur et al., Nature (London) 394, 39 (1998); Ar. Abanov, A.V. Chubukov, and A. M. Finkel’stein, Europhys. Lett. 54, 488 (2001) [2] O. Trovarelli et al., Phys. Rev. B 56, 678 (1997) and references therein; H. Q. Yuan et al., Science 302, 2104 (2003); Phys. Rev. Lett. 96, 047008 (2006) [3] P. G. Pagliuso et al., Phys. Rev. B 64, 100503(R) (2001); J. R. Jeffries et al., Phys. Rev. B 72, 024551 (2005); A. D. Christianson et al., Phys. Rev. Lett. 95, 217002 (2005) [4] E. D. Bauer et al., Phys. Rev. Lett. 94, 047001 (2005); M. Daniel et al., Phys. Rev. Lett. 95, 016406 (2005) [5] E. D. Bauer et al., Physica (Amsterdam) 378B–380B, 142 (2006) E. Moshopoulou et al., J. Solid State Chem. 158, 25 (2001). 政 治 大. [6] D. Hall et al., Phys. Rev. B 64, 064506 (2001); 64, 212508 (2001); H. Shishido et al., J. Phys. Soc. Jpn.. 立. 71, 162 (2002). ‧ 國. 學. [7] G. Sparn et al., Physica B 312-313 (2002) 138-139. Figure 3.3.1-1 http://archive.siliconchip.com.au/cms/A_111860/article.html. ‧. n. er. io. sit. y. Nat. al. Ch. engchi. 42. i n U. v.
(49)
數據
+7
Outline
相關文件
In 2006, most School Heads perceived that the NET’s role as primarily to collaborate with the local English teachers, act as an English language resource for students,
Wang, Solving pseudomonotone variational inequalities and pseudocon- vex optimization problems using the projection neural network, IEEE Transactions on Neural Networks 17
volume suppressed mass: (TeV) 2 /M P ∼ 10 −4 eV → mm range can be experimentally tested for any number of extra dimensions - Light U(1) gauge bosons: no derivative couplings. =>
Let T ⇤ be the temperature at which the GWs are produced from the cosmological phase transition. Without significant reheating, this temperature can be approximated by the
Define instead the imaginary.. potential, magnetic field, lattice…) Dirac-BdG Hamiltonian:. with small, and matrix
• Formation of massive primordial stars as origin of objects in the early universe. • Supernova explosions might be visible to the most
(Another example of close harmony is the four-bar unaccompanied vocal introduction to “Paperback Writer”, a somewhat later Beatles song.) Overall, Lennon’s and McCartney’s
Microphone and 600 ohm line conduits shall be mechanically and electrically connected to receptacle boxes and electrically grounded to the audio system ground point.. Lines in
