A Two-Layer Data Model for Image Retrieval Systems
8
0
0
全文
(2) the ith feature vector, 1 ≤ i ≤ K. The image layer defines the composition of an image. The image model is a four-tuple: (I, O, R, g) where I is a raw image data, e.g. GIF or JPEG images. O is a set of objects segmented from the image I and each object is modeled by a triple as the object layer. R is a set of the relations among the objects in O, e.g. spatial relationships. g is a mapping function of the relations among the objects in I, g : O × O → R.. 3. Feature extraction The first issue in the model is image segmentation. The extraction of features in an image depends on a good segmentation. Many segmentation approaches have been proposed in the past [14]. In our system, we modify Lin's approach [8] to segment color images into the best number of regions. First, the image is partitioned into blocks of size Xb×Yb. Each block is assigned a representative color, which is the mean value of colors for all pixels in the block. We set each block to be an individual region initially. Then each block is merged with its neighboring blocks having the smallest color difference into a new region. Such process is iterative until only one region remains. For determining the best number of segmented regions, the performance index Qk [5] is defined as the sum of mean square errors between the image of the k segmented region and the original image. The best segmentation will be found while ρ(k) is maximum, where k > 0, and ρ=. Qk −1 − Qk Qk − Qk +1. .. After the segmentation, the low-level features in each object will be extracted. The different kinds of image features including color, shape and texture can be considered to describe the content of each object. In the proposed system, we select color and shape features only. For capturing human visual sense, the CIE LUV color space is applied to be the representative color feature of each region. The final color value [L, u, v] for each region is saved as the color feature. About the feature of shapes, the set of invariant moments proposed by Hu [6], {φ1, φ2, φ3, φ4, φ5, φ6, φ7}, is used to be the shape descriptors. Thus, the representations of the object layer in our system are. F = { f1 , f 2 }× f1 (Oi ) = Li , ui , vi ,. object O2 for an image I with the set of objects O ={O1, O2}. The 2D String [1] is the most famous representation for describing spatial relations. However, the 2D String only supports similarity matching of three types and represents spatial relationships as symbolic strings, it is hard to be combined with the other numerical features like color and shape in our system. To merge various image features as a single ranking function, we modify the vector-based approach[3] as the spatial measuring method in our system. We describe the vector-based spatial matching approach proposed by Chien [3] in the following briefly. Assume that there are two objects Oi and Oj segmented from an image. Let (pxi, pyi) and (qxi, qyi) denote the bottom-left and top-right coordinates of minimum boundary rectangle (MBR) containing Oi. (Dxij, Dyij) are defined as the vector from Oi to Oj. Dxij = pxj – pxi and Dyij = pyj – pyi. Let Oi be the referential object, we define the following parameters: Ixi = |qxi – pxi|,Iyi = |qyi – pyi| ;. αx =. Dxij. Ixj , Dy Iy α y = ij , β y = j , Ixi Ixi Iyi Iyi α + βy . α + βx , γx = x γy = y βx + 1 βy +1 , βx =. The relative distance between the objects Oi and Oj on x-axis and y-axis are f(Xij) and f(Yij), respectively. f(Xij) and f(Yij) can be used to measure the spatial similarity. They are defined as: ì 1 if α x + β x < 0 ; ï (1 − γ ) x ï ï 1 f ( X ij ) = í(1 − ) + 3 if α x > 1 ; γ x ï ï 2γ x + 1 otherwise ; ï î. ì 1 if α y + β y < 0 ; ï (1 − γ ) y ï ï 1 f (Y ij ) = í(1 − ) + 3 if α y > 1 ; γy ï ï2γ + 1 otherwise. ï y î. f 2 (Oi ) = φ1 , φ2 , φ3 , φ4 , φ5 , φ6 , φ7 ,. After extracting the image features, the objects and corresponding features are represented by multi-dimensional attributes as follows:. where Oi is the marked ith object in the image after segmentation.. [Image_id, Object_id, Feature_list].. In the image layer, spatial relationship is used to model the relations among the segmented objects of an image. For example, the set of spatial relationships is R, R = {east, south, west, north, southeast, southwest, northeast, northwest} and g(O1,O2) = north; it means that the object O1 is north of the. Image_id is the identity of an image, Object_set is the set of objects contained in the image, and Feature_list is the features of each object in the image. In our system, the features in Feature_list are [L, u, v, φ1, φ2, φ3, φ4, φ5, φ6, φ7, px, py, qx, qy]. [L, u, v] and [φ1, φ2, φ3, φ4, φ5, φ6, φ7] are the features of color and moments as described earlier. The (px, py) and (qx, qy) are the bottom-left and top-right locations of object’s MBR. The above features will be able to be easily indexed by high-dimensional data.
(3) structures such as K-D tree or R-tree to improve the performance of access.. 4. Query processing and similarity measure About the image query phase, the user interface in our system supports two query methods for users: 1.. Query by image example: The user gives a sample picture to the system, and the system will find the images which are similar to the sample image.. 2.. Query by sketch: If the user cannot yield any proper picture as a query picture on his hand, our system allows users to specify the query by drawing the sketch roughly. While a query image is given, the same processes of feature extraction are performed. The extracted features of the query image are then compared with the features in the feature database by the similarity measure algorithms. Since the proposed model has two layers, the similarity measure includes two main matching algorithms. The first algorithm is to find the best matching of object-pairs between the query image and the target image in the object layer. The second algorithm gives the overall similarity measure of images including the object layer and the image layer. The goal of the object-pair matching algorithm is to find the best object-pairs whose objects belong to the query image and the target image respectively. Assume that there are m objects in query image Q denoted as O1, … , Om, and a target image T in which contains n objects denoted as O'1 ,…, O'n. The best object-pairs are found by the following steps: Step 1: Constructing a matrix Dmn of size m × n, Dmn = [dij] m×n, 1 ≤ i ≤ m, 1 ≤ j ≤ n, where dij is an element in the matrix which stands for the dissimilarity between ith object Oi in the query image Q and the jth object O'j in the target image T. The dij is defined as. (φ kO − φ kO ' δ 2 (O i , O ' j ) = å k =1 7. i. j. ). 2. .. The ∆1(Oi, O'j) and ∆2(Oi, O'j) are the normalized dissimilarity of δ1(Oi, O'j) and δ2(Oi, O'j), respectively. The detailed algorithm is listed as follows. Algorithm: object-pairs matching algorithm Input: the color and moment features of pictures P1 and P2 Output: the set of object-pair { for i = 1 to m for j = 1 to n K. compute Dmn, d[i, j] = å wik ∆k (Oi , O' j ) ; k =1. }. object-pair = ∅ ; k = 1; d[a,b] = min{d[i,j] | 1 ≤ i ≤ m, 1 ≤ j ≤ n}; While (k ≤ min(m,n)) and (d[a,b] ≤ MIN_DIS) // MIN_DIS is a specified { // minimum degree of dissimilarity object-pair = object-pair ∪ {(Oa,Ob)}; for j = 1 to n d[a,j] = ∞; for i = 1 to m d[i,b] = ∞; k = k + 1; d[a,b] = min{d[i,j] | 1 ≤ i ≤ m, 1 ≤ j ≤ n}; }. After object-pairs are found, the similarity of two pictures is measured by the similarity matching algorithm. In addition to the image features in the object layer, this algorithm also considers the spatial relationships among the objects in the image layer. The similarity matching algorithm is shown as the following steps.. K. d ij = å wik ∆k (Oi , O' j ) , k =1. where ∆k(Oi, O'j) is the normalized dissimilarity between Oi and O'j of the kth feature fk in the object layer, and wik is the weight of feature fk for the object Oi in the query image. Step 2: Let min{dij} be the minimum element of Dmn. If min{dij} is found in i = a and j = b, the object Oa in Q and the object O'b in T will be grouped into an object-pair. Step 3: Discarding the ath raw and the bth column in Dmn, we get a new matrix D(m-1)(n-1). The Step 2 is repeated on the new matrix until all objects in either image Q or image T have been matched or the remaining values in D(m-1)(n-1) are too large. The dissimilarity of an object-pair is measured by their representative colors and shape descriptors. Let <L, u, v> be the vector of feature f1 and the seven invariant moments <φ1, φ2, φ3, φ4, φ5, φ6, φ7> be the vector of feature f2. The dissimilarity of f1 and f2 are defined by the measure functions δ1 and δ2: 2 2 2 δ 1 (Oi ,O' j ) = (Li − L' j ) + (ui − u' j ) + (vi − v' j ) ,. Step 1:. Assume that the object-pair matching algorithm finds r object-pairs for the given two images P1 and P2. The set of object-pairs is { (O1P , O1P ), (O2P , O2P ),K, (OrP , OrP ) }. 1. Step 2:. 2. 1. 2. 1. 2. The dissimilarity between pictures P1 and P2, denoted Dis(P1,P2), is computed by K. Dis ( P1 , P2 ) = å W k Ψk ( P1 , P2 ) + W R Γ ( P1 , P2 ) , k =1. r. where Ψk ( P1 , P2 ) = å ∆k (OiP1 , OiP2 ) i =1. r −1. r. and Γ ( P1 , P2 ) = å å ϕ (O ijP1 , O ijP2 ) . i =1 j = i + 1. For two distinct pictures P1 and P2, assume that they both consist of two objects Oi and Oj. The ∆k(OiP1, OjP2) is defined as above. The ϕ (OijP1, OijP2) is defined as the normalized dissimilarity of spatial relationship between (OiP1, OjP1) and (OiP2, OjP2). The ϕ (OijP1, OijP2) is the Euclidean distance of the spatial relative distances [ f X ijP1 , f YijP1 ] and [ f (X ijP2 ) , f YijP2 ].. ( ) ( ). ( ).
(4) = WK = WR = 1/(K+1) or W1+W2+ . . . +WK = WR = 0.5, and the ∆ jik in the update formulas has to be replaced by ψ kj and Γ .. 5.1. The update of weights in the object layer. The goal of the object layer is to find the best object-pairs of the query image and the target image for satisfying the user’s visual perception. For example, a user prefers an object with a shape of triangle in the image. However, in the initial measure may concern the same importance of color and shape features. The image with triangle objects may not match the objects with the similar shape owing to the domination of a large color difference. To overcome this problem, the weights of features should be refined using the user’s relevance feedback information. We give the same value to the weights of different features initially while the first measuring is made. Assume that there are r objects in the query image and the number of features used in the object layer is K. Let ϖikt be the weight of the kth feature for the ith object at the tth feedback time, 0 ≤ ϖikt ≤ 1 and ϖi1t+ϖi2t+ . . . +ϖiKt = 1. Thus,. ϖ ik0 = 1 / K ,. for 1 ≤ i ≤ r and 1 ≤ k ≤ K.. For each feedback processing, the user marks the images as 'yes' if the image is relevant or 'no' if the image is irrelevant. Then, the weights in the object layer will be updated as the following formulas:. σ. t +1 ik. æ å ∆ jik − å ∆ jik ç t j = yes j = no = çϖ ik + j å ∆ ik + å ∆ jik ç j = yes j = no è. ö ÷ ÷, ÷ ø. ϖ ikt +1 = æç σ ikt +1 / å σ ijt +1 ö÷ , j =1 è ø K. where. no ∆yes ik and ∆ ik denote the dissimilarity of the objects in. the images marked 'yes' and 'no' respectively. 5.2. The update of weights in the image layer. The same problem in the object layer will occur at the image layer. In an image, the features of objects and the relations among objects should be considered in the image layer simultaneously. The update of weights thus includes the features of objects and the spatial relationship among objects in images. The update method is similar to the object layer except the spatial relationships. The weights of features Wk and WR can be initialized to be W1 = W2 = . . .. 0 1 2. 6. Experimental results For demonstrating the efficiency and effectiveness of the proposed approach, we build a prototype system on PC/Win98. The total number of tested images is about 2500. Types of the images include about 1000 images of photographs with the same size of 256×256 and about 1500 images of trademark with different size. First, the test images are segmented and the features are extracted by the system automatically. Then the features are stored in the feature database as the representation form in Section 3. We made two different experiments. The first experiment gives a trademark as the query image and evaluates the effectiveness by precision-recall model. Owing to the limitation of the paper length, we only show the evaluation results in Table 1 and Figure 1. There are three retrieving processes totally including two feedback processes. The result of the first feedback retrieval improves the original measuring and the second feedback retrieval improves the first feedback retrieval indeed. The second experiment gives two sketches as shown in Figure 2 and Figure 5 to be the query images. Figure 2 is the face-like sketch drawn by the user. Figure 3 is the first retrieval result. We then mark the relevant images as 'O' and the irrelevant images as 'X'. After the marking, the result of the first feedback retrieval is shown in Figure 4. The changes of weights in image layer are listed in Table 2. WC, WS and WR stand for the weights of color, shape and spatial relationship respectively. It depicts that the spatial relationship is more important than others features. For the other image in Figure 5, the relevant retrieval results are shown in Figure 6, Figure 7 and Figure 8. Since we select the images with the similar color and spatial relationships in the feedback processes, the final result shows that the weights of features response the fact and the images with the similar objects can be found effectively. From the experiments, the system based on the proposed two-layer model can behave more effective than the model with single layer like MARS[12,13]. Furthermore, the number of features used in two-layer model is less than the one-layer model. The processing time of features extraction can be saved, the efficiency is thus improved.. Precision(%) 60 52 50 51 48 Recall 0.12 0.17 0.20 0.32 0.38 Precision(%) 80 61 50 48 47 Recall 0.19 0.22 0.24 0.33 0.42 Precision(%) 100 90 84 51 48 Recall 0.2 0.4 0.62 0.7 0.74 Table 1: Precision and recall for Trademark query.. 44 0.51 45 0.53 45 0.7. 48 0.62 47 0.61 42 0.8.
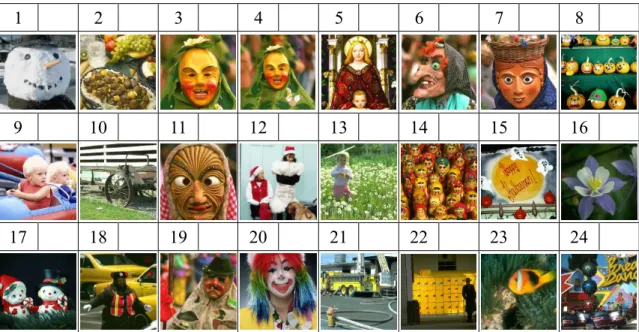
(5) 1. Precision Query Result. 0.8. 1st Feedback 2nd Feedback. 0.6 0.4 0.2 0. Recall 0. 0.2. 0.4. 0.6. Figure 2: The ‘face’ query image.. 1. O. 9. 17. 2. 10. X. 18. X. 0.8. Figure 1: Precision-recall for Trademark query.. Feedback. WC. WS. WR. 0. 0.3333. 0.3333. 0.3333. 1. 0.3545. 0.2118. 0.4337. Table 2: The update of weights in ‘face’ query. 3. X. 4. 5. O. 6. 11. X. 12. 13. O. 14. 19. O. 20. 21. O. 22. O. O. 7. X. 15. O. Figure 3: The initial retrieval result of ‘face’ query.. 23. O. 8. X. 16. X. 24. X.
(6) 1. 2. 3. 4. 5. 6. 7. 8. 9. 10. 11. 12. 13. 14. 15. 16. 17. 18. 19. 20. 21. 22. 23. 24. Figure 4: The first feedback result after the marking of Figure 3. Figure 5: The ‘circle’ query image.. Feedback. WC. WS. WR. 0. 0.3333. 0.3333. 0.3333. 1. 0.4146. 0.2251. 0.3602. 2. 0.4986. 0.2000. 0.3014. Table 3: The update of weights in ‘circle’ query.. 1. O. 2. O. 3. O. 4. O. 5. 6. 9. X. 10. O. 11. O. 12. O. 13. 14. 15. 16. 21. 22. 23. 24. 17. 18. 19. 20. X. Figure 6: The initial retrieval result of ‘circle’ query.. 7. X. 8. X.
(7) 1. O. 2. 9. O. 10. 11. 18. 19. 17. 3. O. O. X. 4. O. 5. O. 6. O. 7. X. 8. 12. 13. 14. 15. 16. 20. 21. 22. 23. 24. X. Figure 7: The first feedback result after the marking of Figure 6. 1. 2. 3. 4. 5. 6. 7. 8. 9. 10. 11. 12. 13. 14. 15. 16. 17. 18. 19. 20. 21. 22. 23. 24. Figure 8: The second feedback result after the marking of Figure 7. 7. Conclusions Content-based image retrieval is one of the most important techniques for retrieving multimedia data. It is difficult for researchers to create the so called fully automatic image retrieval to capture human perception. The previous researches proposed the interactive retrieval approach focusing on the different features of images and similarity metrics. In this paper, we motivate a two-layer data model including the object layer and the image layer. We propose an object-based interactive retrieval method to reduce. the gap between human high-level concept and the low-level features of images. The two-layer similarity measure algorithms are given to find the similar images from image databases and a relevance feedback mechanism is developed to adjust the weights of measure functions in the object layer and the image layer. The experimental results also show that the proposed approach is effective and efficient. The future work on expanding the object with visual perception to integrate with human conceptual semantics is under investigated..
(8) References [1] [2] [3]. [4]. [5] [6] [7] [8] [9]. [10] [11]. [12]. [13]. [14]. [15]. S. K. Chang, Q. Y. Shi and C. W. Yan, “Iconic indexing by 2D-String”, IEEE Transactions on Pattern Analysis and Machine Intelligence, Vol 9, NO 3, pp413-428,1987 C. C. Chang, “Color Image Retrieval Based on 2D String”, Master thesis, Department of Computer Science, National Tsing Hua University, Taiwan, 1998. B. C. Chien and P. C. Chieng, “A New Approach of Similarity Measurement for Iconic Image Retrieval”, in Proceeding of International Conference on Computational Intelligence and Multimedia Applications, 9-11, Feb. 1998, Churchill, Australia. P. C. Chieng, B. C. Chien, “A New Similarity Metric Based on 2D Vector for Iconic Image Retrieval”, in Proceedings of 1998 International Computer Symposium, Workshop on Software Engineering and Database Systems, 16-19, Dec., 1998, Tainan, Taiwan, pp.85-92 . D., Duta and P. Hart, Pattern Classification and Scene Analysis, Wiley, New York, 1973. J. D. Foley, A. V. Dam, S. K. Feiner, and J. F. Hughes, “Computer Graphics: principles and practice,” 2nd edition in C, Addison-Wesley, 1996. R. C. Gonzalez and R. E. Woods, “Digital Image Processing”, third edition, Addison-Wesley, Reading, MA, 1992. H. C. Lin, L. L. Wang, and S. N. Yang, “Color image retrieval based on hidden Markov models,” IEEE Transactions on Image Processing, Vol. 6, No. 2, 1997. W. Niblack, R. Barber, W. Equitz, M. Flickner, E. Glasman, D. Petkovic, P. Yanker, and C. Faloutsos, “The QBIC project: querying images by content using color, texture, and shape,” Research Report, No. 9203, IBM Almaden Research Center, 1993. A. K. Jain and A. Vailaya, “Image Retrieval Using Color and Shape”, Pattern Recognition, Vol. 29, No. 8, pp. 1233-1244, 1996. B. M. Mehtre, M. S. Kankanhalli and W. F. Lee, “Content-Base Image Retrieval Using A Compost Color-Shape Approach”, Information Processing And Management , Vol. 34, Issue. 1, 1998 , pp. 109-120 Y. Rui, T. S. Huang, and S. Mehrotra, Relevance Feedback Techniques in Interactive Content-Based Image Retrieval, in Proceedings of IS&T and SPIE Storage and Retrieval of Image and Video Databases VI , January 24-30, San Jose, CA, 25-36, 1998. Y. Rui, T. S. Huang, M. Ortega, and S. Mehrotra, Relevance Feedback: A Power Tool in Interactive Content-Based Image Retrieval, IEEE Trans. on Circuits and Systems for Video Technology , Special Issue on Segmentation, Description, and Retrieval of Video Content, Vol. 8(5), 644-655, 1998.` Y. Rui, T. S. Huang, and S. F. Chang, Image Retrieval: Current Techniques, Promising Directions and Open Issues, Journal of Visual Communication and Image Representation, Vol. 10, 1-23, 1999. J. R. Smith and S. F. Chang, Visually Searching the Web for Content, IEEE Multimedia, Vol. 3, 12-20..
(9)
數據


相關文件
H.. In contrast to the two traditional mechanisms which all involve evanescent waves, this mechanism employs propagating waves. This mechanism features high transmission and
For the data sets used in this thesis we find that F-score performs well when the number of features is large, and for small data the two methods using the gradient of the
Microphone and 600 ohm line conduits shall be mechanically and electrically connected to receptacle boxes and electrically grounded to the audio system ground point.. Lines in
We showed that the BCDM is a unifying model in that conceptual instances could be mapped into instances of five existing bitemporal representational data models: a first normal
Our main goal is to give a much simpler and completely self-contained proof of the decidability of satisfiability of the two-variable logic over data words.. We do it for the case
• Learn the mapping between input data and the corresponding points the low dimensional manifold using mixture of factor analyzers. • Learn a dynamical model based on the points on
“A feature re-weighting approach for relevance feedback in image retrieval”, In IEEE International Conference on Image Processing (ICIP’02), Rochester, New York,
Mehrotra, “Content-based image retrieval with relevance feedback in MARS,” In Proceedings of IEEE International Conference on Image Processing ’97. Chakrabarti, “Query
