The Journal of Agricultural
Science
cambridge.org/ags
Climate Change and
Agriculture Research Paper
Cite this article:Su J-J, Chung H-C (2021). Study of livestock biogas upgrading using a pilot-scale photocatalytic desulphurizer followed by a hollow fibre carbon dioxide adsorption module. The Journal of Agricultural Science 1–8. https://doi.org/10.1017/ S0021859621000332 Received: 18 June 2020 Revised: 20 February 2021 Accepted: 22 March 2021 Key words:
Biogas upgrading; biomethane; hollow fibre adsorption; livestock biogas; photocatalytic desulphurization
Author for correspondence: Jung-Jeng Su, E-mail:jjsu@ntu.edu.tw
© The Author(s), 2021. This is an Open Access article, distributed under the terms of the Creative Commons Attribution licence (http:// creativecommons.org/licenses/by/4.0/), which permits unrestricted re-use, distribution, and reproduction in any medium, provided the original work is properly cited.
Study of livestock biogas upgrading using a
pilot-scale photocatalytic desulphurizer
followed by a hollow fibre carbon dioxide
adsorption module
Jung-Jeng Su1,2 and Hsin-Cheng Chung1
1
Department of Animal Science and Technology, National Taiwan University, Taipei, Taiwan, ROC and2Bioenergy Research Center, College of Bioresources and Agriculture, National Taiwan University, Taipei, Taiwan, ROC
Abstract
The objective of this project is to integrate a domestic photocatalytic desulphurization facility with a biogas upgrading module and try to develop a system for biogas desulphurization and upgrading under ambient conditions. Four photocatalytic desulphurization reactors (PDRs) and one activated carbon reactor (ACR) were applied for biogas desulphurization and filtra-tion under ambient condifiltra-tions. Moreover, a hollow fibre carbon dioxide (CO2) adsorption
module was applied for biogas upgrading. The operation pressure of the PDR and ACR was under ambient pressure. Results showed that hydrogen sulphide removal efficiency of the photocatalytic desulphurizer was about 0.99–1.00 (v/v) under the inlet biogas flow less than 5 litres/min and the concentration of inlet hydrogen sulphide was lower than 5600 mg/m3. For desulphurized biogas upgrading, the removal efficiency of CO2was higher
than 0.90 (v/v) under the outlet biogas flow was 1 litre/min (i.e. inlet biogas flow was about 2 litres/min). However, the ratio of methane in the upgrading biogas was lower than 0.90 (v/v). Thus, nitrogen gas removal cartridges will be integrated with the biogas upgrading module to promote methane concentration in the upgraded biogas.
Introduction
The novel photocatalytic wastewater treatment system was developed and applied for dairy cattle wastewater treatment with a simple titanium dioxide (TiO2) sol–gel preparation protocol by the
research team of National Taiwan University (NTU) (Su et al.,2018). The photocatalytic treat-ment technique (ultraviolet/titanium dioxide/silicon dioxide (UV/TiO2/SiO2)) had been applied
to treat certain sulphur-containing compounds such as hydrogen sulphide (H2S), C2H6S
(dimethyl sulphide, DMS) and C2H6S2 (dimethyl disulphide, DMDS) (Canela et al., 1998;
Nishikawa and Takahara,2001). Based on the study of Canela et al., the catalyst, TiO2, was
coated onto the internal glass surface of the photocatalytic reactor (TiO2film thickness = 5.3
μm) using an aqueous slurry, followed by drying with hot air. The photocatalytic reactor with a 30 W black light lamp (wavelength = 365 nm and the irradiation strength = 4.5 mW/cm2) was applied and the interior reactor was filled with 0.21 (v/v) oxygen (O2) under the humidity
⩾0.23 (v/v) for H2S removal. Results showed that the H2S removal efficiency was higher than
0.99 (v/v) when the inlet H2S concentrations of 46.2–1197 mg/m3 under sufficient O2
condi-tions. However, there was about 0.95 (v/v) of sulphate adsorbed on the TiO2 surface of the
reactor and only about 0.0002 (v/v) of sulphate ion was detected in the reactor effluent when the reactor was working under higher H2S concentrations (e.g. 840 mg/m3) (Canela et al.,1998).
The photocatalytic activity of three semiconductor catalysts (tungsten trioxide (WO3), TiO2
and NiO (nickel oxide)) for the conversion of methane (CH4) into methanol at room
tempera-ture with an ultraviolet (UV) laser (355 nm) in the aqueous solution has been investigated. The maximum percentage conversions (v/v) of 0.29, 0.21 and 0.20 were observed for WO3, TiO2
and NiO, respectively (Gondal et al.,2004). Moreover, Fourier-transform infrared spectros-copy has been employed to investigate the adsorption and photo-oxidation of CH4over
pow-dered TiO2. The interaction between the CH4and TiO2surface is weak. It is found that no
CH4 molecules are adsorbed on the surface at 35 °C in a vacuum. Under UV irradiation,
CH4decomposes to form carbon monoxide (CO), carbon dioxide (CO2), water (H2O) and
for-mate (HCOO) in the presence of O2(Lien et al.,2004). Thus, CH4is tough to be completely
oxidized to methanol under ambient conditions with TiO2/UV light and the photocatalytic
desulphurization reactor (PDR) of this study may be applied to the livestock farms.
Biogas produced from anaerobic digestion of animal manure wastewater from Taiwan’s livestock farms is comprised of CH4 (0.60–0.76, v/v), CO2 (0.18–0.30, v/v), a trace amount
of H2S and others (Su et al., 2003, 2018). However, some nitrogen was introduced during
Hong,2020). To promote CH4concentration in the
desulphur-ized biogas, a hollow fibre CO2adsorption system was introduced
and applied on a livestock farm for biogas upgrading. Some com-mercial applications were carried out for desulphurized biogas upgrading including (Chen et al., 2015): (1) absorption: water scrubbing, organic physical scrubbing, amine scrubbing and inor-ganic solvent scrubbing; (2) adsorption: pressure swing adsorp-tion, vacuum swing adsorpadsorp-tion, temperature swing adsorpadsorp-tion, electrical swing adsorption; (3) cryogenic separation: it is a distil-lation process operated under very low temperatures (close to −170 °C) and high pressure (around 80 bar). Therefore, for the production of very pure CH4 this technology can be used; (4)
membrane technology (Ibrahim et al.,2018) under various oper-ation pressure (100 mbar–30 bar) and temperature conditions (17–35 °C) (Vogler et al., 2013; Falbo et al., 2014; Žák et al., 2018; Tantikhajorngosol et al.,2019).
The objective was to study the feasibility of combining a novel photocatalytic desulphurization facility with a hollow fibre CO2
adsorption module for biogas upgrading under ambient condi-tions for promoting in situ livestock biogas applicacondi-tions such as power generation and so on. The acceptable H2S in the biogas
for livestock biogas applications was the lower, the better.
Materials and methods Dairy farm biogas for this study
The conventional method of treating piggery wastewater in Taiwan is the three-step piggery wastewater treatment (TPWT) system, involving (1) solid/liquid separation, (2) anaerobic treat-ment and (3) aerobic treattreat-ment (activated sludge basin with a final clarifier) (Su et al.,1997; Su and Chen,2018). The TPWT system is also applied to all dairy farms for treating their waste-water. Thus, dairy biogas from the wastewater treatment facility of the NTU dairy farm was used for this study. Analytical data showed that the average COD, BOD and SS of the dairy waste-water after solid/liquid separation were 4170 ± 255, 1650 ± 910 and 3890 ± 529 mg/l, respectively.
PDR design
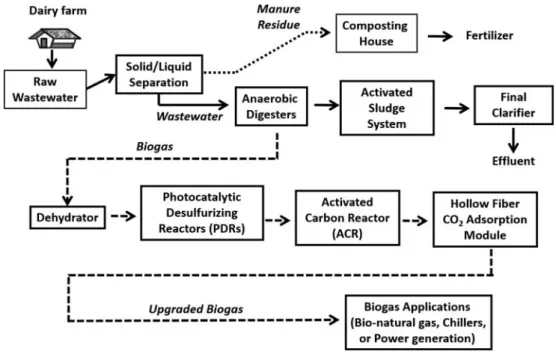
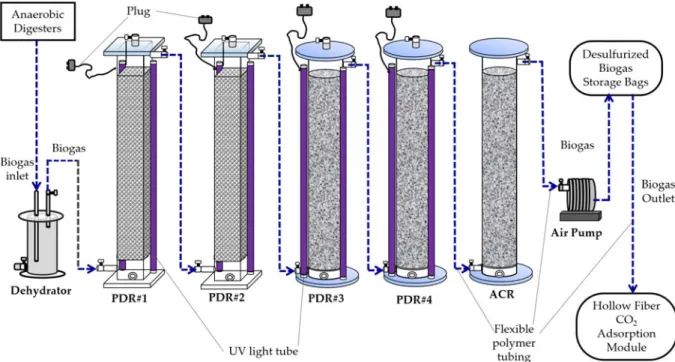
The flowsheet of all processes for biogas production, desulphuriza-tion and upgrading is shown inFig. 1. The PDR was constituted of two acrylic cuboids (130 cm height × 20 cm width × 20 cm length, total volume = 52 litres) and two acrylic cylinders (130 cm height × 20 cm inner diameter, total volume = 41 litres) in series with two UV light tubes (120 cm length, 40 W UV fluorescent blacklight, PULSAR, China) attached to each acrylic cuboid or cylinder (Fig. 2). The aluminium foil sheet was used to cover the surface area of the two acrylic cuboids for reflecting UV light towards the inside of the acrylic cuboids. The two acrylic cuboids were packed with a mixture of Rasching rings (i.e. hollow spherical polypropylene balls) (Sheng-Fa Plastics, Inc., Taiwan) and TiO2-coated light-expanded clay aggregates (LECA) (Su
et al.,2013) (Fig. 2). The surface of the LECA beads was coated with a mixture of TiO2anatase powder and concrete. All PDRs
used for any time course experiments of this study were packed with Rasching rings and TiO2-coated LECA beads.
Untreated biogas entered into the acrylic dehydrator (40 cm height × 19 cm inner diameter, total volume = 11 litres) and then the biogas inlets of the PDRs in sequencing (Fig. 2). There was a 30 cm inlet tubing inside the dehydrator (Su and Hong, 2020). Biogas was mixed with a trace amount of air inside the dehydrator. The acrylic PDRs are directly connected to the biogas outlet tubing of the dehydrator (Fig. 2).
Biogas upgrading system design Activated carbon reactor (ACR) design
The ACR was constituted of an acrylic cylinder (130 cm height × 20 cm inner diameter, total volume = 41 litres). The ACR was packed with a mixture of coconut shell activated carbon pellets (diameter = 5 mm) and Rasching rings (i.e. hollow spherical poly-propylene balls) (Sheng-Fa Plastics, Inc., Taoyuan, Taiwan). The ACR was applied to remove impurities and excessive moisture of the desulphurized biogas. It was followed by the four acrylic PDRs (Fig. 2). The operation pressure of the activated carbon fil-tration reactor was under ambient pressure.
Hollow fibre CO2adsorption cartridge set for biogas upgrading
The hollow fibre CO2adsorption cartridge set was constituted of
one filtration cartridge (47 cm length × 2′′ outer diameter) (AuraMat-TP-HC-A-B, Aura Material Inc., Hsinchu, Taiwan) and five independent hollow fibre CO2 adsorption cartridges
(47 cm length × 2′′ outer diameter) (AuraMat-TP-CO2-A2, Aura Material Inc., Hsinchu, Taiwan) in parallel. For each time course experiment under various biogas flow rate, only one independent cartridge was used individually for CO2 adsorption from
desul-phurized biogas. The operation pressure of the CO2adsorption
cartridge was under ambient pressure. The size of all biogas tub-ing includtub-ing biogas inlet, biogas purgtub-ing and biogas outlet tubtub-ing was 1/4′′ tubing. Biogas flow meters (Tohama 10B; Yeong Shin Co. Ltd, Hsinchu, Taiwan) were installed at the inlet and outlet of the CO2adsorption cartridge set. The pore size of the hollow
fibre surface and adsorption interface was less than 1μm and 0.5−0.8 nm, respectively.
Hollow fibre CO2adsorption module for biogas upgrading
The hollow fibre CO2 adsorption module
(AuraMat-HFDCO2-CH4-1L-VC, Aura Material Inc., Hsinchu, Taiwan) (60 cm width × 75 cm length × 115 cm height, power voltage = 220 V/60 Hz) was constituted of two sets, A and B, of hollow fibre CO2
adsorption cartridges (40 cm length × 3′′ outer diameter) (AuraMat-HTP-CO2-A3, Aura Material Inc., Hsinchu, Taiwan) in parallel. The size of all biogas tubing including biogas inlet, biogas purging and biogas outlet tubing was 1/2′′ tubing. Each set of adsorption cartridge was constituted of five hollow fibre CO2 adsorption cartridges in series. Two gas sampling ports
were installed at the biogas inlet and outlet tubing for periodical biogas sampling. Desulphurized biogas was introduced into the module through a filtration cartridge (AuraMat-TP-HC-A-B, Aura Material Inc., Hsinchu, Taiwan) and the CO2 adsorption
cartridge sets by an explosion-proof vacuum pump (maximum flow rate = 7.5 litres/min, No. N 87 TTE EX, DRF Corporation, Taipei, Taiwan) inside the module. Another filtration cartridge
(AuraMat-TP-MX1-A-C, Aura Material Inc., Hsinchu, Taiwan) for filtering air was also integrated inside the CO2 adsorption
module. The operation pressure of the CO2adsorption cartridge
was under ambient pressure.
The operation process of the hollow fibre CO2 adsorption
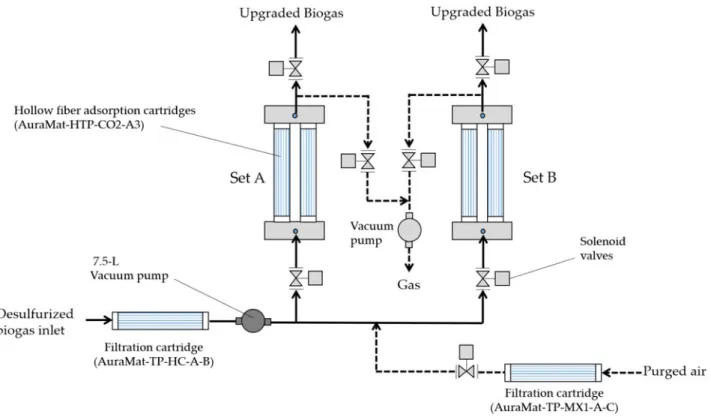
module was as follows in sequence: desulphurized biogas from the storage bags, filtration cartridge (AuraMat-TP-HC-A-B), 7.5 litre vacuum pump, solenoid valves, hollow fibre adsorption car-tridges (AuraMat-HTP-CO2-A3), solenoid valves and then dischar-ging biogas (Fig. 3). Moreover, the regeneration process of the hollow fibre CO2adsorption module was as follows in sequence: purged air,
filtration cartridge (AuraMat-TP-MX1-A-C), solenoid valves, hollow fibre adsorption cartridges (AuraMat-HTP-CO2-A3), solenoid valves, vacuum pump and then discharging gas (Fig. 3).
When hollow fibre CO2 adsorption cartridges of Set A was
saturated, the inlet biogas was automatically shifted to the set B following the operation process for biogas upgrading (i.e. CO2
adsorption process). Simultaneously, the hollow fibre CO2
adsorption cartridges of Set A following the regeneration process was automatically regenerated. Similarly, when hollow fibre CO2
adsorption cartridges of Set B was saturated, the inlet biogas was automatically shifted to Set A for biogas upgrading. Thus, Sets A and B were operated alternatively.
Time-course experiments of photocatalytic biogas
desulphurization and hollow fibre CO2adsorption for biogas upgrading
Photocatalytic biogas desulphurization
The four connected acrylic PDRs under various biogas flow rates carried out photocatalytic desulphurization (0.5, 1, 1.5, 3, 4 and 5 litres/min). The un-desulphurized biogas flew through the inlets and outlets of the PDR#1, #2, #3 and #4, sequentially. Gas sam-ples were taken in triplicates from the inlet of the PDR#1 and the outlet of PDR#4 to perform gas chromatography (GC) ana-lysis and to determine H2S, O2, NH3 and SO2 on-site using a
Fig. 2.Sketch and flowchart of the photocatalytic desulphurizing reactor (PDR) in coordination with a biogas upgrading system consisting of an activated carbon reactor (ACR) and a hollow fibre carbon dioxide (CO2) adsorption module.
portable gas detector and detector tubes with a gas-sampling pump. The initial inlet H2S in biogas was 4760 ± 594−5554 ± 82 and
4558 ± 672−5554 ± 80 mg/m3under the flow rate of 0.5−5 litres/min in Tables 1 and 2, respectively. The acrylic PDRs were flushed with water (41 litres/each reactor) from the top of the PDRs and then soaked for a 2 h duration when some sulphur appeared on the surface of TiO2-coated LECA beads after completion of the
time course experiments under various biogas flow rates. This process was repeated until most sulphur was washed out from the surface of LECA beads.
Biogas upgrading using independent hollow fibre CO2 adsorption cartridge set
Desulphurized biogas was introduced into the biogas filtration cartridge (AuraMat-TP-HC-A-B, Aura Material Inc., Hsinchu, Taiwan) and then the independent hollow fibre CO2adsorption
cartridges#1–#5 (AuraMat-TP-CO2-A2, Aura Material Inc., Hsinchu, Taiwan) through a 1/4 HP air pump for time-course experiments of CO2 removal from the desulphurized biogas.
Biogas samples were taken periodically only from the inlet and outlet of the biogas filtration cartridge as the control set. Moreover, all other biogas samples were taken periodically from the inlet of the biogas filtration cartridge and outlet of the inde-pendent hollow fibre CO2 adsorption cartridges under various
biogas flow rates as the experimental sets. Biogas samples were taken from the sampling ports with 1/8′′ silicone tubing of the independent hollow fibre CO2 adsorption cartridge set using a
manual gas sampler (Vac-U-Tube, SKC Inc., PA, USA) connect-ing with 1 litre gas samplconnect-ing bags (SKC Cat. No. 232-01, SKC Inc., PA, USA). The operation process of the time course experiments was described as follows: biogas samples were taken at 10 min intervals in an hour using the adsorption CO2 cartridge#1 from
the inlet of the filtration cartridge and the outlet of the adsorption cartridge#1 under the outlet biogas flow rate of 1 l/min (i.e. inlet biogas flow rate about 2 litres/min). The rest of the time-course experiments were carried out using the independent adsorption cartridge#2–#5 under the outlet biogas flow rates of 1.5, 2, 2.5 and 3 litres/min, respectively, at 10 min intervals in an hour. The contents, CH4, CO2and N2, of all biogas samples were determined
by using GC with a thermal conductivity detector (GC/TCD).
Biogas upgrading using hollow fibre CO2adsorption module with automatic regeneration
The hollow fibre CO2adsorption module had to be warmed up at
least 2.5 h and then another 2.5 h for filling up biogas inside the cartridges of the CO2adsorption module before starting any
time-course experiments. Desulphurized biogas was introduced into the biogas filtration cartridge (AuraMat-TP-HC-A-B, Aura Material Inc., Hsinchu, Taiwan) and then through three inde-pendent hollow fibre CO2 adsorption cartridges
(AuraMat-HTP-CO2-A3, Aura Material Inc., Hsinchu, Taiwan) of the Set A or B through an explosion-proof vacuum pump (maximum flow rate = 7.5 litres/min, No. N 87 TTE EX, DRF Corporation, Taipei, Taiwan) inside the adsorption module for time-course experiments of CO2 removal from the desulphurized biogas.
Biogas samples were taken at 10 min intervals in an hour from the inlet and the outlet of the CO2adsorption cartridge module
under the outlet biogas flow rates of 1−5 litres/min (i.e. inlet bio-gas flow rate about 2−10 litres/min). The hollow fibre CO2
adsorption cartridges of Sets A and B were operated alternatively and regenerated automatically based on the signals on the control panel. Biogas samples were taken at 10 min intervals in an hour from the inlet and outlet of the adsorption cartridge module under various outlet biogas flow rates. The contents, CH4, CO2
and N2, of all biogas samples were determinedby using GC/TCD.
Fig. 3.Flow chart of the hollow fibre carbon dioxide (CO2) adsorption module including operation process (in solid lines) and regeneration process (in dashed
Analysis
H2S determination in biogas samples
The gas samples were used to measure the concentrations of H2S
from the inlets and outlets of the PDRs on-site using a portable multi-gas detector (ISC MX series, Industrial Scientific Co., PA, USA). When the concentrations of H2S were over the detection
limit of the portable multi-gas detector (sensor: H2S: 0–697 mg/m3,
SO2: 0–393 mg/m3, O2: 0–0.30 (v/v), NH3: 0–348 mg/m3), a gas
sampling pump (GV-100C gas sampling pump; Gastec Co., Japan) with H2S detector tubes (H2S = 14–5575 mg/m3) (Gastec Co.,
Kanagawa, Japan) was applied for H2S detection.
CH4, CO2and nitrous oxide determination in biogas samples
Biogas samples from the inlets and outlets were collected in 1 litre Tedlar® bags (SKC, PA, USA) with a single polypropylene fitting. This fitting contained a Teflon® syringe port lined septum and a hose connection, which functioned as a shut-off valve for incoming and outgoing gas. Meanwhile, a 500 ml gas collector (GL Sciences Inc., Tokyo, Japan) was used to withdraw gas samples from the inlets and outlets of the PDRs. Biogas samples were analysed for their composition by GC (Master GC, DANI Instruments, Marlborough, MA, USA), which was equipped with a TCD and Carboxen 1010 PLOT capillary column (30 m × 0.53 mm × 0.25 μm film thickness; Supelco Analytical of Sigma-Aldrich Co., PA,
USA) (Su and Chen, 2018). Calibration curves of CH4, CO2and
nitrogen gas were obtained by the external standard method, and the calibration curves correlation coefficient was >0.9974.
Statistical analysis
Time-course experiments were conducted in triplicate. One-way analysis of variance was performed using Origin 9.1 software to compare the results using Tukey’s test with a significance level of 0.05. The linear regression analysis was applied between biogas flow rate and removal efficiency of H2S or CO2in each gas when
the removal efficiency was significantly different.
Results and discussion
Biogas desulphurization using PDR
The inlet H2S in untreated biogas was 4558 ± 672−5554 ± 80 mg/m3
and the outlet H2S in desulphurized biogas was 0−21 ± 36.0 mg/m3.
Moreover, the H2S removal efficiency was about 0.99−1.00 (v/v)
under various biogas flow rates (Table 1). Analytical results of bio-gas samples showed that the bio-gas contents (v/v), CH4, CO2and N2,
of desulphurized biogas, was 0.58 ± 0.016−0.65 ± 0.017, 0.27 ± 0.019 −0.32 ± 0.092 and 0.08 ± 0.085−0.13 ± 0.036, respectively (Table 1). CH4content in the desulphurized biogas was >0.69 (v/v) and the
Table 1.Data of biogas desulphurization by the photocatalytic desulphurizing reactor (PDR) (n = 30)
Biogas flow rate (l/min) Inlet H2S (mg/m3) Outlet H2S (mg/m3) Removal CO2(v/v) CH4(v/v) N2(v/v)
0.5 4558 ± 672 5 ± 8.5 >0.99 0.30 ± 0.023 0.62 ± 0.028 0.09 ± 0.019 1 5226 ± 647 21 ± 36.0 >0.99 0.30 ± 0.064 0.62 ± 0.023 0.08 ± 0.023 1.5 5320 ± 396 0 1.00 0.32 ± 0.092 0.58 ± 0.016 0.11 ± 0.026 3 5554 ± 80 1 ± 1.7 >0.99 0.27 ± 0.019 0.61 ± 0.033 0.13 ± 0.036 4 5530 ± 140 5 ± 10.1 >0.99 0.27 ± 0.018 0.65 ± 0.017 0.08 ± 0.029 5 5530 ± 99 0 1.00 0.28 ± 0.014 0.66 ± 0.006 0.08 ± 0.085 P NS NS NS
Data presented as mean ±S.D. H2S, hydrogen sulphide; CO2, carbon dioxide; CH4, methane; N2, nitrogen; v/v, proportion of volume of component to volume of sample; Removal, (inlet data–
outlet data)/inlet data; n, sample size; NS, not significant.
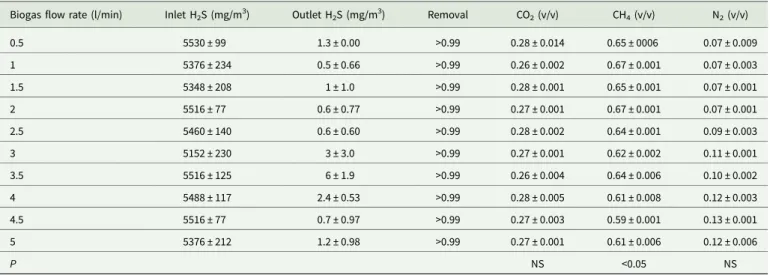
Table 2.Continuous data of biogas desulphurization by the regenerated desulphurizing reactor (PDR) (n = 45)
Biogas flow rate (l/min) Inlet H2S (mg/m3) Outlet H2S (mg/m3) Removal CO2(v/v) CH4(v/v) N2(v/v)
0.5 5530 ± 99 1.3 ± 0.00 >0.99 0.28 ± 0.014 0.65 ± 0006 0.07 ± 0.009 1 5376 ± 234 0.5 ± 0.66 >0.99 0.26 ± 0.002 0.67 ± 0.001 0.07 ± 0.003 1.5 5348 ± 208 1 ± 1.0 >0.99 0.28 ± 0.001 0.65 ± 0.001 0.07 ± 0.001 2 5516 ± 77 0.6 ± 0.77 >0.99 0.27 ± 0.001 0.67 ± 0.001 0.07 ± 0.001 2.5 5460 ± 140 0.6 ± 0.60 >0.99 0.28 ± 0.002 0.64 ± 0.001 0.09 ± 0.003 3 5152 ± 230 3 ± 3.0 >0.99 0.27 ± 0.001 0.62 ± 0.002 0.11 ± 0.001 3.5 5516 ± 125 6 ± 1.9 >0.99 0.26 ± 0.004 0.64 ± 0.006 0.10 ± 0.002 4 5488 ± 117 2.4 ± 0.53 >0.99 0.28 ± 0.005 0.61 ± 0.008 0.12 ± 0.003 4.5 5516 ± 77 0.7 ± 0.97 >0.99 0.27 ± 0.003 0.59 ± 0.001 0.13 ± 0.001 5 5376 ± 212 1.2 ± 0.98 >0.99 0.27 ± 0.001 0.61 ± 0.006 0.12 ± 0.006 P NS <0.05 NS
Data presented as mean ±S.D. H2S, hydrogen sulphide; CO2, carbon dioxide; CH4, methane; N2, nitrogen; n, sample size; NS, not significant; v/v, proportion of volume of component to
volume of sample; Removal, (inlet data–outlet data)/inlet data.
N2content was <0.14 (v/v). The desulphurizer (PDR) with over air
introduction can result in higher N2content but lower CH4content.
Thus, the operation of the PDRs had to be controlled under low air conditions to assure a certain content of CH4in the desulphurized
biogas.
Adsorption and photocatalytic decomposition of DMS and DMDS using an improved type of silica bead inner supported with TiO2 (TiO2/SiO2) were investigated by Nishikawa and
Takahara (2001). Although photocatalytic decomposition of DMDS using the inner-supported bead was below 0.53 (v/v) for the same condition as DMS, the removal of DMDS in the lighting up condition from the start using the bead was about 1.00 (v/v) for 50 h. It was suggested that DMDS was treated completely by the composite effects of adsorption and photocatalytic decompos-ition (Nishikawa and Takahara, 2001). The LECA bead of the PDR was proven without any H2S adsorption characterization
(Su et al.,2013,2014; Su and Chen,2015; Su and Hong,2020). Thus, H2S removal of the biogas was completely photocatalytic
oxidation without any adsorption.
Biogas desulphurization using regenerated PDR
When the concentrations of outlet H2S increased, some yellowish
elemental sulphur was observed on the surface of some TiO2-coated LECA beads inside the PDRs. In the meantime,
inlet biogas was switched off, and tap water (41 litres/reactor) was introduced from the top of the PDRs soaking for a 2 h dur-ation before draining the soaking water. This process was repeated until the sulphur was washed out from the surface of LECA beads. Comparison of the H2S removal efficiency from biogas before
(Table 1) and after PDR regeneration (Table 2) was made to achieve optimal operation parameters. The data of statistical ana-lysis showed that there was no significant difference in the con-tents of CH4, CO2 and N2in the desulphurized biogas by using
the PDR for desulphurization under the biogas flow less than 5 litres/min (Table 1). The PDR is only applied to remove H2S,
thus, the contents of CH4, CO2and N2should remain constant.
After PDR regeneration, inlet H2S in untreated biogas was
5152 ± 230−5530 ± 99 mg/m3 and the outlet H2S in
desulphur-ized biogas was 0.48 ± 0.66−6.27 ± 1.86 mg/m3
. Moreover, H2S
removal efficiency was higher than 0.99 (v/v) under various bio-gas flow rates, i.e. 0.5, 1, 1.5, 2, 2.5, 3, 3.5, 4, 4.5 and 5 litre/min (Table 2). Analytical results of biogas samples showed that the gas contents (v/v), CH4, CO2 and N2, of desulphurized biogas,
were 0.59 ± 0.001−0.67 ± 0.001, 0.26 ± 0.002−0.28 ± 0.014 and 0.07 ± 0.001−0.13 ± 0.001, respectively (Table 2). Thus, sulphur on the surface of LECA beads might be dissolved in the tap water in the form of elemental sulphur or sulphate ion (Su and Hong, 2020). The photocatalytic oxidation of H2S at the gas/
solid interface was investigated using TiO2 as the photocatalyst
and in situ Fourier transform infrared spectroscopy analysis by Kataoka et al. (2005). A malodorous compound, H2S was
removed via a photocatalytic process under ambient conditions. H2S was oxidized to sulphate species on the surface of TiO2
with-out producing a noticeable gaseous intermediate, e.g. sulphur dioxide (SO2) (Kataoka et al., 2005). The results of this study
showed that there was no SO2 detected in the outlet biogas of
the PDR. Thus, the results of this study were consistent with the finding of the study of Kataoka et al. (2005). However, the data of statistical analysis showed that there was a significant dif-ference in the contents of CH4 in the desulphurized biogas by
using the regenerated PDR under the biogas flow less than 5 litres/min (P < 0.05) (Table 2). The results implied that some sampling or analysing errors may occur in those gas samples.
The linear regression analysis was not applied between biogas flow rate and removal efficiency of H2S in each gas (Tables 1 and 2)
because the removal efficiency was not significantly different.
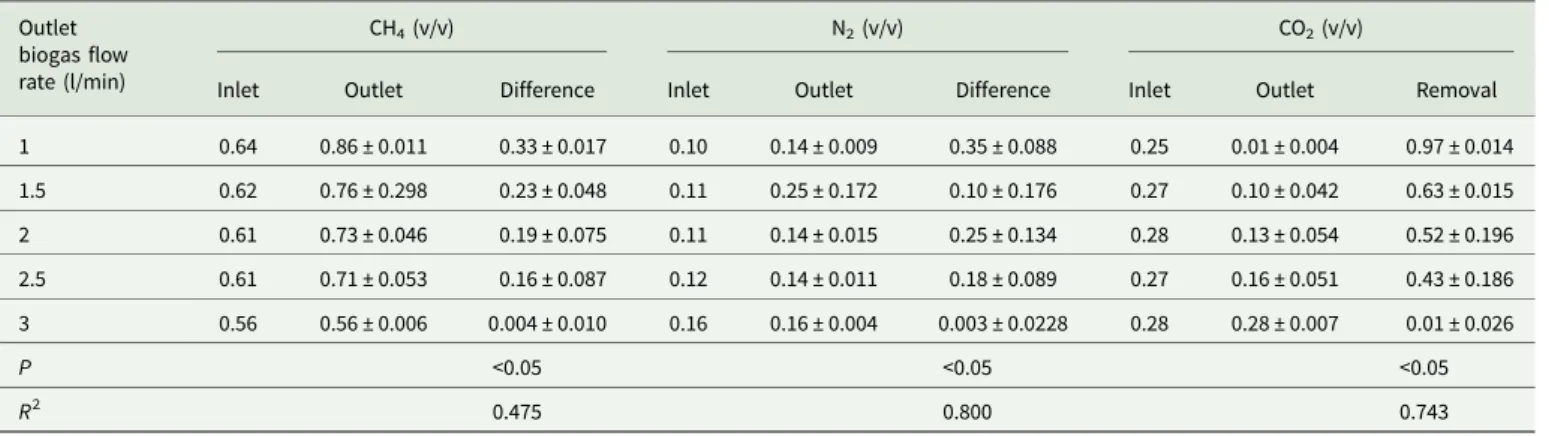
Biogas upgrading using independent hollow fibre CO2 adsorption cartridge set
The higher the CH4content, the higher the heat value of biogas.
In other words, the lower the CO2content, the higher the CH4
content in biogas. Analytical data showed that the inlet and outlet CH4 contents (v/v) in the desulphurized biogas under various
outlet biogas flow rates (1 to 3 litre/min) were 0.56−0.64 and 0.56 ± 0.006−0.86 ± 0.011, respectively (Table 3). The highest CH4content (v/v) in the outlet biogas was 0.86 ± 0.011. The inlet
and outlet N2 contents (v/v) in the desulphurized biogas were
0.10–0.16 and 0.14 ± 0.009−0.25 ± 0.172, respectively (Table 3). The lowest N2content (v/v) in the outlet biogas was 0.14 ± 0.009.
The amount of introducing air might be reduced through an open-ing of the dehydrator. Moreover, the inlet and outlet CO2contents
(v/v) in the desulphurized biogas were 0.25–0.28 and 0.01 ± 0.004– 0.28 ± 0.007, respectively (P < 0.05) (Table 3). The data of statistical analysis showed that there was a significant difference in the differ-ence of CH4/N2or removal of CO2in the upgraded biogas by using
the independent hollow fibre cartridges under the biogas flow less Table 3.Carbon dioxide (CO2) removal of the desulphurized biogas by independent hollow fibre cartridges (n = 30)
Outlet biogas flow rate (l/min)
CH4(v/v) N2(v/v) CO2(v/v)
Inlet Outlet Difference Inlet Outlet Difference Inlet Outlet Removal
1 0.64 0.86 ± 0.011 0.33 ± 0.017 0.10 0.14 ± 0.009 0.35 ± 0.088 0.25 0.01 ± 0.004 0.97 ± 0.014 1.5 0.62 0.76 ± 0.298 0.23 ± 0.048 0.11 0.25 ± 0.172 0.10 ± 0.176 0.27 0.10 ± 0.042 0.63 ± 0.015 2 0.61 0.73 ± 0.046 0.19 ± 0.075 0.11 0.14 ± 0.015 0.25 ± 0.134 0.28 0.13 ± 0.054 0.52 ± 0.196 2.5 0.61 0.71 ± 0.053 0.16 ± 0.087 0.12 0.14 ± 0.011 0.18 ± 0.089 0.27 0.16 ± 0.051 0.43 ± 0.186 3 0.56 0.56 ± 0.006 0.004 ± 0.010 0.16 0.16 ± 0.004 0.003 ± 0.0228 0.28 0.28 ± 0.007 0.01 ± 0.026 P <0.05 <0.05 <0.05 R2 0.475 0.800 0.743
Data presented as mean ±S.D. CH4, methane; N2, nitrogen; n, sample size; NS, not significant; R2, coefficient of determination; v/v, proportion of volume of component to volume of sample;
than 3 litres/min (Table 3). The results implied that different biogas flow rates affect the removal efficiency of CO2, which was related to
the removal efficiency of CH4and N2by using simple hollow fibres
CO2adsorption cartridges.
The highest removal efficiency (v/v) of CO2was 0.97 ± 0.014
under the outlet biogas flow rate of 1 litre/min (Table 4). The removal efficiency of CO2decreased with increased desulphurized
biogas flow rates (P < 0.05). Experimental results showed that the hollow fibre adsorption cartridge was capable of removing CO2
from the desulphurized biogas and promote CH4concentrations,
however, the cartridge had to be regenerated once an hour after the CO2 adsorption process. Thus, an integrated hollow fibre
CO2 adsorption module significantly removed CO2 in biogas
and was more feasible for commercial pig farm use.
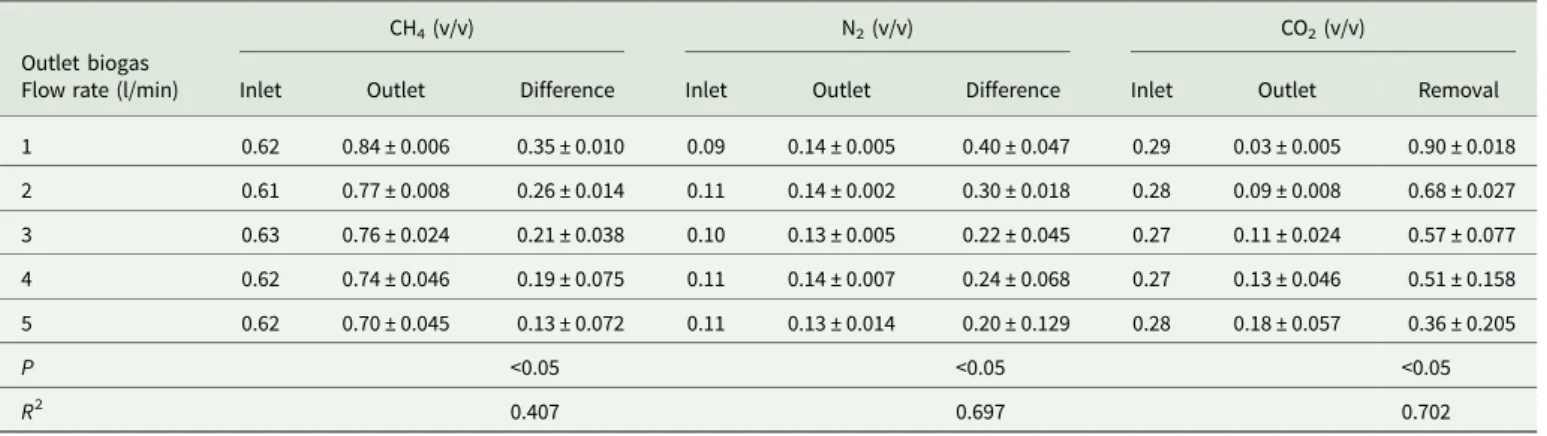
Biogas upgrading using a hollow fibre CO2adsorption module
The hollow fibre CO2 adsorption module comes with an
auto-matic regeneration function. Analytical data showed that the inlet and outlet CH4 contents (v/v) in the desulphurized biogas
under various outlet biogas flow rates (1 to 5 litre/min) were 0.61–0.63 and 0.70 ± 0.045–0.84 ± 0.006, respectively (Table 4). The highest CH4 content (v/v) in the outlet biogas was 0.84 ±
0.006. The inlet and outlet N2contents (v/v) in the
desulphur-ized biogas were 0.09–0.11 and 0.13 ± 0.005–0.14 ± 0.007, respectively (Table 4). The lowest N2content (v/v) in the outlet
biogas was 0.13 ± 0.005. Moreover, the inlet and outlet CO2
contents (v/v) in the desulphurized biogas were 0.27–0.29 and 0.03 ± 0.005–0.18 ± 0.057, respectively (Table 4). The highest removal efficiency (v/v) of CO2 was 0.90 ± 0.018 under the
outlet biogas flow rate of 1 litre/min (Table 4). The removal effi-ciency of CO2decreased with increased desulphurized biogas flow
rates (P < 0.05). Experimental results showed that the hollow fibre adsorption module was capable of removing CO2 from the
desulphurized biogas and promote CH4 concentrations, however,
the module was automatically regenerated once an hour after the CO2adsorption process.
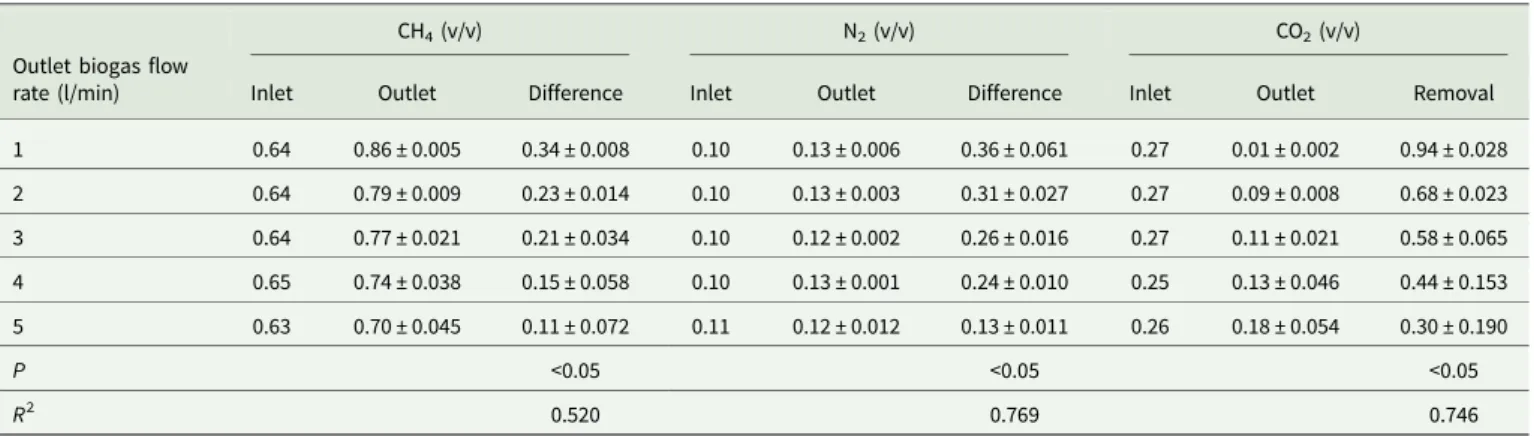
Biogas upgrading using a regenerated hollow fibre CO2 adsorption module
The hollow fibre CO2 adsorption module was automatically
regenerated for 3 h before performing the continuous time-course experiments. Analytical data showed that the inlet and outlet CH4
contents (v/v) in the desulphurized biogas under various outlet biogas flow rates (1–5 litre/min) were 0.63–0.65 and 0.70 ± 0.045–0.86 ± 0.005, respectively (Table 5). The highest CH4 content (v/v) in the outlet biogas was 0.86 ± 0.005. The
inlet and outlet N2 contents (v/v) in the desulphurized biogas
were 0.10–0.11 and 0.12 ± 0.002–0.13 ± 0.006, respectively (Table 5). The lowest N2 content (v/v) in the outlet biogas was
0.12 ± 0.002. Moreover, the inlet and outlet CO2 contents (v/v)
in the desulphurized biogas were 0.25–0.27 and 0.01 ± 0.002– 0.18 ± 0.054, respectively (Table 5). The highest removal efficiency (v/v) of CO2was 0.94 ± 0.028 under the outlet biogas flow rate of
1 litre/min (Table 5). The removal efficiency of CO2 decreased
with increased desulphurized biogas flow rates (P < 0.05). Experimental results showed that the hollow fibre adsorption module was capable of achieving more than 0.90 (v/v) of CO2
removal efficiency (i.e. 0.90 ± 0.018–0.94 ± 0.028) from the desulphurized biogas and promote CH4 content (v/v), however,
the CH4 content (i.e. 0.84 ± 0.006–0.86 ± 0.005) was still less
than 0.90 after CO2 adsorption process. The N2 adsorption
cartridge might be needed to remove N2 (i.e. 0.13 ± 0.006–
0.14 ± 0.005, v/v) in the desulphurized biogas and significantly promote CH4content. The hollow fibre CO2adsorption module
has to be modified for enlarging module size by installing more cartridges, i.e. increase the desulphurized biogas loading volume, or rest the automatic regeneration intervals to achieve more than 0.95 (v/v) of CH4in the upgrading biogas.
The data of statistical analysis showed that there was a significant difference in the removal of CH4, CO2and N2in the
upgraded biogas by using the hollow fibre module under the biogas flow less than 5 litres/min (P < 0.05) (Tables 4 and 5). The results implied that different biogas flow rates affect the removal efficiency of CO2, which was related to the removal
efficiency of CH4 and N2 by using simple hollow fibres CO2
adsorption module. Also, the automatic hollow fibre CO2
adsorption module significantly removed the CO2 in biogas
without manual regeneration and operation.
The linear regression analysis was applied between biogas flow rate and removal efficiency of CO2 in each gas (Tables 3–5)
because the removal efficiency was significantly different. Since the maximum adsorption limit was set at 1 litre/min of outlet bio-gas flow rate, the removal efficiency of CO2for all sets under the
outlet biogas flow rate of more than 1 litre/min declined rapidly right after saturation of the hollow fibre adsorption. Results of lin-ear regression analysis showed that the R2value ofTables 3–5was
Table 4.Carbon dioxide (CO2) removal of the desulphurized biogas by a hollow fibre CO2adsorption module (n = 30)
Outlet biogas Flow rate (l/min)
CH4(v/v) N2(v/v) CO2(v/v)
Inlet Outlet Difference Inlet Outlet Difference Inlet Outlet Removal
1 0.62 0.84 ± 0.006 0.35 ± 0.010 0.09 0.14 ± 0.005 0.40 ± 0.047 0.29 0.03 ± 0.005 0.90 ± 0.018 2 0.61 0.77 ± 0.008 0.26 ± 0.014 0.11 0.14 ± 0.002 0.30 ± 0.018 0.28 0.09 ± 0.008 0.68 ± 0.027 3 0.63 0.76 ± 0.024 0.21 ± 0.038 0.10 0.13 ± 0.005 0.22 ± 0.045 0.27 0.11 ± 0.024 0.57 ± 0.077 4 0.62 0.74 ± 0.046 0.19 ± 0.075 0.11 0.14 ± 0.007 0.24 ± 0.068 0.27 0.13 ± 0.046 0.51 ± 0.158 5 0.62 0.70 ± 0.045 0.13 ± 0.072 0.11 0.13 ± 0.014 0.20 ± 0.129 0.28 0.18 ± 0.057 0.36 ± 0.205 P <0.05 <0.05 <0.05 R2 0.407 0.697 0.702
Data presented as mean ±S.D. CH4, methane; N2, nitrogen; n, sample size; NS, not significant; R2, coefficient of determination; v/v, proportion of volume of component to volume of sample;
Removal or difference, (inlet data–outlet data)/inlet data.
0.74282, 0.70246 and 0.74621, respectively, when the y-axis was CO2removal efficiency and the x-axis was outlet biogas flow rate.
Conclusions
The purpose of developing the PDR was intended to desulphurize livestock biogas under ambient conditions and applied with the various biogas applications such as power generation, absorption chillers, or kitchen stoves. The higher the heat value, the more efficient the biogas applications. For onsite application, the load-ing volume of biogas must be increased with the enlargement of the size of the biogas desulphurization facility and the hollow fibre CO2adsorption module. Thus, nitrogen gas adsorption cartridges
might be needed and installed next to the hollow fibre CO2
adsorption cartridge inside the new hollow fibre CO2adsorption
module for promoting CH4concentration in the upgraded biogas.
Acknowledgements. We thank Fang-Ching Chang and Phil Pan for their expert technical assistance during the hollow fibre adsorption experiments. Financial support. This work was funded by grants (No. MOST 105-2623-E-002-002-ET, 108 AS-17.2.1-AD-U3 and 109 AS-15.2.1-AD-U2) awarded from the Ministry of Science and Technology (MOST) and Council of Agriculture (COA), Executive Yuan, Taiwan, respectively.
Conflict of interest. None. Ethical standards. Not applicable.
References
Canela MC, Alberici RA and Jardim WF(1998) Gas-phase destruction of H2S using TiO2/UV-VIS. Journal of Photochemistry and Photobiology A:
Chemistry 112, 73–80.
Chen XY, Vinh-Thang H, Ramirez AA, Rodrigue D and Kaliaguine S (2015) Membrane gas separation technologies for biogas upgrading. RSC Advances 5, 24399–24448.
Falbo F, Tasselli F, Brunetti A, Drioli E and Barbieri G(2014) Polyimide hollow fibre membranes for CO2 separation from wet gas mixtures.
Brazilian Journal of Chemical Engineering 31, 1023–1034.
Gondal MA, Hameed A, Yamani ZH and Arfaj A(2004) Photocatalytic transformation of methane into methanol under UV laser irradiation over WO3, TiO2, and NiO catalysts. Chemical Physics Letters 392, 372–377.
Ibrahim MH, El-Naas MH, Zhang Z and Van der Bruggen B(2018) CO2
capture using hollow fibre membranes: a review of membrane wetting. Energy & Fuel 32, 963–978.
Kataoka S, Lee E, Tejedor-Tejedor MI and Anderson MA (2005) Photocatalytic degradation of hydrogen sulphide and in situ FT-IR analysis of reaction products on the surface of TiO2. Applied Catalysis B:
Environmental 61, 159–163.
Lien CF, Chen MT, Lin YF and Lin JL(2004) Photooxidation of methane over TiO2. Journal of the Chinese Chemical Society 51, 37–42.
Nishikawa H and Takahara Y(2001) Adsorption and photocatalytic decom-position of odor compounds containing sulphur using TiO2/SiO2 bead.
Journal of Molecular Catalysis A: Chemical 172, 247–251.
Su JJ and Chen YJ (2015) Monitoring of sulphur dioxide emission resulting from biogas utilization on commercial pig farms in Taiwan. Environmental Monitoring and Assessment 187, 4109 (total 8 pages). Su JJ and Chen YJ(2018) Monitoring of greenhouse gas emissions from
farm-scale anaerobic piggery waste-water digesters. Journal of Agricultural Science 156, 739–747.
Su JJ and Hong YY(2020) Removal of hydrogen sulphide using a photo-catalytic livestock biogas desulphurizer. Renewable Energy 149, 181–188.
Su JJ, Liu YL, Shu FJ and Wu JF(1997) Treatment of piggery wastewater by contact aeration treatment in coordination of three-step piggery wastewater treatment (TPWT) process in Taiwan. Journal of Environmental Science and Health 32A, 55‒73.
Su JJ, Liu BY and Chang YC(2003) Emission of greenhouse gas from live-stock waste and wastewater treatment in Taiwan. Agriculture, Ecosystems & Environment 95, 253–263.
Su JJ, Chang YC, Chen YJ, Chang CK and Lee SY(2013) Hydrogen sul-phide removal from livestock biogas by a farm-scale bio-filter desulphur-ization system. Water Science and Technology 67, 1288–1293.
Su JJ, Chen YJ and Chang YC(2014) A study of a pilot-scale biogas bio-filter system for utilization on pig farms. Journal of Agricultural Science 152, 217–224.
Su JC, Wang YL and Su JJ(2018) Photocatalytic oxidation of dairy effluent with UV lamp or UV light-emitting diode module and biological treatment processes. International Journal of Environmental Science and Technology 16, 1047–1056.
Tantikhajorngosol P, Laosiripojana N, Jiraratananon R and Assabumrungrat S(2019) Physical absorption of CO2and H2S from synthetic biogas at
ele-vated pressures using hollow fibre membrane contactors: the effects of Henry’s constants and gas diffusivities. International Journal of Heat and Mass Transfer 128, 1136–1148.
Vogler S, Braasch A, Buse G, Hempel S, Schneider J and Ulbricht M(2013) Biogas conditioning using hollow fibre membrane contactors. Chemie Ingenieur Technik 85, 1254–1258.
Žák M, Bendová H, Friess K, Bara JE and Izák P (2018) Single-step purifi-cation of raw biogas to biomethane quality by hollow fibre membranes without any pretreatment – an innovation in biogas upgrading. Separation and Purification Technology 203, 36–40.
Table 5.Carbon dioxide (CO2) removal of the desulphurized biogas by a regenerated hollow fibre CO2adsorption module (n = 30)
Outlet biogas flow rate (l/min)
CH4(v/v) N2(v/v) CO2(v/v)
Inlet Outlet Difference Inlet Outlet Difference Inlet Outlet Removal
1 0.64 0.86 ± 0.005 0.34 ± 0.008 0.10 0.13 ± 0.006 0.36 ± 0.061 0.27 0.01 ± 0.002 0.94 ± 0.028 2 0.64 0.79 ± 0.009 0.23 ± 0.014 0.10 0.13 ± 0.003 0.31 ± 0.027 0.27 0.09 ± 0.008 0.68 ± 0.023 3 0.64 0.77 ± 0.021 0.21 ± 0.034 0.10 0.12 ± 0.002 0.26 ± 0.016 0.27 0.11 ± 0.021 0.58 ± 0.065 4 0.65 0.74 ± 0.038 0.15 ± 0.058 0.10 0.13 ± 0.001 0.24 ± 0.010 0.25 0.13 ± 0.046 0.44 ± 0.153 5 0.63 0.70 ± 0.045 0.11 ± 0.072 0.11 0.12 ± 0.012 0.13 ± 0.011 0.26 0.18 ± 0.054 0.30 ± 0.190 P <0.05 <0.05 <0.05 R2 0.520 0.769 0.746
Data presented as mean ±S.D. CH4, methane; N2, nitrogen; n, sample size; NS, not significant; R2, coefficient of determination; v/v, proportion of volume of component to volume of sample;