Evaluation of Decolorization, Mineralization, and Toxicity
Reduction of an Azo Dye C.I. Reactive Black 5
in a Countercurrent Bubble Column by Ozone
Hao-Jan Hsing
1; Pen-Chi Chiang
2; and E. E. Chang
3Abstract: A countercurrent and continuous-flow design bubble column reactor共BCR兲 was used to investigate variations in traditional parameters of water-containing Reactive Black 5共RB5兲 under different gas/liquid flow rates. RB5 is a long-chain diazo dye with a high molecular weight that is widely applied in industry. The results revealed that the variations were functions of the flow rates of the liquid and/or gas and of operation column height. Pseudo-first-order or global-second-order reaction types were used to describe the variations, and the monitored parameters i.e., total organic carbon共TOC兲, sulfate, and nitrate. Not only did flow patterns affect the RB5 removal and the mineralization of derivatives, but column height might also have had an influence on ozone consumption. It was observed that the extent of decolorization and mineralization decreased as the sampling port height increased, indicating that the column height may reflect the retention time of ozone gas and the contacting time between ozone and RB5 in the BCR system. Biodegradability was enhanced by ozone treatment, although the effect was not proportional to the amount of ozone consumption. An experimental regression model was proposed to predict the variations in colori/ color0, TOCi/ TOC0, and sulfate yield共YSO42−兲 throughout this investigation.
DOI: 10.1061/共ASCE兲1090-025X共2006兲10:1共10兲
CE Database subject headings: Dyes; Colors; Biodegradation; Toxicity; Ozonization; Water pollution.
Introduction
Water treatment by ozone has been widely used for decades, and its application in the field of wastewater treatment has been in-tensively studied in recent years. One of the most powerful oxi-dants 共E0= 2.07 V兲, ozone, is produced via electrical discharge into pure oxygen or oxygen-enriched gas共Chen et al. 2003兲 and is used in the treatment of water or wastewater for pollutant removal and disinfection. With this unique advantage, ozone is also a se-lective oxidant that will react with a compound containing unsat-urated bonds more rapidly than with others.
Over 50% of commercial dyes used in the textile industry are azo dyes that contain unsaturated azo bonds共N=N兲, which have various azo bonds and chromophores to allow for customized color requirement and finishing purposes. Some azo dyes not only cause allergies, but also exhibit toxic and even mutagenic or car-cinogenic properties共Pielesz et al. 2002兲; over 27 azo dyes have been removed from the market due to strict regulations共European
Union 2003兲. Since dyestuff cannot be utilized in its entirety dur-ing dye bath processes, it is discharged along with rinse water containing high levels of dye residue that is difficult to remove by traditional treatment methods. Thus, the effluent water from sec-ondary treatment plants still contain dye residues; the associated color is aesthetically displeasing, inducing major complaints from local communities. Further, the effluent-containing dye residue represents an increasing danger in aquatic life due to its toxicity and potentially carcinogenic nature.
Ozonation, as one of the promising advanced oxidation pro-cesses, has been used in treating colored water and has proven its ability to treat wastewater, especially that of the textile in-dustry 共Wu and Wang 2001; Adams and Gorg 2002兲. With the high oxidation capability, ozone has been successfully used in water and wastewater treatment in removing color, reducing the chemical oxygen demand共COD兲 and total organic carbon 共TOC兲 of wastewater共Arslan and Balcioglu 2000; Sevimli and Sarikaya 2002; Wang et al. 2003兲. The bubble column reactor 共BCR兲 has commonly been applied in water treatment by ozone contact-ing 共Chiang et al. 1999; Hermanowicz et al. 1999兲 that offers advantages, such as no moving parts, high liquid-phase con-tent for treatment, high mass transfer rate, low-energy input, and less required space 共Deckwer and Schumpe 1993兲. The flow in the BCR may be co-current or counter current, depending on the liquid and gas flow directions. Based on the previous studies, the counter-current flow type of BCR has a high mass transfer efficiency compared to the co-current type 共Zhou et al. 1994; Chen et al. 2002兲.
The target compound used in this study, Reactive Black 5 共RB5兲, is typical of the azo dyes widely used in the textile indus-try, and its degradation has been studied共Ince and Tezcanlí 2001兲 as well as its toxicity reduction共Wang et al. 2003兲 in a semibatch system. The objectives of this study are: 共1兲 to investigate the effect of the ratio of gas and liquid on the degradation of RB5 in 1
Graduate Student, Graduate Institute of Environmental Engineering, National Taiwan Univ., 71 Chou-Shan Rd., Taipei, Taiwan 106, ROC. E-mail: [email protected]
2
Professor, Graduate Institute of Environmental Engineering, National Taiwan Univ., 71 Chou-Shan Rd., Taipei, Taiwan 106, ROC 共corresponding author兲. E-mail: [email protected]
3
Professor, Dept. of Medicine, Taipei Medicine Univ. 250 Wu-Hsing St., Taipei, Taiwan 106, ROC. E-mail: [email protected]
Note. Discussion open until June 1, 2006. Separate discussions must be submitted for individual papers. To extend the closing date by one month, a written request must be filed with the ASCE Managing Editor. The manuscript for this paper was submitted for review and possible publication on July 26, 2005; approved on July 26, 2005. This paper is part of the Practice Periodical of Hazardous, Toxic, and Radioactive
Waste Management, Vol. 10, No. 1, January 1, 2006. ©ASCE, ISSN
a bubble column system; 共2兲 to determine the relationship be-tween TOC removal and ozone consumption;共3兲 to determine the level of toxicity reduction by ozonation; and 共4兲 to propose an empirical formula to express the change of color, TOC, and sul-fate. The results of this study could provide base-line information to both the academic community and practicing engineers.
Material and Methods
Materials
The commercialized reactive dye, RB5, C26H21N5Na4O19S6, was provided by a local manufacturer共Yi-Hwa, Taiwan兲 with 55% of purity, and it was used without further purification. The rest 共45%兲 of the commercial RB5 is assumed to contain chemicals, such as salts and surfactants; the exact composition formulation is protected by the manufacturer. The molecular weight共MW兲 and maximum absorption peak共Amax兲 for RB5 are 992 g/mol and 597 nm, respectively. The initial TOC and pH of RB5 共75 mg/L兲 in solution were 16± 1 mg/ L and 5.5± 0.2, respectively.
Instrumentation
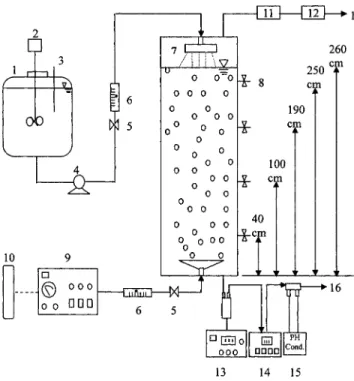
Fig. 1 is a schematic diagram of the ozone contacting bubble column. The polyvinyl chloride column was 3.0 m high and had an inner diameter of 14.2 cm, with an effective volume共VL兲 of 45 L. It was operated in the countercurrent mode with water-containing RB5 flowing downward and ozone-water-containing gas flowing upward continuously. Ozone-containing gas was gener-ated with pure oxygen by an ozone generator 共SG-01A,
Sumi-tomo, Japan兲 and introduced into the column so that the mixed gas flowed through a ceramic diffuser located 10 cm from the bottom of the contactor. The liquid-storage tank was equipped with a thermostat to maintain a constant solution temperature of 30°C in all experiments. A solution with a height of about 2.6 m 共L兲 was held in the column, and sample taps were installed at heights of 2.5, 1.9, 1.0, and 0.4 m from the bottom of the contac-tor for sample collecting.
The dissolved ozone concentration共O3,diss兲 was monitored by an ozone monitor共model 3600, Orbisphere Laboratory, Neuchà-tel, Switzerland兲 that was equipped with a membrane-containing cathode sensor to analyze the dissolved ozone concentration and was calibrated by the indigo method. The ozone concentration in off-gas 共O3,off兲 was monitored by an ozone analyzer 共Dasibi model 1008-HC, Calif.兲 and calibrated by 2% KI solution. Absor-bance of A597 nmand 254 nm共UV254兲 was performed by an ultra-violet 共UV兲-visible detector 共model Cintra 20, GBC Scientific Equipment, Victoria, Australia兲. Visible wavelength absorbance was examined using wavelength scanning from 400 to 700 nm and integrating the area, expressed as integrated absorbance unit 共IAU兲, under the absorbance curve. The IAU is proportional to the sample color mentioned in a previous study 共Wu and Wang 2001兲. A TOC analyzer 共Model 1010, O.I Corporate兲 was em-ployed to analyze the TOC concentration; an ion analyzer 共Cap-illary Ion Analyzer, Waters兲 was used for the analysis of sulfate 共CSO42−兲 and nitrate 共CNO
3
−兲 generation.
Experimental Procedures
Before the ozonation experiments were started, the ozone-containing gas was bypassed to the ozone analyzer to assure its stability and to determine the inlet ozone concentration. The ozone-enriched gas was directed into the column with a fixed ozone production of共60 g/h兲. For the set of fixed liquid flow rate experiments, the gas flow rates共GG兲 were set as 0.9, 2.1, 2.7, and 3.4 L / min, while the fixed liquid flow rate was 2.4 L / min. For the set of fixed gas flow rate experiments, liquid flow rates共GL兲 used in this study were 2.0, 2.4, 4.0, and 6 L / min, the ozone-enriched gas flow rate was set as 2.1 L / min. The effluent liquid and samples at different heights were drawn at desired intervals to analyze the variations in pH, A597 nm, color, COD, TOC, nitrate, and sulfate in the course of the experiments. In addition, the ozone concentration and amount of the effluent and off gas were also measured. The samples for 5–day biological oxygen demand 共BOD5兲 tests were drawn to evaluate the enhancement of bio-degradation by ozonation. The experimental conditions are listed in Table 1.
Toxicological Bioassay by Microtox
Microtox toxicological bioassay was used to measure the toxicity of the ozonated RB5 solution in this study. The decrease in res-piration and subsequent light output of a luminescent bacterium
Vibrio fischeri was measured to determine the level of toxic
re-sponse. The EC50 of the Microtox analysis is defined as the sample concentration that reduces the reagent light output by 50% 共Hu et al. 2003兲; it is used as an indicator to evaluate the level of toxicity in this study. The effect measured by the Microtox toxicological bioassay, light loss, is related to the rate of biologi-cal activity and is measured at 15 min of sample exposure time in this study.
Fig. 1. The experimental apparatus sketch. Components:共1兲 storage tank; 共2兲 stirrer; 共3兲 thermostat and level alarm; 共4兲 pumps; 共5兲 flow control valve; 共6兲 precision flow controller; 共7兲 liquid sparger; 共8兲 sampling ports; 共9兲 ozone generator; 共10兲 oxygen cylinder; 共11兲 gaseous ozone detector; 共12兲 ozone destroyer; 共13兲 liquid ozone monitor; 共14兲 photospectrometer; 共15兲 pH and conductivity sensors; 共16兲 draining; and 共17兲 venting hood.
Results and Discussion
Oxonation of RB5 in Bubble Column Reactor
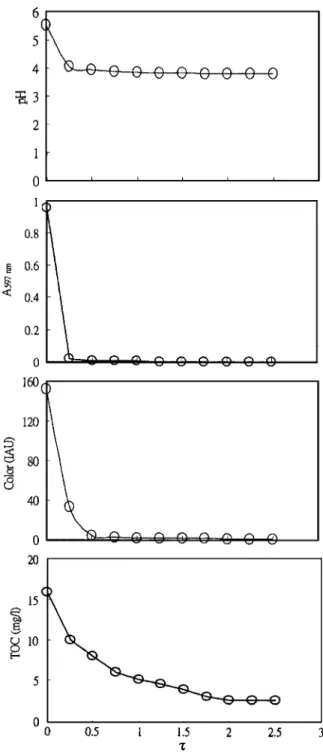
The ozonation profile of RB5 in pH, A597 nm, color, and TOC operated at the condition of GL= 2.4 L / min and GG= 2.1 L / min are shown in Fig. 2. As ozone was conducted into BCR, the pH decreased rapidly from 5.5 to 4.0 within 0.5 dimensionless ozo-nation time共,=ozonation time/60 min兲 due to the formation of organic and inorganic acids; as the system approached a steady state, the pH reached a constant 共3.8±0.1兲. The unreacted RB5 existed in the effluent was nearly undetectable as⬎0.5, suggest-ing that the RB5 removal efficiency approached 100% further implies that RB5 and O3 have a fast reaction. Due to the low bonding energy共66 kcal/mol兲, azo bonds 共N=N兲 may be the first to be attacked by ozone, which causes a color change. Also, under acidic conditions, ozone dissolved into liquid phase and then re-acted with RB5 molecules, whereas the direct reaction was domi-nant. The abatement of color changed from 153 to 1.6 IAU within =1, suggesting that most chromophores in the liquid phase were destroyed by O3, and its reduction was similar to RB5 removal. The TOC reduction occurred simultaneously with decolorization, decreasing from 16 mg/ L to 5 mg/ L within=1, and reached a steady constant共3 mg/L兲. Clearly, TOC could not be totally re-moved by ozone in this study because of persistent byproducts formed共Chiang et al. 1999兲.
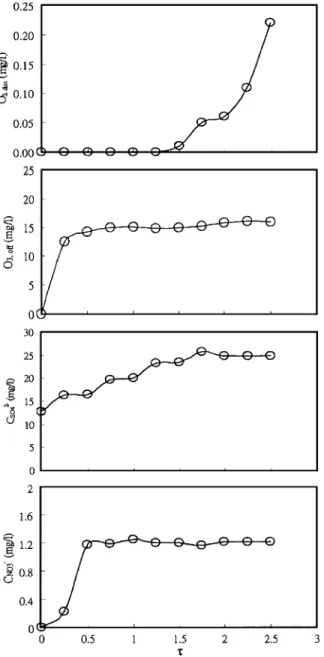
It is noted that the O3,dissprofile is concerned with the level of decolorization, and the profile is observed after the completion of decolorization, as shown in Fig. 3. The results prove that: 共1兲 a rapid reaction occurs between RB5 molecules and O3,diss, and共2兲 the residual dissolved ozone can be found only after the comple-tion of decolorizacomple-tion. The appearance of dissolved ozone in the effluent indicated that the dissolved ozone utilization rate slowed down and the slower TOC reduction gradually dominated. Sulfate and nitrate were found after the treatment of RB5 by ozone and were consistent with the TOC reduction; CSO
4
2−and CNO 3 −reached 25 and 1.3 mg/ L, respectively, after=2. Referring to the chemi-cal structure of RB5, one RB5 molecule contains six sulfate groups and two azo bonds. As ozonation proceeded, the amount of sulfate released was about 20 times that of nitrate formation. Analysis of the off gas indicated the presence of gaseous nitrogen compounds共such as NO and NO2兲, which might explain the un-balancing of nitrogen mass during the experiment. Further, nitrate formation required the breakdown of the aromatic ring—a slower reaction compared to cleaving sulfate from an aromatic ring, suggesting that some nitrogen was not released from persistent
byproducts. A similar observation was reported that the release of the sulfate group was faster than TOC removal and nitrate formation as oxidation of 2-merceaptothiazoline by ozone共Chen et al. 2004兲.
Effect of Flow Patterns on RB5 Ozonation
Fixed Liquid Flow Rate
The ozonation profile of decolorization, TOC removal effi-ciency 共TOC,TOC= 1 − TOCi/ TOC0兲, UV removal efficiency 共UV,UV= 1 − UV/ UV0兲, and CSO
4
2− were monitored at the exit of the BCR under a fixed liquid flow rate共GL= 2.4 L / min兲 while Table 1. Experimental Setup and Monitored Parameters at=2.5
GG
共1/min兲 共1/min兲GL Decolorizationa,b TOCa,c 关O3兴diss共mg/L兲a
2.1 2.0 0.98 0.87 0.88 2.1 2.4 0.98 0.83 0.22 2.1 4.0 0.96 0.73 0 2.4 6.0 0.70 0.66 0 0.9 2.4 0.50 0.79 0 2.7 2.4 1.00 0.86 0.56 3.3 2.4 1.00 0.90 0.9
Note: IAU⫽integrated absorbance unit; and TOC⫽total organic carbon.
a
Measured at the exit.
b
Decolorization⫽1−IAU/IAU0. c
TOC= 1 − TOC/ TOC0.
Fig. 2. RB5 ozonation profiles of pH, A597 nm, color, and total organic carbon under the conditions of 关RB5兴=75 mg/L,
changing GGfrom 0.9 to 3.4 L / min, as shown in Fig. 4. For the variation in decolorization关Fig. 4共a兲兴, it was clear that the smaller
GG共0.9 L/min兲 would result in less decolorization than a high GG, and the degree of reduction was not proportional to the in-crease in GGThe results indicated that, as GG⬎2.1 L/min, the
GGwas not a predominant factor for decolorization because the ozone supply was more than sufficient for decolorization need; this implies that GGcould be a primary factor in controlling de-colorization as GL/ GG⬎1.14. It suggests that the O3,disswas not enough to break all the existing azo bonds in the solution under the conditions of GG= 0.9 L / min, the corresponding applied ozone dosage which was 1.2 mg/ L / min. TheTOC andUV re-sults, as shown in Figs. 4共b and c兲, showed a similar increasing trend, with the extent increasing as GG increased, but a smaller extent for GG= 0.9 L / min. TheTOCwas affected by GG, which could be viewed as an applied ozone dose in this study. As GG increased, the applied ozone dose increased. The higher the GG, the more TOC could be removed, in line with the
pseudo-first-order kinetic model; the amount ofTOC could improve to 0.85, and the difference between four GGs was only 12%.
The UV variation may represent the level of unsaturated bonds in the effluent, which may serve as an important factor to evaluate the removal of RB5 and its derivatives by ozone. For the UV results shown in Fig. 4共c兲, because of incomplete de-colorization at GG= 0.9 L / min, the amount ofUV reached only 0.6, significantly lower than that in other GGs. It proved that a certain amount of organics was not ozonated and discharged with the effluent. Also, it is noted that there was little difference among the UV for GG= 2.1, 2.7, and 3.4 L / min, consistent with the explanation of decolorization. CSO42−was consistent with dimin-ishing TOC as mentioned before, and CSO
4
2− increased as GG increased, ranging from 0.1 mM 共GG= 0.9 L / min兲 to 0.15 mM 共GG= 3.4 L / min兲. An exponential correlation was observed strongly between CSO42−and GG, as shown in Fig. 4共d兲.
Fixed Gas Flow Rate
Similar approaches were followed in the fixed liquid flow experi-ments, with fixed GG= 2.1 L / min and increasing GL from 2 to 6 L / min to observe the variations in decolorization,UV,TOC, and CSO
4
2−共Fig. 5兲. As shown in Fig. 5共a兲, the decolorization for four GLs exhibited slight differences, although all were above 0.9; the only exception was under the condition of GL= 6 L / min, where the decolorization amounted to only 0.7. The difference between the decolorization under the conditions of GL= 2 and 6 L / min was about 0.28, indicating that the ozone dose was not enough to consume all RB5 under the GL= 6 L / min condition; for the other three GLs, the differences between them were not sig-nificant. For TOC measurements, as shown in Fig. 5共b兲, it was found thatTOCreached steady states after=1.5, except for the case of GL= 2.4 L / min. The differences among GL= 2, 4, and 6 L / min共TOC= 0.86, 0.74, and 0.33 respectively兲 were remark-able, indicating thatTOCdecreased as GLincreased. This meant that the TOC reduction correlated with the ozone dose, the pro-cesses of decolorization, and the TOC reduction 共at GL = 6 L / min兲 competed for ozonation. For the cases of GL= 2 and 2.4 L / min, the averageTOCwas more than 0.8 in both instances, suggesting that ozone mass transfer efficiencies in the BCR were better than in a semibatch reactor as Chen et al.共2003兲 reported. Fig. 5共c兲 illustrates the UVvariation that suggests correlation betweenUVand GLunder fixed GGconditions. As GLincreased from 2 to 6 L / min,UVdecreased from 0.78 to 0.28 under fixed
GG, indicating that the ozone supply was a significant controlling factor onUV. Also, from the dissolved ozone profile, compiled by monitoring the BCR, it is obvious that no dissolved ozone was measured under a high GL condition. It is clear that dissolved ozone was consumed right after its dissolution, suggesting that a quick interaction occurred. Also, it indicated that the extent of
CSO42−did not significantly reduce as GLincreased.
The results of the comparison ofTOC and CSO42−under both conditions of fixed GLand GGare shown in Fig 6. It is observed that the effect of GL/ GGon TOCwas more significant than that on CSO42−; both appeared as an exponential decay trend with R2of 0.89 and 0.86, respectively. The rate of TOC decreased more rapidly than CSO42− as GL/ GG increased, and the ratio of TOC decreasing was about six times of that of CSO
4 2−.
Fig. 3. RB5 ozonation profiles of ozone concentration in liquid and off-gas, sulfate, and nitrate under the conditions of关RB5兴⫽75 mg/L,
Ozone Consumption Associated with Total Organic Carbon Removal
By measuring the ozone concentration in the off-gas and the ef-fluent at the exit, the ozone consumption共mO
3兲 can be calculated as follows: mO3=
冕
0 t GG共CAo− CAe兲dt 共1兲 where CAe⫽ozone concentration at the outlet.The gas holdup and O3 gas reacting with ozonated gaseous byproducts within the BCR were ignored. As O3was introduced into the BCR, dissolved O3was consumed to decolor and remove TOC. For the fixed liquid flow experiments 共GL= 2.4 L / min兲, O3 supply was not a limiting factor. TOCi/ TOC0 followed the pseudo-first-order reaction rate as illustrated in Fig. 7. It is found that TOCi/ TOC0decreased remarkably with increasing mO3in all cases under the fixed liquid flow rate condition, indicating a high correlation between the TOC reduction and mO3.
For the cases under fixed gas flow rate conditions, the varia-Fig. 4. Variation profiles of 共a兲 decolorization, 共b兲 TOC, 共c兲 UV, and 共d兲 CSO42− at the exit for four different gas flow rates under
GL= 2.4 L / min conditions. Notation:䊐: GG= 0.9 L / min,〫: GG= 2.1 L / min,䉭: GG= 2.7 L / min, and䊊: GG= 3.4 L / min.
Fig. 5. Variation profiles of 共a兲 decolorization, 共b兲 TOC, 共c兲 UV, and 共d兲 CSO42− at the exit for four different liquid flow rates under
tion of TOCi/ TOC0in relation to mO3is shown in Fig. 8. Because of the limitation of O3supply, the TOC reduction might act as a second-order reaction rate as expressed by the following kinetic equation:
dTOC/dt = k关TOC兴关O3兴 共2兲
As seen in Fig. 8, TOCi/ TOC0decreased as mO3increased. As GL increased from 2 to 6 L / min, the levels of TOCi/ TOC0 were higher. It is obvious that GL was the controlling factor in TOC reduction under fixed GGconditions, since TOCi/ TOC0escalated as GLincreased. As the amount of mO
3 approached 4 g, the dif-ference of TOCi/ TOC0 between GL= 2 and 6 L / min reached 23%, indicating that the chemical reaction between RB5 and the amount of dissolved O3controlled the TOC reduction rate.
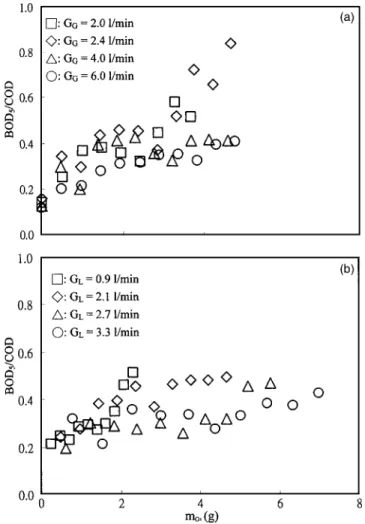
Figs. 9共a and b兲 show the effect of ozonation on the BOD5/ COD enhancement of two flow patterns; both figures il-lustrate the positive correlation between BOD5/ COD and mO3. As
mO3increased, the BOD5/ COD increased substantially from⬍0.1 to 1.0 and 0.5 as mO3= 4.6 g for fixed GGand GLconditions, and the trend of BOD5/ COD appeared as a function of mO3. The phenomenon could be attributed to the reaction between ozone and RB5 molecules, which opened the long-chain high MW,
and/or the reaction of RB5, which is not biodegradable, with the simple biodegradable organic compounds present in the water. Because of low BOD5/ COD in initial conditions, the effect of ozonation on increasing the BOD5/ COD of the final ozonated effluent was expected to be high, indicating that the biodegrad-ability was enhanced by ozone treatment.
Fig. 8. The O3 consumption 共mO3兲 versus total organic carbon 共TOCi/ TOC0兲 variations at fixed gas flow rate 共GG= 2.1 L / min兲 conditions. Notation: 䊐: GL⫽2.0 l/min, 〫: GL= 2.4 L / min, 䉭:
GL⫽4.0 l/min, and 䊊: GL= 6.0 L / min.
Fig. 9. The effect of O3 consumption 共mO3兲 on BOD5/ COD enhancing. 共a兲 Fixed gas flow rate 共GG= 2.1 L / min兲; and 共b兲 fixed liquid flow rate共GL= 2.4 L / min兲.
Fig. 6. Correlation of TOC and CSO 4
2− versus GL/ GG under fixed
GL共2.4 L/min兲 and GG共2.1 L/min兲 conditions. Notation: fixed GL, fixed GG:〫, ⽧: TOC, R2= 0.89;䊊, 쎲: CSO
4
2−, R2= 0.76.
Fig. 7. O3 consumption 共mO3兲 versus total organic carbon 共TOCi/ TOC0兲 variations at fixed liquid flow 共GL= 2.4 L / min兲 condition, R2= 0.90. Notation:䊐: G
G= 0.9 L / min,〫: GG⫽2.1 l/min, 䉭: GG= 2.7 L / min, and䊊: GG= 3.4 L / min.
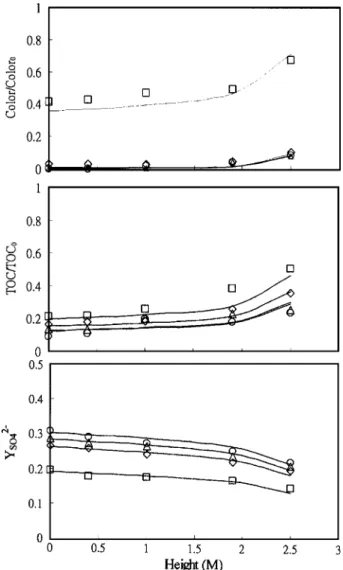
Column Height Effect on Reduction of Color and Total Organic Carbon, and Sulfate Formation
Since the BCR used in this study had a countercurrent flow pattern, with liquid flowing downward, and ozone-enriched gas flowing upward, the ozone contacting time was affected by column height 共H兲 under both experimental designs. Some investigators have shown that color and TOC reduction are affected by ozonation time and ozone dosage 共Perkowski et al. 1996; Konsowa, 2003兲 as well as column height 共Chen et al. 2003兲. Thus, the variation in color change, TOC reduction, and sulfate yield 关YSO
4 2−, defined as YSO 4 2−=共CSO 4 2−,i− CSO 4 2−,0兲/ 共CSO 4 2−,total− CSO 4
2−,0兲兴 in the BCR during the ozonation process could be predicted and expressed as colori/ color0or TOCi/ TOC0, or YSO42−could be expressed as follows:
Y = a⫻
冉
GL GG冊
b ⫻冉
1 − H 2.6冊
c 共3兲 where Y = colori/ color0; TOCi/ TOC0, or YSO42−; a, b, andc⫽constants; and H⫽depth of water column.
The results of a, b, and c are listed in Table 2. The profile predictions for colori/ color0, TOCi/ TOC0, or YSO
4
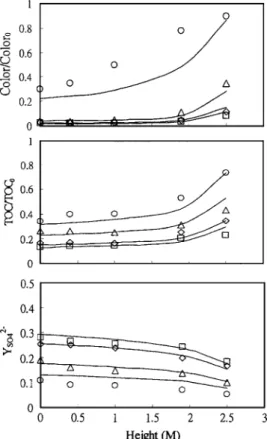
2−of two flow patterns are shown in Figs. 10 and 11, respectively. In Fig. 10, both color and TOC decreased as the gas flow rate increased while YSO42−increased, indicating that the reduction profiles were controlled by GGozone dose. Furthermore, the ozone contacting time 共i.e., column height兲 affected the extent of colori/ color0, TOCi/ TOC0, and YSO42−; it was observed that the reducing profiles minimized concurrently with increasing column height. The re-sults prove that the ozone contacting time is related to ozone consumption in the BCR system; a taller BCR would result in higher ozone consumption. The results also suggest that column height could significantly affect the decolorization and mineral-ization performance in the BCR. For the effects of fixed gas flow rates, it is observed that the reducing extents of colori/ color0and TOCi/ TOC0are the opposite of those under fixed gas flow rate conditions, indicating that the ozone supply is a limiting factor and the effect of column height may be an important factor in controlling the profiles of colori/ color0 and TOCi/ TOC0 reduc-tion, as well as the increment of YSO
4 2−.
Toxicological Bioassay by Microtox
The toxicity reduction of RB5 solution treated by ozone was de-termined by comparing the toxicity before ozonation. As the tox-icity was reduced to a nontoxic level, the EC50 was assumed to be 100%. The toxicity reduction could be defined as follows 共Jones and Huang 2003兲:
Toxicity reduction =EC50共after兲 − EC50共before兲 100%− EC50共before兲 共4兲 where EC50共after兲⫽EC50 value of toxicity after ozonation; and EC50共before兲⫽the EC50 value of RB5 before ozonation. Fig. 12
depicts the toxicity reduction by the GL/ GGbased on Eq.共4兲. The largest toxicity reduction occurs at GL/ GG⬍0.9; it decreases as GL/ GG increases, and the trend does not appear to be linear. Also, as seen in Fig. 12, the toxicity reduction approaches 0.33 as the GL/ GG values ⬎2.0. It is clear that the performance of toxicity reduction is not significant under higher GL condi-tions, indicating that ozone dosage could be a controlling factor of toxicity reduction. The results suggest that GL/ GG⬍1.0 may have achieved total toxicity reduction in this study. The ef-fect of ozone consumption on the toxicity reduction and CSO42−at =2.5 are illustrated in Fig. 13. From the figure, it showed that the CSO42− was within range of 0.1 to 0.17 mM, whereas the amount of mO3increased from 4.5 to 7.0 g. Under the same range of mO3, the toxicity reduction increases from 0.29 to 1.0 and the value of toxicity reduction increases dramatically from 0.3 to 1.0 at mO3= 4.7 g, it implies the optimal mO3 value for total toxicity reduction in this study.
Conclusion
RB5 is a long-chain diazo dye with high MW that is widely applied in industry. Traditional parameters, such as pH, A597 nm, Table 2. Parameter Estimates for Eq.共3兲
a b c R2
Colori/ color0 0.0127 −2.78 −0.606 0.83共40兲
TOCi/ TOC0 0.149 −0.686 −0.220 0.86共40兲
YSO42− 0.198 0.123 0.671 0.80共40兲
Note: The number in the parenthesis indicates the samples size. TOC⫽total organic carbon.
Fig. 10. The prediction profile for colori/ color0, total organic carbon 共TOCi/ TOC0兲, or YSO
4
2− at =2.5 under fixed liquid
flow 共GL= 2.4 L / min兲 condition. Notation: 䊐: GG= 0.9 L / min, 〫:
color strength, TOC, O3 concentration, CSO 4
2−, and CNO 3 −, are monitored when RB5 solution is conducted into a continuously countercurrent BCR system, and their variations may be con-trolled by the flow rates of liquid and/or gas. Thus, the trend may appear as a pseudo-first-order or global-second-order reaction type, depending upon the controlled flow. It is noted that the monitored parameters all achieve constants as the system ap-proaches a steady state for TOC, CSO42−, and CNO3−, but the varia-tions of pH, A597 nm, and color all reach steady constants at=1. The work suggests that decolorization and RB5 species removal are easily achieved compared to TOC reduction.
The controlled flow may have an effect on the order of the reaction; a pseudo-first-order reaction was suggested in the fixed liquid flow rate experiments, and a second-order reaction might be suitable for the fixed gas flow rate conditions. Not only do flow patterns influence RB5 removal and the mineralization of deriva-tives, but column height may also have an influence on ozone consumption. It is observed that the extents of decolorization and mineralization decrease as the sampling port height increases, in-dicating that the column height may reflect the retention time of ozone gas and the contacting time between ozone and RB5 in the BCR system. Biodegradability is enhanced via ozone treat-ment by measuring the values of BOD5/ COD, which do not ap-pear to be linear to the amount of ozone consumption. However, all results exhibit similar increment trends. The toxicity reduction is estimated by measuring the EC50 of effluent. The largest tox-icity reduction occurs at GL/ GG⬍0.9; it decreases as GL/ GG in-creasing, and the trend does not appear to be linear. As GL/ GG values⬎2.0, the toxicity reduction approaches only to 0.33 in this study. Because of the column height and flow pattern effects, an experimental regression model was proposed in this study to pre-dict the variations of colori/ color0, TOCi/ TOC0, and YSO
4 2−under such conditions.
References
Adams, C. D., and Gorg, S. 共2002兲. “Effect of pH and gas-phase ozone concentration on the decolorization of common textile dyes.” J. Environ. Eng., 128共3兲, 293–298.
Arslan, I., and Balcioglu, I. A. 共2000兲. “Effect of common reactive dye auxiliaries on the ozonation of dyehouse effluents containing vinylsulphone and aminochlorotriazine dyes.” Desalination, 130共1兲, 61–71.
Chen, Y. H., et al. 共2004兲. “Decomposition of 2-mercaptothiazoline in aqueous solution by ozonation.” Chemosphere, 56共2兲, 113–140. Chen, Y. H., et al.共2003兲. “Dynamic behavior of ozonation with pollutant
in a countercurrent bubble column with oxygen transfer.” Water Res., 37共11兲, 2583–2594.
Chen, Y. H., et al.共2002兲. “A dynamic model of ozone disinfection in a bubble column with oxygen mass transfer.” J. Chin. Inst. Chem. Eng.,
33共3兲, 253–265.
Chiang, P. C., Ko, Y. W., Liang, C. H., and Chang, E. E.共1999兲. “Mod-eling an ozone bubble column for predicting its disinfection efficiency and control of DBP formation.” Chemosphere, 39共1兲, 55–70. Deckwer, W. D., and Schumpe, A. 共1993兲. “Improved tools for
bubble column reactor design and scale-up.” Chem. Eng. Sci., 48共5兲, 889–991.
Fig. 11. Prediction profile for colori/ color0, total organic carbon 共TOCi/ TOC0兲 or YSO
4
2− at =2.5 under a fixed gas flow
rate 共GG= 2.1 L / min兲 conditions. Notation: 䊐: GL= 2.0 L / min, 〫:
GL= 2.4 L / min,䉭: GL= 4.0 L / min, and䊊: GL= 6.0 L / min.
Fig. 12. Toxicity reduction of RB5 under different GL/ GG values at=2.5
Fig. 13. Effect of ozone consumption on the toxicity reduction and
European Union. 共2003兲. “European Union Council Directive 2003/ 53/EC amending for the 26th time Council Directive 76/769/EEC relating to restrictions on the marketing and use of certain dangerous substances and preparations 共nonylphenol, nonylphenol ethoxylate, and cement兲.” European Union, L178, 24–27.
Hermanowicz, S. W., Bellamy, W. D., and Fung, L. C.共1999兲. “Variabil-ity of ozone reaction kinetics in batch and continuous flow reactors.” Water Res., 33共9兲, 2130–2138.
Hu, C., Yu, J. C., Hao, Z., and Wong, P. K.共2003兲. “Photocatalytic deg-radation of triazine-containing azo dyes in aqueous TiO2 suspen-sions.” Appl. Catal., B, 42共1兲, 47–55.
Ince, N. H., and Tezcanlí, G.共2001兲. “Reactive dyestuff degradation by combined sonolysis and ozonation.” Dyes Pigm., 49共3兲, 145–153. Jones, K. D., and Huang, W.-H. 共2003兲. “Evaluation of toxicity of
the pesticides, chlorpyrifos and arsenic, in the presence of compost humic substances in aqueous systems.” J. Hazard. Mater., B103共1–2兲, 93–105.
Konsowa, A. H.共2003兲. “Decolorization of wastewater containing direct dye by ozonation in a batch bubble column reactor.” Desalination,
158共1–3兲, 233–240.
Pielesz, A., Baranowska, I., Rybak, A., and Wlochowicz. A.共2002兲 “De-tection and determination of aromatic amines as products of reductive splitting from selected azo dyes.” Ecotoxicol. Environ. Saf. 53共1兲, 42–47.
Perkowski, J., Kos, L., and Ledakowicz, S.共1996兲. “Application of ozone in textile wastewater treatment.” Ozone: Sci. Eng., 18共1兲, 73–85. Sevimli, M. F., and Sarikaya, H. Z.共2002兲. “Ozone treatment of textile
effluents and dyes: Effect of applied ozone dose, pH, and dye concen-tration.” J. Chem. Technol. Biotechnol. 77共7兲, 842–850.
Wang, C., Yediler, A., Lienert, D., Wang, Z., and Kettrup, A. 共2003兲. “Ozonation of an azo dye C.I. Remazol Black 5 and toxicological assessment of its oxidation products.” Chemosphere, 52共7兲, 1225–1232.
Wu, J., and Wang, T.共2001兲. “Ozonation of aqueous azo dye in a semi-batch reactor.” Water Res., 35共4兲, 1093–1099.
Zhou, H., Smith, D. W., and Stanley, S. J.共1994兲. “Modeling of dissolved ozone concentration profiles in bubble columns.” J. Environ. Eng.,