Lung cancer is one of the leading causes of cancer death in Taiwan1,2and worldwide,3with minimal improvement in its poor survival.4In addition to research into innovative treatment modalities, it is important for patients to receive the best standard of care so as to achieve the optimal outcome. However, the ideal scenario that every patient
has received optimal treatment does not always come to pass in real clinical practice. Significant variation in the pattern of care (POC) is often observed, and a wide range of adherence to quality measures, from 19% to 100%, has been reported, depending on where the patient lives.5For lung cancer, 41–69% of patients with non-small cell
Quality of Care for Lung Cancer in Taiwan:
A Pattern of Care Based on Core Measures
in the Taiwan Cancer Database Registry
Chun-Ru Chien,1,2,3Chun-Ming Tsai,4Siew-Tzuh Tang,5Kuo-Piao Chung,6Chao-Hua Chiu,4Mei-Shu Lai2*
Background/Purpose: To investigate the quality of care (QOC) for lung cancer in Taiwan, as measured by
pattern of care (POC) variation.
Methods: Based on core measures in the Taiwan Cancer Database (TCDB) registry, QOC for lung cancer was
measured as variation in POC for 16 selected core measures for different hospital characteristics. Statistical significance in variation was evaluated by the χ2test.
Results: Among the 26 participating hospitals (one excluded as an outlier), 6624 cases of lung cancer were
reported in 2004. Among the 16 core measures (6 in the diagnostic and 10 in the therapeutic domain), no significant variation in POC was noted in 12 in northern and non-northern hospitals. However, significant variation in POC was noted for most (5/6) of the core measures in the diagnostic domain for other hospital characteristics (large vs. small, medical center vs. regional hospital, public vs. private). Increasing utilization of tissue diagnosis, diagnostic computed tomography (CT), and CT or magnetic resonance imaging for staging advanced non-small cell lung cancer was noted in the four participating hospitals from 2002 to 2004.
Conclusion: It is very likely that significant variation in QOC for lung cancer in Taiwan exists among
different types but not locations of hospitals, at least in the diagnostic domain. The introduction of internal benchmarking (TCDB and core measures) was associated with some changes, at least in some diagnostic domains, which may lead to improvement in QOC for lung cancer in Taiwan. [J Formos Med Assoc 2008;107(8):635–643]
Key Words: clinical practice pattern, lung neoplasms, quality of health care, registries
©2008 Elsevier & Formosan Medical Association
. . . .
1Division of Radiation Oncology, Department of Oncology, National Taiwan University Hospital, Institutes of 2Preventive Medicine and 6Health Care Organization Administration, National Taiwan University, 3Department of Radiotherapy and Oncology, China Medical University Hospital, 4Department of Chest Medicine, Taipei Veterans General Hospital, and 5Graduate School of Nursing, Chang Gung University, Taipei, Taiwan.
Received: September 16, 2007 Revised: April 23, 2008 Accepted: April 30, 2008
*Correspondence to: Dr Mei-Shu Lai, Institute of Preventive Medicine, National
Taiwan University, Room 518, 17 Hsuchow Road, Taipei 100, Taiwan. E-mail: [email protected]
lung cancer (NSCLC, the major histologic type) actually received the recommended therapy in a US population-based study.6 Similar findings have been reported for some aspects of POC in Asia.7 The US National Cancer Institute (NCI) has pro-posed to improve the quality of cancer care by developing core process and outcome measures.8 In a US annual report based on cancer registries and NCI POC studies, Edwards et al9 reported a decline in cancer mortality as the dissemination of guideline-based treatment increased. They also found that cancer registries are an important source for monitoring quality of care (QOC). In Taiwan, after approval of the Cancer Prevention and Man-agement Law in 2003, a project was initiated by the Bureau of Health Promotion, Department of Health, and a revised cancer registry (Taiwan Cancer Database; TCDB) was initiated in 2003.10 In the present study, we investigated the present QOC for lung cancer in Taiwan and the impact of the TCDB, represented by variation in POC,11as revealed by the recent TCDB core measure report.12
Methods
Patients and hospitals
According to the recent TCDB core measure report,12the analyzed patients and hospitals were those that participated in the TCDB project as initiated by the Bureau of Health Promotion,
Department of Health. Initially, four hospitals participated in the TCDB for lung cancer in 2002. The number of participating hospitals increased to 27 in 2004, which included all medical cen-ters in Taiwan at the present time.13 Hospital characteristics (Table 1) were specified, including location, service volume, level (medical center or regional hospital), and ownership (public or private). The geographic location was divided into northern (from Kee-Lung city to Hsin-Chu county) and non-northern regions to ensure adequate hos-pital numbers within each category. The number of participating hospitals within north, middle, south and east Taiwan was 10, five, 10 and two, respectively. The hospital volume was based on an-nual operation number. The cut-off point (n= 34) was based on a recent endemic study.14Hospital level was divided into medical centers and regional hospitals, as evaluated by the Taiwan Department of Health.13 This study was based on the data reported from these 27 participating hospitals from year 2002 (n= 4) to 2003 (n = 5) and 2004 (n= 27), excluding one big public medical center in north Taiwan as an outlier for its exceptional reported data.
QOC and core measures
QOC evaluation was based on core measure data in association with the TCDB project. The prelim-inary core measure items were determined by the Delphi method, as previously reported.15In view of the feasibility of data retraction, 16 core mea-sures (6 in the diagnostic and 10 in the therapeutic domain) were finalized, as listed in Table 2. For index D1, either cytologic or pathologic exami-nation was considered to be compliant with the core measure. For index D3, either cardiac func-tion or pulmonary testing was considered to be compliant with the core measure. For index D4, execution of at least one systematic work-up (bone scan, computed tomography [CT], magnetic res-onance imaging [MRI], positron emission tomog-raphy) was considered to be compliant. For indexes T2 and T7, the numerator was based on National Health Insurance (NHI) claim records (code 67010 or 67011). For index T8, the denominator was
Table 1. Characteristics of participating hospitals (n= 27)
Year 2002 2003 2004
4 5 27
Location Northern Non-northern
10 17
Service volume Large* Small
8 19
Level Medical center Regional hospital
18 9
Ownership Public Private
5 22
based on TCDB hospital records. In addition to the above indexes for which multiple core measures were reported, for other indexes, the numerators and denominators were based on the only one reported core measure in the recent TCDB core measure report.12As revealed in this report, the measurement was based on TCDB, cancer registry, and claims data from NHI. The POC for each core measure was calculated by summation of the numerator divided by summation of the denom-inator among different hospital characteristics.
Statistical analysis
POC was expressed as the ratio of patients who received the suggested action among those who were eligible. Patients who had visited different hospitals were counted separately in hospital-specific indexes. Differences between groups were tested by the χ2or Fisher’s exact test. Time trend was tested by the χ2test for trends. For example (see index D2 in Table 3), among 3055 NSCLC patients reported by the 10 hospitals located in northern Taiwan in 2004, 1825 (59.7%) received
Table 2. Selected core measures
Indexes Notation Numerator Denominator
D1 Tissue diagnosis Those with cytopathologic Coded as lung cancer in registry diagnostic approach
D2 Chest CT Those with chest CT at Coded as NSCLC in registry
diagnosis
D3 Preoperative cardiopulmonary Those with preoperative cardiac Coded as NSCLC receiving operation
evaluation or pulmonary evaluation
D4 Preoperative staging Those with staging work-up Coded as NSCLC stage 1–3a receiving operation D5 Staging in advanced stage: Those with bone scan at Coded as NSCLC stage 3b–4
bone scan diagnosis
D6 Staging in advanced stage: Those with brain or spine Coded as NSCLC stage 3b–4 brain or spine MRI MRI at diagnosis
T1 Radical operation for early Those receiving radical Coded as NSCLC stage 1–2
stage NSCLC operation receiving operation
T2 Conservative operation for Those receiving conservative Coded as NSCLC stage 1–2
early stage NSCLC operation receiving operation
T3 Lymph node dissection or sampling Those receiving lymph node Coded as NSCLC stage 1–2 for early stage NSCLC dissection or sampling receiving operation
T4 Adjuvant RT for early NSCLC with Those also receiving RT Coded as NSCLC stage 1–2 receiving
positive margin operation with positive margin
T5 Chemotherapy or RT for Those also receiving RT or Coded as NSCLC stage 1–2 non-operated early NSCLC chemotherapy without operation
T6 Radical operation for stage 3a Those receiving radical Coded as NSCLC stage 3a receiving
NSCLC operation operation
T7 Conservative operation for Those receiving conservative Coded as NSCLC stage 3a receiving
stage 3a NSCLC operation receiving operation
T8 Lymph node dissection or sampling Those receiving lymph node Coded as NSCLC stage 3a receiving for stage 3a NSCLC dissection or sampling operation
T9 Adjuvant RT for stage 3a NSCLC Those also receiving RT Coded as NSCLC stage 3a receiving
with positive margin operation with positive margin
T10 Chemotherapy or RT for Those also receiving RT or Coded as NSCLC stage 3a without non-operated stage 3a NSCLC chemotherapy operation
the recommended CT examination. The corre-sponding figures were 58.1% (1850/3185) for those 17 hospitals in non-northern Taiwan. The difference was not significantly different (χ2test, p= 0.18). Analyses were conducted using SAS
version 9.0 (SAS Institute, Cary, NC, USA) and Egret version 2 (Cytel, Cambridge, MA, USA).
Results
In 2004, 6624 cases of lung cancer were reported by 26 participating hospitals (excluding the one outlier), which may account for 90% of new lung cancer cases in Taiwan, assuming similar lung cancer incidence in 2003 and 2004. There were 7415 cases of lung cancer in Taiwan in 2003, and the data for 2004 are not yet available.1
Variation in POC according to hospital location
Among most (12/16) of the indexes, there was no significant variation in POC among northern and non-northern hospitals (Table 3). However, northern hospitals were associated with more
preoperative imaging staging work-up (index D4), radical operation for early stage NSCLC (T1), lymph node sampling or dissection for early stage NSCLC (T3), and conservative surgery for stage 3a NSCLC (T6).
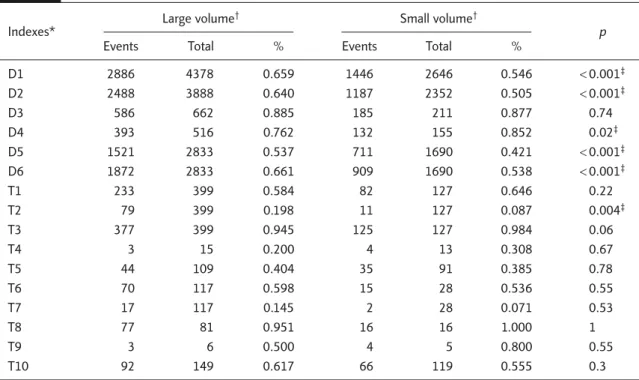
Variation in POC according to hospital service volume
Significant variation in POC existed between large- and small-volume hospitals, mainly in the diagnostic domain (5/6) rather than the thera-peutic domain (1/10) (Table 4). Large-volume hos-pitals were associated with more tissue diagnosis (D1), CT (D2) and staging work-up for advanced stage NSCLC (D5 and D6), less preoperative imaging staging (D4), and similar preoperative cardiopulmonary evaluation (D3).
Variation in POC according to hospital level (medical center or regional hospital)
Significant variation in POC existed between medical centers and regional hospitals, mainly in the diagnostic domain (5/6) rather than the therapeutic domain (1/10) (Table 5). Medical cen-ters were associated with more tissue diagnosis
Table 3. Pattern of care variation with hospital location
Indexes* North Non-northern p
Events Total % Events Total %
D1 2137 3444 0.620 2195 3580 0.613 0.53 D2 1825 3055 0.597 1850 3185 0.581 0.18 D3 400 451 0.887 371 422 0.879 0.72 D4 285 345 0.826 240 326 0.736 0.005† D5 1127 2226 0.506 1105 2297 0.481 0.09 D6 1359 2226 0.611 1422 2297 0.619 0.55 T1 195 267 0.730 120 259 0.463 < 0.001† T2 41 267 0.154 49 259 0.189 0.28 T3 262 267 0.981 240 259 0.927 0.003† T4 4 14 0.286 3 14 0.214 1 T5 32 85 0.376 47 115 0.409 0.65 T6 52 78 0.667 33 67 0.493 0.034† T7 7 78 0.090 12 67 0.179 0.11 T8 55 56 0.982 38 41 0.927 0.31 T9 4 7 0.571 3 4 0.750 1 T10 65 115 0.565 93 153 0.608 0.48
(D1), CT (D2) and staging work-up for advanced stage NSCLC (D5 and D6), less preoperative imaging staging (D4), and similar preoperative cardiopulmonary evaluation (D3).
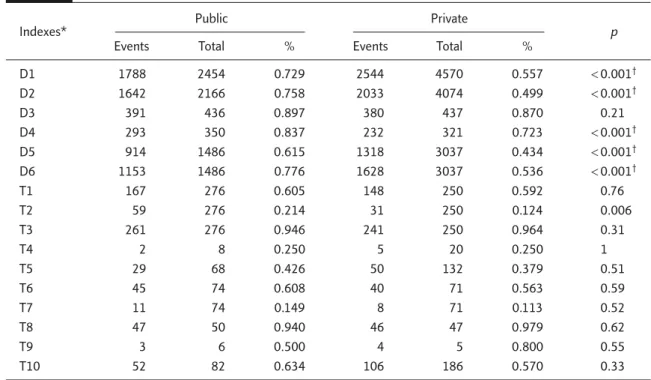
Variation in POC according to hospital ownership (public or private)
Significant variation in POC existed between public and private hospitals, all in the diagnostic domain
Table 4. Pattern of care variation among large- and small-volume hospitals
Indexes* Large volume
† Small volume†
p
Events Total % Events Total %
D1 2886 4378 0.659 1446 2646 0.546 < 0.001‡ D2 2488 3888 0.640 1187 2352 0.505 < 0.001‡ D3 586 662 0.885 185 211 0.877 0.74 D4 393 516 0.762 132 155 0.852 0.02‡ D5 1521 2833 0.537 711 1690 0.421 < 0.001‡ D6 1872 2833 0.661 909 1690 0.538 < 0.001‡ T1 233 399 0.584 82 127 0.646 0.22 T2 79 399 0.198 11 127 0.087 0.004‡ T3 377 399 0.945 125 127 0.984 0.06 T4 3 15 0.200 4 13 0.308 0.67 T5 44 109 0.404 35 91 0.385 0.78 T6 70 117 0.598 15 28 0.536 0.55 T7 17 117 0.145 2 28 0.071 0.53 T8 77 81 0.951 16 16 1.000 1 T9 3 6 0.500 4 5 0.800 0.55 T10 92 149 0.617 66 119 0.555 0.3
*Indexes D1–6 and T1–10: see text; †cut-off for large and small volume is annual operation ≥ 34 or not; ‡p< 0.05.
Table 5. Pattern of care variation between medical centers and regional hospitals
Indexes* Medical centers Regional hospitals p
Events Total % Events Total %
D1 3793 5801 0.654 539 1223 0.441 < 0.001† D2 3175 5152 0.616 500 1088 0.460 < 0.001† D3 695 790 0.880 76 83 0.916 0.33 D4 472 612 0.771 53 59 0.898 0.02† D5 1942 3752 0.518 290 771 0.376 < 0.001† D6 2387 3752 0.636 394 771 0.511 < 0.001† T1 289 477 0.606 26 49 0.531 0.31 T2 84 477 0.176 6 49 0.122 0.34 T3 454 477 0.952 48 49 0.980 0.71 T4 7 26 0.269 0 2 0.000 1 T5 57 159 0.358 22 41 0.537 0.04† T6 80 135 0.593 5 10 0.500 0.74 T7 17 135 0.126 2 10 0.200 0.62 T8 88 92 0.957 5 5 1.000 1 T9 7 11 0.636 0 0 NA NA T10 134 228 0.588 24 40 0.600 0.88
Table 6. Pattern of care variation between public and private hospitals
Indexes* Public Private p
Events Total % Events Total %
D1 1788 2454 0.729 2544 4570 0.557 < 0.001† D2 1642 2166 0.758 2033 4074 0.499 < 0.001† D3 391 436 0.897 380 437 0.870 0.21 D4 293 350 0.837 232 321 0.723 < 0.001† D5 914 1486 0.615 1318 3037 0.434 < 0.001† D6 1153 1486 0.776 1628 3037 0.536 < 0.001† T1 167 276 0.605 148 250 0.592 0.76 T2 59 276 0.214 31 250 0.124 0.006 T3 261 276 0.946 241 250 0.964 0.31 T4 2 8 0.250 5 20 0.250 1 T5 29 68 0.426 50 132 0.379 0.51 T6 45 74 0.608 40 71 0.563 0.59 T7 11 74 0.149 8 71 0.113 0.52 T8 47 50 0.940 46 47 0.979 0.62 T9 3 6 0.500 4 5 0.800 0.55 T10 52 82 0.634 106 186 0.570 0.33
*Indexes D1–6 and T1–10: see text; †p < 0.05.
(5/6) (Table 6). Public hospitals were associated with more tissue diagnosis (D1), CT (D2) and stag-ing work-up for advanced stage NSCLC (D5 and D6), preoperative imaging staging (D4), and simi-lar preoperative cardiopulmonary evaluation (D3).
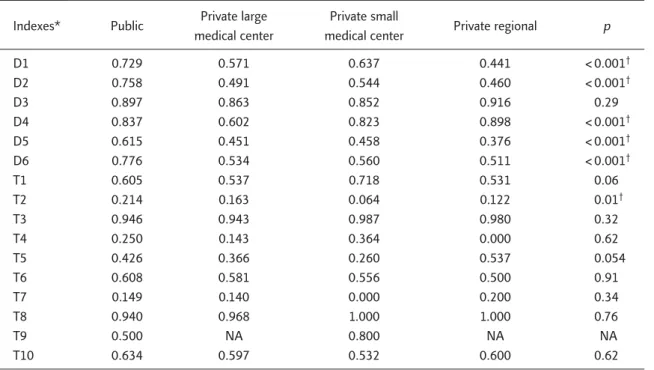
Variation in POC according to composite hospital types
Because all five public hospitals included in the analysis were also large-volume medical centers, hospitals were further divided into four types (public or private large medical centers, private small medical centers, and private regional hos-pitals) for further comparison of heterogeneity. Significant variations in POC were noted mainly in the diagnostic domain (5/6) rather than the therapeutic domain (1/10) (Table 7). For tissue diagnosis (D1), CT (D2) and staging work-up for advanced stage NSCLC (D5 and D6), the de-scending order was public hospitals, followed by small medical centers, large medical centers and regional hospitals. For preoperative imaging stag-ing (D4), the order was regional hospitals, public hospitals, small private medical centers and large private medical centers.
Impact of core measures on the four participants since 2002
Temporal variations in POC for the four partici-pants since 2002 are listed in Table 8. Most (13/16) of the indexes were stable during this period. However, increased utilization of some indexes in the diagnostic domain was noted, which in-cluded tissue diagnosis (D1), CT (D2) and staging work-up for advanced stage NSCLC (D6).
Discussion
To the best of our knowledge, this is the first study on QOC for lung cancer in Taiwan based on core measures and cancer registry. We found that there were significant variations in the diagnostic do-main between different types of hospital, but less marked differences between hospital locations. There was also some significant increase in utiliza-tion of some diagnostic domains after introducutiliza-tion of the TCDB. One of the reasons is that staging information was not available in the prior cancer registry, which hindered the availability of registry-based QOC studies.
Table 7. Pattern of care variation between different kinds of hospitals
Indexes* Public Private large Private small Private regional p medical center medical center
D1 0.729 0.571 0.637 0.441 < 0.001† D2 0.758 0.491 0.544 0.460 < 0.001† D3 0.897 0.863 0.852 0.916 0.29 D4 0.837 0.602 0.823 0.898 < 0.001† D5 0.615 0.451 0.458 0.376 < 0.001† D6 0.776 0.534 0.560 0.511 < 0.001† T1 0.605 0.537 0.718 0.531 0.06 T2 0.214 0.163 0.064 0.122 0.01† T3 0.946 0.943 0.987 0.980 0.32 T4 0.250 0.143 0.364 0.000 0.62 T5 0.426 0.366 0.260 0.537 0.054 T6 0.608 0.581 0.556 0.500 0.91 T7 0.149 0.140 0.000 0.200 0.34 T8 0.940 0.968 1.000 1.000 0.76 T9 0.500 NA 0.800 NA NA T10 0.634 0.597 0.532 0.600 0.62
*Indexes D1–6 and T1–10: see text; †p < 0.05.
Table 8. Temporal variations in pattern of care among four participants from 2002 to 2004
Indexes* 2002 2003 2004 p D1 0.72 0.72 0.76 0.008† D2 0.71 0.75 0.76 0.002† D3 0.92 0.84 0.92 0.89 D4 0.86 0.88 0.91 0.11 D5 0.66 0.69 0.68 0.34 D6 0.72 0.75 0.78 0.003† T1 0.55 0.44 0.54 0.81 T2 0.24 0.15 0.27 0.51 T3 0.94 0.94 0.97 0.23 T4 0.47 0.5 0.25 0.56 T5 0.45 0.48 0.45 0.99 T6 0.47 0.47 0.61 0.18 T7 0.14 0.16 0.23 0.26 T8 1.00 0.97 0.9 0.07 T9 0.09 0.33 0.5 0.09 T10 0.69 0.67 0.69 0.98
*Indexes D1–6 and T1–10: see text; †p< 0.05, χ2test for trend.
However, there are still some shortcomings with the present TCDB and core measures, which are also limitations of the present study. Firstly, small-cell lung cancer was not included in the majority
of core measures, although it constitutes only a small proportion (9% in 2003) of all cases of lung cancer.1Secondly, in the therapeutic domain, there is a lack of core measures for locally advanced
and advanced NSCLC (73% of NSCLC in TCDB 2004),12which is because of a lack of performance status in the present TCDB. Thirdly, the core mea-sures reported so far are all process meamea-sures with-out core with-outcome measures, which are planned for evaluation in TCDB,10but they are not avail-able for the short follow-up period (5 participating hospitals before 2004). Fourthly, the dimensions of the present core measures were limited, mostly focusing on effectiveness instead of other dimen-sions such as patient-centeredness or timeliness, not to mention other cancer-specific dimensions suggested by the recent American Society of Clinical Oncology (ASCO) and European Society for Medical Oncology (ESMO) consensus state-ment.16However, most of these limitations were caused by difficulty in measurement.
Most of the significant variations we found fell in the diagnostic rather than the therapeutic do-main, which may partly be because surgery was infrequently used for lung cancer (16% in cancer registry 2003).1Among the 16 core measures used by the present TCDB report, significant varia-tions in the diagnostic domain were noted among hospital types (volume, accreditation level and ownership), which was consistent with a previous systematic review.17On the other hand, although geographic variation has been reported in many studies (such as in the recent National Initiative for Cancer Care Quality report),5the geographic vari-ations (northern vs. non-northern) in the present study were not significant in most (12/16) of these indexes.
We found that POC in Taiwan was consistent with new clinical evidence in a previous study based on registry data from a single institution.18 We also found increasing compliance with some core measures with increasing years with the TCDB project. A previous systematic review has revealed that outcome is improved with the adop-tion of clinical practice guidelines.19 As these core measures were established from evidence-based clinical guidelines,15we believe that QOC for lung cancer in Taiwan will be improved in the near future.
Acknowledgments
This study was sponsored by a grant (DOH93-HP-1507) from the Bureau of Health Promotion, Department of Health, Executive Yuan, Taiwan.
References
1. Cancer Registry of Taiwan. Available at: http:// crscphntuedutw/crs_c/annual.html [Date accessed: April 4, 2008]
2. Luh KT, Chang DB. Primary lung cancer in Taiwan. J Formos
Med Assoc 1992;91(Suppl 1):S1–7.
3. World Health Organization. Global Burden of Disease
Estimates. Available at: http://wwwwhoint/healthinfo/
bodgbd2002/en/index.html [Date accessed: April 4, 2008]
4. Brenner H, Gondos A, Arndt V. Recent major progress in long-term cancer patient survival disclosed by modeled period analysis. J Clin Oncol 2007;25:3274–80.
5. Malin JL, Schneider EC, Epstein AM, et al. Results of the National Initiative for Cancer Care Quality: how can we improve the quality of cancer care in the United States?
J Clin Oncol 2006;24:626–34.
6. Potosky AL, Saxman S, Wallace RB, Lynch CF. Population variations in the initial treatment of non-small-cell lung cancer. J Clin Oncol 2004;22:3261–8.
7. Teshima T, Japanese PCS Working Group. Patterns of care study in Japan. Jpn J Clin Oncol 2005;35:497–506. 8. Lipscomb J, Snyder CF. The Outcomes of Cancer Outcomes
Research: focusing on the National Cancer Institute’s quality-of-care initiative. Med Care 2002;40(6 Suppl): III3–10.
9. Edwards BK, Brown ML, Wingo PA, et al. Annual report to the nation on the status of cancer, 1975–2002, featuring population-based trends in cancer treatment. J Natl Cancer
Inst 2005;97:1407–27.
10. Website of the Bureau of Health Promotion. Available at: http://www.bhp.doh.gov.tw [Date accessed: April 4, 2008]
11. Dilts DM. Practice variation: the Achilles’ heel in quality cancer care. J Clin Oncol 2005;23:5881–2.
12. Lai MS, Chung KP, Tang ST, et al. Assessment of the health care quality among cancer centers in Taiwan, DOH93-HP-1507. Taipei: Bureau of Health Promotion, 2007. 13. Taiwan Joint Commission on Hospital Accreditation.
Available at: http://www.tjcha.org.tw/96list.asp [Date accessed: August 19, 2007]
14. Lien YC, Huang MT, Lin HC. Association between surgeon and hospital volume and in-hospital fatalities after lung
cancer resections: the experience of an Asian country.
Ann Thorac Surg 2007;83:1837–43.
15. Tang ST, Tsai CM, Chung KP, et al. Establishment of quality indicators for non-small cell lung cancer care. Chest Med 2004;19:463–75. [In Chinese]
16. ASCO–ESMO consensus statement on quality cancer care.
J Clin Oncol 2006;24:3498–9.
17. Hillner BE, Smith TJ, Desch CE. Hospital and physi-cian volume or specialization and outcomes in cancer
treatment: importance in quality of cancer care. J Clin
Oncol 2000;18:2327–40.
18. Chien CR, Lai MS. Trends in the pattern of care for lung cancer and their correlation with new clinical evidence: experiences in a university-affiliated medical center. Am
J Med Qual 2006;21:408–14.
19. Smith TJ, Hillner BE. Ensuring quality cancer care by the use of clinical practice guidelines and critical pathways. J Clin