The Epoxy–Polycarbonate Blends Cured with Aliphatic
Amine—I. Mechanism and Kinetics
MIAW-LING LIN,1 KUO-HUI CHANG,1 FENG-CHIH CHANG,1 MING-SHIU LI,2 CHEN-CHI M. MA2 1Institute of Applied Chemistry, National Chiao Tung University
2Institute of Chemical Engineering, National Tsing Hua University, Hsinchu, 30043, Taiwan
Received 29 November 1996; revised 26 February 1997; accepted 27, 1997
ABSTRACT: Reaction mechanism of the PC – epoxy blends cured by aliphatic amine has been investigated by varying PC contents in the blends. The transamidation reaction tends to convert nearly all the carbonates into N-aliphatic aromatic carbamates even at ambient temperature before normal curing. The remaining amine proceeds the normal curing with epoxy at a higher temperature ( 807C). For the PC–epoxy/aliphatic amine blend containing 6 wt % PC, the yielded N-aliphatic aromatic carbamate further reacts with amine to produce the urea structure. The urea undergoes substitution reaction with the hydroxyl formed from the normal curing to give the N-aliphatic aliphatic carbamate. For the blend containing 12 wt % PC, the N-aliphatic aromatic carbamate converts into the N-aliphatic aliphatic carbamate via two different routes. For the blend containing lower molecular weight of the aliphatic amine, the N-aliphatic aromatic carbamate reacts with hydroxyl to form the N-aliphatic aliphatic carbamate directly. For the blend containing higher molecular weight of aliphatic amine, the N-aliphatic aromatic carbamate decomposes into the aliphatic isocyanate accelerated by the pres-ence of the residual oxirane. The isocyanate formed then reacts with hydroxyl to yield the N-aliphatic aliphatic carbamate. The activation energy ( Ea) and preexponential
factor ( A ) of the PC – epoxy / POPDA blends decrease with the increase of the PC content. Kinetic study by thermal analysis by the method of autocatalyzed model is able to correctly predict oxirane conversion vs. time relationship for the neat epoxy / aliphatic amine and the PC – epoxy / aromatic amine systems because the dominant reaction is the normal curing reaction between amine and oxirane. The model fails to predict the PC – epoxy / aliphatic amine system because the system is complicated by several other reactions besides the normal curing reaction.q 1997 John Wiley & Sons, Inc. J Polym Sci B: Polym Phys 35: 2169 – 2181, 1997
Keywords: epoxy; blend; polycarbonate; transesterification; transamidation; carba-mate; urea
INTRODUCTION
blends cured by aliphatic amine have beeninves-tigated recently.2 – 5 One major characteristic re-vealed in these studies is the infrared absorption One of the earlier studies of the PC – epoxy blend
variations in the carbonyl region during the pro-was reported by Yu and Bell in 1988.1During the
cess of curing. Mera and Umetani2
used bis ( 4-past years, various hardners have been used to
amino-3-methylcyclohexyl ) methane to cure PC – cure the PC – epoxy blend. However, PC – epoxy
epoxy blends, and reported the carbonyl absorp-tion of infrared spectra shifting from 1775 cm01to Correspondence to: F.-C. Chang
1719 cm01. Rong and Zeng3
cured the PC – epoxy Journal of Polymer Science: Part B: Polymer Physics, Vol. 35, 2169 – 2181 ( 1997 )
reported a shift in the position of the carbonyl Procedures and Instrumentations group from 1776 cm01to 1725 cm01. This
phenom-PC was dehydrated at 1207C for 24 h under vac-enon was interpreted as the formation of
hydro-uum before dissolving into epoxy monomer. The gen bonding between carbonyl groups of PC and
mixture of 30 wt % PC in epoxy was prepared by hydroxyl groups of the cured epoxy.3
Chen et al.4
stirring the PC in the epoxy resin at 2207C under obtained homogeneous PC – epoxy blends cured by
dry nitrogen gas for 1 h to give a clear, homoge-diethylenetriamine ( DETA ) and proposed the
neous, and viscous solution. When the mixture presence of hydrogen bonding, resulting in a
mo-was cooled to room temperature, equal equivalent lecular level mixing of the blend system. However,
weight of aliphatic amine was added and mixed our previous studies on PC – epoxy / aliphatic
using a stirrer. Compositions employed in this amine blends revealed that the spectroscopic
vari-study are listed in Table I. Typical curing was ations are due to the formation of carbamates
carried out by three steps: at 807C for 2 h (primary rather than hydrogen bonding.5
curing ) , at 1507C for 2 h (secondary curing), and In this article we will report the reaction
mech-1807C for 2 h (postcuring), respectively. anisms and kinetics of the PC – epoxy / aliphatic
amine blends by varying PC contents and the
mo-Infrared Spectroscopy
lecular weights of polyoxypropylene diamines
( POPDA ) . One drop of the mixture was placed between two
sodium chloride plates and were then mounted on a sample holder in the IR instrument. The heating program was set at 807C for 2 h, at 1507C for 2 h,
EXPERIMENTAL
and at 1807C for 2 h. Infrared spectra wereob-tained on a Perkin – Elmer 842 Infrared Spectrom-eter with a resolution of 2.4 cm01.
Materials
The bisphenol-A base natural grade polycarbo- Differential Scanning Calorimeter
nate with a melt flow rate of 15 ( Mn Å 28,000 )
The kinetic study of the blend was carried out by a used in this study is the Calibre 301-15 from Dow
Du Pont 2100 Differential Scanning Calorimeter Chemical Company. The epoxy prepolymer, DER
( DSC ) , with a heating rate of 107C/min in the 331, used in this study was also purchased from
dynamic scan. The dynamic DSC runs were also Dow Chemical Company, which is a low molecular
used to determine the appropriate isothermal weight liquid diglycidyl ether of Bisphenol-A
analysis temperature to calculate the kinetic pa-( DGEBA ) with a epoxide equivalent weight of
rameters of the curing system. 186 – 192. The polyoxypropylene diamines with
different molecular weights used as hardeners were obtained from Huntsman Chemical Co
in-RESULTS AND DISCUSSION
cluding Jeffamine D230 ( MW Å 230 ) , D400 ( MWÅ 400 ) , and D2000 ( MW Å 2000 ) . The chemical
structures of epoxy, polycarbonate, and polyoxy- Infrared Spectra of PC–Epoxy/POPDA Blend propylene diamines ( POPDA ) are illustrated as
In the aliphatic amine cured PC – epoxy blend, the follows:
aliphatic amine is able to react with the carbonate group of PC to yield the N-aliphatic aromatic car-bamate structure in addition to the usual ring opening with oxirane. As a result of these chemi-cal reactions, essentially no long chain PC is left after curing when an aliphatic amine is em-ployed.5
The presence of PC complicates the reac-tions involved in the curing epoxy system. To in-vestigate the influences of the PC presence in the PC – epoxy / POPDA blend, various ratios of the PC – epoxy blends were employed by curing with equal equivalent of polyoxypropylene diamine
Table I. The Compositions and Codes of the PC – Epoxy/POPDA Blends
Epoxy Amine (g) PC Epo. / Am. PC
Code (g) D230/D400/D2000 (g) (wt %) (wt %) A00 100 30/ — / — 0.00 100 0 A03 100 30/ — / — 4.02 97 3 A06 100 30/ — / — 8.30 94 6 A09 100 30/ — / — 12.86 91 9 A12 100 30/ — / — 17.73 88 12 B00 100 — /50/ — 0.00 100 0 B03 100 — /50/ — 4.64 97 3 B06 100 — /50/ — 9.57 94 6 B09 100 — /50/ — 14.84 91 9 B12 100 — /50/ — 20.45 88 12 C00 100 — /48/12.5 0.00 100 0 C03 100 — /48/12.5 4.96 97 3 C06 100 — /48/12.5 10.24 94 6 C09 100 — /48/12.5 15.87 91 9 C12 100 — /48/12.5 21.89 88 12 D00 100 — /44/25 0.00 100 0 D03 100 — /44/25 5.23 97 3 D06 100 — /44/25 10.79 94 6 D09 100 — /44/25 16.71 91 9 D12 100 — /44/25 23.05 88 12
( POPDA ) . Figure 1 ( I ) presents the infrared spec- disappears almost completely after the secondary curing ( at 1507C for 2 h), as shown in curve C of tra of epoxy / D400 mixture ( Table I B00 ) in the
regions of oxirane. The oxirane peak ( 915 cm01) Figure 1 ( I ) . The spectrum remains unchanged after post curing at 1807C for additional 2 h by comparing curves C and D of Figure 1 ( I ) . In other words, the crosslink density is not expected to in-crease noticeably after further heating though postcuring. There is no absorption present in the region of carbonyl in this blending system because PC is not present in this blend. The classical amine addition curing reaction between epoxy and POPDA is shown as eq. ( 1 ) .16
Figure 1. Infrared spectra of ( I ) DER 331 / D400 Å 100 / 50 ( B00 of Table I ) , ( II ) DER 331 / D400 / PC Å 100 / 50 / 9.57 ( B06 of Table I ) , ( III ) DER 331 / D400 / PC Å 100 / 50 / 20.45 ( B12 of Table I ) recorded in oxirane stretching region. ( A ) Initial, ( B ) 807C for 2 h, (C) 1507C for 2 h, and (D) 1807C for 2 h.
R © NH¤ 1 CH¤CHCH¤ E R © NH © CH¤CHCH¤ E (1) OH O R © NH © CH¤CHCH¤ E OH 2 O R © NH © CH¤CHCH¤ E 1 E OH
1
2
CH¤CHCH¤Figures 1 ( II ) and 2 present the infrared spec-tra of the PC – epoxy / D400 blends containing PC 6 wt % ( Table I B06 ) in the regions of oxirane and carbonyl groups, respectively. The spectrum variation in the region of oxirane of this B06 blend [ Fig. 1 ( II ) ] is similar to that of the neat epoxy [ B00, Fig. 1 ( I ) ] . The carbonate absorption of the original PC at 1780 cm01in the B06 blend ( curve A, Fig. 2 ) shifts to 1740 cm01rapidly even at 257C. This absorption band ( 1740 cm01) is contributed by the N-aliphatic aromatic carbamates formed immediately after mixing from the reaction be-tween the carbonate group of PC and the aliphatic
O (3) R©NH©C©O©BPA©OH 1 R©NH¤ O R © NH © C ©NH©R 1 BPA(OH)¤ O R©NH©C©O©BPA 1 2R©NH¤ O 2R © NH © C ©NH©R 1 BPA(OH)¤
1
2
¤amine as shown in eq. ( 2 ) .7
Curve C of Figure 2 gives the IR spectrum of the same blend in the carbonyl region after sec-ondary curing ( at 1507C for 2 h). The band at 1700 – 1725 cm01 appears, while the intensity of the urea band at 1650 cm01 decreases substan-tially. The absorption band at 1700 – 1725 cm01 can be attributed to the formation of the N-ali-phatic aliN-ali-phatic carbamates through the substitu-tion reacsubstitu-tion between the urea and the hydroxyl group of the epoxy, as shown in eq. ( 4 ) .9
© O © C © O © BPA R © NH © C © O © BPA © OH R © NH © C © O © BPA 1 BPA©OH BPA © O © C © O R©NH¤ O (1) (2) O (2) O Path (1) O R©NH¤ R © NH © C © O © BPA 1 2 BPA©OH O Path (2)
1
2
¤ © BPA 1 O OH (4) OH O H R © N O © C © N © R R © N © CH¤CHCH¤1
2
E ¤ 1 R © NH © C © NH © R CH¤CHCH¤ E 1 R©NH¤ CH¤CHCH¤ EComparing the N-aliphatic aliphatic carbamate During the stage of primary curing at 807C for
2 h, the remaining aliphatic amine undergoes the with the N-aliphatic aromatic carbamate, the substi-tute groups of the former have lower inductive effects usual ring opening reaction with oxirane [ eq. ( 1 ) ]
and the substitution reaction with N-aliphatic than those of the latter and, therefore, cause the absorption of the N-aliphatic aliphatic carbamate aromatic carbamate to form the urea structure.
Curve B of Figure 2 shows that the IR absorption lower (at 1700–1725 cm01) than that of the N-ali-phatic aromatic carbamate (at 1740 cm01). The in-of the N-aliphatic aromatic carbamate at 1740
cm01( curve A ) is converted completely to the urea tensity of the N-aliphatic aliphatic absorption at 1700–1725 cm01further increases after postcuring at 1650 cm01, as shown in eq. ( 3 ) .8
N-aliphatic aliphatic carbamate appeared in the lower frequency at 1720 cm01 after 807C for 2 h. However, there is only small absorption corre-sponding to the isocyanate group that can be found in the IR spectrum ( curve B of Fig. 4 ) . The N-aliphatic aliphatic carbamate formed ( at 1720 cm01) can proceed further substitution reaction by reacting with the hydroxyl group of epoxy [ eq. ( 5 ) ] .9
There is another process to obtain the N-aliphatic N-aliphatic carbamate from N-N-aliphatic aromatic carbamate. The N-aliphatic aromatic carbamate decomposes into the aliphatic isocya-nate and phenol [ eq. ( 6 ) ] .10
The aliphatic isocya-nate can react with the hydroxyl group of epoxy to yield the N-aliphatic aliphatic carbamates [ eq. ( 7 ) ] .11
The decomposition reaction of the N-ali-phatic aromatic carbamate at 807C is accelerated by the presence of oxirane as shown in eq. ( 8 ) .12 Figure 2. Infrared spectra of the DER 331 / D400 / PC
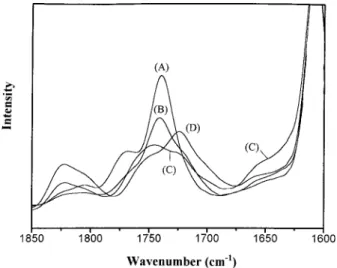
Å 100 / 50 / 9.57 blend ( B06 of Table I ) recorded in the carbonyl stretching region. ( A ) 257C for 3 min, (B) 807C for 2 h, ( C ) 1507C for 2 h, and (D) 1807C for 2 h.
at 1807C for 2 h (curve D of Fig. 2) as would be expected.
It is interesting to note that the intensity of oxi-rane absorbed at 915 cm01further decreases after postcuring compare curves C and D of Figure 1 ( II ) . The substitution reaction between urea and hydroxyl groups of the epoxy network releases amine [ eq. ( 4 ) ] that can further react with the residual epoxide ring. Consequently, the cross-linking density of blend is expected to be in-creased after postcuring.
Figures 1 ( III ) and 3 present the infrared spec-tra of PC – epoxy / D400 blend containing 12 wt % PC ( B12, Table I ) in the regions of oxirane and
O OH (5) OH O H R © N O © C © N © R R © N © CH¤CHCH¤
1
2
E ¤ 1 R © NH © C © O © BPA © OH CH¤CHCH¤ E CH¤CHCH¤ E 1 BPA(OH)¤carbonyl group, respectively. Again, the IR ab-sorption of the carbonate group of PC at 1780 cm01 shifts to 1740 cm01instantly ( curve A, Fig. 3 ) due to fast transamidation reaction. However, curve
O
(6) R © NH © C © O © BPA
R © N ® C ® O 1 HO©BPA
B of Figure 3 shows that absorption band of the N-aliphatic aromatic carbamate at 1740 cm01 is unchanged after primary curing ( 807C for 2 h) but its intensity is substantially reduced and the appearance of the urea absorption at 1650 cm01. The major spectroscopic difference between the B12 system and that of the B06 system is the greater PC content in the B12 system than that of the B06 system ( 12 wt % vs. 6 wt % ) . The relative amount of aliphatic amine available for substituting the N-aliphatic aromatic carbamate into the urea structure is considerably less in the B12 system than that of the B06 system. Addition-ally, there is a shoulder peak corresponding to the
OH (7) R © N ® C ® O 1 R©N©CH¤CHCH¤ E
1
2
¤ OH O H R © N O © C © N © R CH¤CHCH¤ E CH¤CHCH¤ E(8) E CH¤CHCH¤ R © N © C © O © BPA O H ¨ O 1 E CH¤CHCH¤ © O © BPA OH 1 R © N ® C ® O E CH¤CHCH¤ R © N © C © O © BPA O H 1 E CH¤CHCH¤ O H R © N ® C ® O 1 O©BPA ¨ ¨ O 2 ¨ ¨ ¨ 2
Curves A, B, C, and D of Figure 4 present the quantity of the PC in the blend reduces the ratio of ( amine – carbonate ) / oxirane. At a fixed PC con-infrared spectra recorded in the isocyanate
stretching region of the mixtures A12, B12, C12, tent, the PC – epoxy blend cured by a higher mo-lecular weight of POPDA, the ( amine – carbon-and D12 ( Table I ) after 2 h at 807C. The
isocya-nate absorption appears on the PC – epoxy blend ate ) / oxirane ratio tends to be less. In other words, more residual oxirane is available to accelerate cured by the highest molecular weight of POPDA
( D12 ) but such absorption is considerably reduced the decomposition of the N-aliphatic aromatic car-bamate [ eq. ( 8 ) ] if the higher molecular weight or absent on those blends cured by those lower
molecular weight of POPDAs ( A12, B12, and C12 ) POPDA is employed. As mentioned above, the N-aliphatic N-aliphatic carbamate can be produced under the same curing conditions. Increasing
from two different routes via eqs. ( 5 ) and ( 7 ) . However, the reaction via eq. ( 5 ) is more prefera-ble than that of eq. ( 7 ) because the latter mecha-nism does not occur in some blending systems.
Curves C to D of Figure 3 show that most of the N-aliphatic aromatic carbamate at absorption 1740 cm01 converts to the N-aliphatic aliphatic carbamate ( 1725 cm01) . Although the infrared spectra of the final products of B06 system ( 6 wt % PC, curve D of Fig. 2 ) is similar with that of the B12 system ( 12 wt % PC, curve D of Fig. 3 ) ; however, the reaction mechanisms involved are different as described above.
Curing Kinetics
Dynamic DSC
Figure 3. Infrared spectra of the DER 331 / D400 / PC
Figure 5 ( I ) and ( II ) shows the DSC heating
ther-Å 100 / 50 / 20.45 blend ( B12 of Table I ) recorded in the
mograms ranging from 0 – 3007C of neat epoxy/
carbonyl stretching region. ( A ) 257C for 3 min, (B) 807C
con-5 ( I ) ( A00 ) , the peak temperature decreases by 18.27C and the DHo is only 69.8% of the virgin
system. Lower peak temperature indicates higher reaction rate of the A12 blend relative to that of the virgin system. The reasons for the observed lower DHo of the A12 system than that of A00
system are very complex that should include: ( 1 ) the effect of concentration: the amounts of oxirane and amine are only 88% of the virgin system; ( 2 ) the effect of transamidation: the reaction [ eq. ( 2 ) ] between amine and carbonate proceeds at a much high rate at room temperature ( curve A of Figs. 2 and 3 ) , the exotherm of this reaction is not in-cluded in these thermograms; ( 3 ) the effect of nonstoichiometry: the ratio of amine participating in the transamidation reaction does not react with Figure 4. Infrared spectra of PC – epoxy / POPDA
blends with 12 wt % PC in the isocyanate stretching region after 807C for 2 h. (A) A12, (B) B12, (C) C12, ( D ) D12.
taining 12 wt % PC. Curves A, B, and C of these figures represent the increase of POPDA molecu-lar weight, as shown in Table I. The observed exo-thermic peak temperature ( Tp) decreases with the
decrease of the POPDA molecular weight while the heat of reaction (DHo) reverses the trend. The
exothermic peak temperatures of epoxy cured with POPDAs in the blends of A00, B00, and D00 are 122.6, 130.7, and 136.27C, respectively. The heat of reaction (DH ) of A00, B00, and D00 blends
are 390.5 J / g, 326.7, and 270.7 J / g, respectively. This obtained result is reasonable because the blend containing higher molecular weight of POPDA has less absolute amine functional groups for the curing reaction based on equal weight of sample.
Another characteristic revealed in these DSC scans of the PC – epoxy / POPDA systems [ Fig. 5 ( II ) ] is the presence of two distinct exothermic peaks. The first peak is mainly contributed by the heat generated via normal curing reaction be-tween POPDA and epoxide. The substitution reac-tion occurring at a higher temperature contri-butes the second minor exothermic peak. The sub-stitution reactions between N-aliphatic aromatic carbamate or urea with hydroxyl group have been identified by spectroscopy previously. The pres-ence of 12 wt % PC in these blends results in
substantial reduction of peak temperature and Figure 5. DSC dynamic runs in the temperature
DH of the first exothermic peak. Comparing curve range between 307C and 3007C (I): (A) A00, (B) B00, and ( C ) D00, ( II ) ( A ) A12, ( B ) B12, and ( C ) D12.
oxirane, causing nonstoichiometry between oxi-rane and amine; and ( 4 ) the effect of substitution: reaction heat of these reactions [ eqs. ( 4 ) and ( 5 ) ] may be substantially lower than that of the nor-mal curing reaction [ eq. ( 1 ) ] .
Comprising these effects, the observed reaction heat (DH ) by DSC scans decreases significantly
as PC content increases.
Kinetics by Borchardt and Daniels Method
The dynamic DSC runs shown in Figures 5 ( I ) and ( II ) have been used to calculate the kinetic parameters according to the Borchardt and Dan-iels ( B & D ) method.13
The method assumes that Figure 6. Plots of log k vs. 1 / T for ( A ) DER 331 / D400 the reaction follows n th order kinetics as below: Å 100 / 50 blend ( B00 of Table I ) , and ( B ) DER 331 /
D400 / PC Å 100 / 50 / 20.45 blend ( B12 of Table I ) . da/ dt Å k ( 1 0a)n
( 9 )
Figure 6 shows an Arrhenius plot of ln k vs. 1 / T for the virgin ( B00 ) and the PC-containing blend The reaction rate ( da/ dt ) is obtained by
divid-( B12 ) over the region from 10% peak height to ing the peak height ( d H / dt ) at temperature T by
50% peak area of the DSC exotherm. Both plots the total heat of the reaction (DHo) [ eq. ( 10 ) ] ,
of ln k against 1 / T show fairly good straight lines. and the fractional conversion (a) is decided by
These obtained results imply that these systems measuring the ratio of the partial area,DHp, at
follow the n th order kinetics and the Arrhenius temperature T to the total peak area [ eq. ( 11 ) ] .
expression when the conversion of reaction is less than 50%.
da/ dt Å ( d H / dt ) /DHo ( 10 ) Table II summarizes the obtained reaction
or-der ( n ) , activation energy ( Ea) and
preexponen-aÅDHp/DHo ( 11 )
tial factor ( A ) of various epoxy / POPDA and PC – epoxy / POPDA blends. As shown in this table, the presence of PC decreases the activation energy Borchardt and Daniels’s technique also
as-of the reaction between oxirane and amine. The sumes the reaction rate constant ( k ) obeys the
transamidation reaction [ eqs. ( 2 ) and ( 3 ) ] pro-Arrhenius expression:
duces the phenolic – OH chain ends that can act as a catalyst for the epoxy / amine curing reaction.
k Å A exp ( 0 Ea/ RT ) ( 12 )
However, dilution by the PC presence results in lower concentrations of epoxy and amine in the PC – epoxy / POPDA blends are than those of the Where A Å preexponential factor ( 1 / s ) ; Ea
virgin epoxy / POPDA blends. Additionally, the Å activation energy ( J /mol ) ; R Å 8.314 ( J /mol K ) ;
transamidation reaction would further reduce the and T Å absolute temperature ( K ) .
concentrations of amine in the blend and causes Substituting eq. ( 12 ) into eq. ( 9 ) and taking
those blends less than stiochiometric. These phe-logarithms produce eq. ( 13 ) , as follows:
nomena would decrease the effective collisions be-tween epoxy and amine and cause lower of the ln ( da/ dt ) Å ln k / n ln ( 1 0a) preexponential factor ( A ) . Compromising these effects, the presence of PC in the epoxy / POPDA Å ln A 0 Ea/ RT / n ln ( 1 0a) ( 13 )
still results in higher curing rate between epoxy and aliphatic amine. The activation energies of epoxy / POPDA systems obtained from the Bor-The reaction rate and the fractional conversion
from eqs. ( 10 ) and ( 11 ) are required in order to chardt and Daniels analysis are 60 – 70 KJ /mol, which are higher than the similar values from solve eq. ( 13 ) with a multiple linear regression.
other epoxy / aliphatic amine systems previously Knowing the kinetic parameters n , Ea, and A ,
we should be able to estimate the conversion as a reported in the literature.13 – 15
This may be due to
certain autocatalyzing behavior by the hydroxyl- function of time and temperature. However, re-sults from Figures 8 and 9 show that the experi-containing intermediates produced from the
cur-ing reaction. The autocatalyzed mechanism of ep- mental values deviate substantially from the pre-dicted values.
oxy / amine system is expressed as following16 :
Kinetics by Autocatalytic Method
The dynamic DSC runs [ Fig. 5 ( I ) and ( II ) ] are also used to determine the appropriate isothermal analysis temperature to calculate the kinetic pa-rameters of the autocatalytic model. In this case, the isothermal temperatures are selected between the onset of curve and a point midway to the peak maximum at 80, 90, and 1007C, respectively. The autocatalytic model is expressed by eq. ( 13 ) , where the fractional conversion (a) is measured by the partial heat of reaction (DHp) obtained
from the isothermal analysis divided by the total heat of the reaction obtained from the dynamic DSC run (DHo) .
da/ dt Å Kam
( 1 0a)n
( 15 ) Taking logarithms of eq. ( 15 ) yields eq. ( 16 ) as follows:
log ( da/ dt ) Å log K / log [am( 1 0
a)n]
Å log K / n[ logam / n
( 1 0a) ] ( 16 ) Polts of log ( da/ dt ) vs. [ logam / n
( 1 0a) ] of vir-gin and blend systems ( Fig. 7 ) at various temper-atures result in good linear relationship up to 68 – 74% conversion. The observed linear relationship indicates that these systems follow the autocata-lytic model. If we assume the reaction rate con-stant ( k ) obeys the Arrhenius expression as eq. ( 12 ) , the reaction order ( m and n ) , activation en-ergy ( Ea) , and preexponential factor ( A ) can be
determined and the results are tabulated in Table II. The observed trend in kinetic parameters by this autocatalytic method is similar to that of the Borchardt and Daniels method. The presence of PC reduces activation energy ( Ea) and
preexpo-nential factor ( A ) of the blend. Another character-istic revealed in this model is that the reaction order ( m ) representing the autocatalyzed effect is very small in these PC – epoxy / POPDA blends. This result is reasonable because the phenol has been found to be a more powerful proton donor in the epoxy curing than that of the aliphatic
alco-(14) CH¤ © CH E 1 HX NH 1 1 1 1 2 2 Fast O O Rπ R∏ CH¤ © CH E O N © H Rπ R∏ HX CH¤ © CH E O HX HX O HX CH¤©CH E N © H Rπ R∏ CH¤©CH E 1 O HX N © H Rπ R∏ CH¤©CH E N © CH¤ © CH E 1 HX Rπ R∏ 1 OH OH N © H X Rπ R∏ CH¤©CH E Fast Fast 2
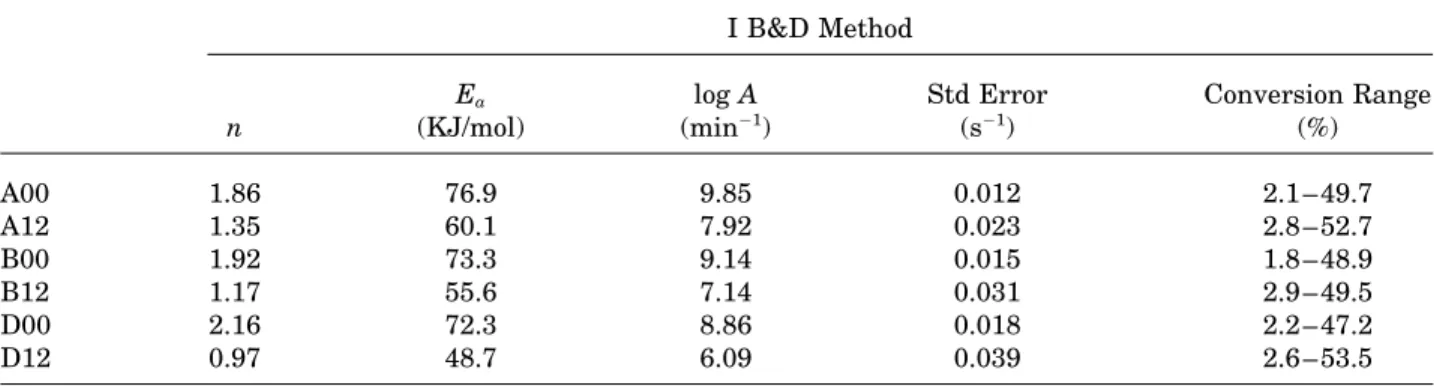
Table II. The Kinetic Parameter of PC – Epoxy/POPDA Blend Calculated by (I) B&D Method and ( II ) Autocatalyzed Method
I B&D Method
Ea log A Std Error Conversion Range
n (KJ/mol) (min01) (s01) (%) A00 1.86 76.9 9.85 0.012 2.1 – 49.7 A12 1.35 60.1 7.92 0.023 2.8 – 52.7 B00 1.92 73.3 9.14 0.015 1.8 – 48.9 B12 1.17 55.6 7.14 0.031 2.9 – 49.5 D00 2.16 72.3 8.86 0.018 2.2 – 47.2 D12 0.97 48.7 6.09 0.039 2.6 – 53.5
n represents the reaction order. Earepresents the activation energy. A represents the preexponential factor.
II Autocatalyzed Method
Ea log A Conversion Range
n m (KJ/mol) (min01) (%) A00 1.76 { 0.05 0.25 { 0.02 48.9 { 1.0 6.13 { 0.14 5.1 – 70.0 A12 1.70 { 0.07 0.10 { 0.03 46.1 { 1.4 6.04 { 0.21 5.2 – 74.2 B00 1.73 { 0.05 0.18 { 0.03 45.8 { 1.1 5.53 { 0.16 5.5 – 72.5 B12 1.73 { 0.10 0.07 { 0.05 38.1 { 2.3 4.85 { 0.32 5.9 – 73.4 D00 1.91 { 0.05 0.18 { 0.03 42.2 { 1.8 4.91 { 0.25 4.9 – 68.1 D12 1.89 { 0.07 0.04 { 0.03 39.7 { 1.4 4.86 { 0.21 5.0 – 68.3
m and n represent the reaction order. Earepresents the activation energy. A represents the preexponential factor.
hol.17
Cure acceleration due to the alcoholic hy- appears more accurate than the B&D method in predicting the result of the PC – epoxy POPDA droxyl formed during process of epoxy curing has
not been positively identified in these PC – epoxy / blends.
The results of these kinetic analyses can also POPDA blends.
The calculated kinetic parameters, m , n , Ea, be verified using the infrared spectroscopic
tech-nology. The conversion of the epoxy curing is de-and A can be substituted into the integrated
auto-catalytic model to estimate the epoxy conversion termined directly by the heat changes of DSC and by the infrared absorption of the oxirane band. as a function of time and temperature, and the
results are given in Figures 8 and 9. Figure 8 shows that both experimental conver-sions vs. time of the neat epoxy / D400 blend ( B00 ) The results of these kinetic analyses by
Bor-chardt and Daniels method and the autocatalytic at 807C are in good agreement with the predicted curve by the autocatalyzed method. Figure 9 pres-method ( curves A and B of Figs. 8 and 9 ) can be
verified by partially reacting the blend and then ents the conversion vs. time of the PC – epoxy / D400 blend ( B12 ) at 807C. It shows that the ex-comparing its residual reactivity to that by the
calculated values. In this experiment, the uncured perimental results obtained by DSC method is in good agreement with the predicted curve by the blend is held isothermally at 807C and a time that
is partially cured. The sample is then dynamically autocatalyzed method ( square symbol and curve B, Fig. 9 ) . However, Figure 9 also shows that the heated and compared the remaining heat of
cur-ing to theDHoof the blend to yield a % conversion. oxirane conversion vs. time of this PC – epoxy /
D400 blend by the IR spectroscopic method is de-Figures 8 and 9 compare the actual ( by DSC ) and
predicted value ( triangle symbol and curve B, Fig. 9 ) . In other words, the autocatalytic model can successfully predict the cure kinetics of the neat PC – epoxy system but fails to predict the PC – epoxy / POPDA blend. The failure to model the PC-containing systems is due to that the heat evolved by the thermal analysis in a small time interval is assumed to be directly proportional to the num-ber of moles reacted during that time interval.13 As mentioned earlier, various reactions take place during the curing of the PC – epoxy / POPDA blend and their individual heat of reactions are not ex-pected to be the same. It is difficult or nearly
im-possible to resolve the heat produced by each reac- Figure 8. Plots of conversion vs. time at 807C for (A) B00 system modeled by the B&D method, ( B ) modeled
tion. The model based on the thermal analysis is
by the autocatalytic method, (j) found by dynamic
improper by assuming that all the heat produced
DSC after isothermal holding and (m) found by the
has come from the normal curing between amine
infrared spectroscopic analysis.
and oxirane and by neglecting contributions from other reactions. This is why the model can suc-cessfully predict the neat epoxy / POPDA system because only the normal curing is involved. In addition, transamidation reaction causes reduc-tion of the amine, and the remaining oxirane in the blend can be quantified by the infrared spec-troscopy. In the thermal analysis approach, ex-cess of the oxirane due to transamidation has not been taken into consideration. This is why the conversion represented by the spectroscopic tech-nology ( triangle symbol of Fig. 9 ) is substantially lower than that by the thermal analysis ( curve B of Fig. 9 ) .
Figure 7. Plots of log ( da / dt ) vs. log [ am / n( 1 0 a ) ] ( I ) Figure 9. Plots of conversion versus time at 807C for
( A ) B12 system modeled by the B&D method, ( B ) mod-DER 331 / D400 Å 100 / 50 blend ( B00 of Table I ) . ( A )
at 807C, (B) at 907C, and (C) at 1007C and (II) DER eled by the autocatalytic method, (j) found by dynamic DSC after isothermal holding, and (m) found by the 331 / D400 / PC Å 100 / 50 / 20.45 blend ( B12 of Table I ) :
Comparison of the PC–Epoxy Blend Cured by Aliphatic and Aromatic Amine
As revealed in Figures 2 and 3, the transamida-tion reactransamida-tion takes place rapidly in the PC – epoxy / aliphatic amine blend. The inductive effect of this aromatic structure of the substitute group makes the carbonate carbon highly electrophilic, which can be easily attacked by a nucleophilic reagent. The aliphatic amines in the PC – epoxy blend act as a nucleophile that can attack the oxirane and the carbonate at the same time. This study has shown that the reaction rate of aliphatic amines
( POPDAs ) with carbonate is significantly higher Figure 11. Plots of conversion vs. time at 807C for
than that with oxirane. However, when an aro- the DER 331 /MPDA / PC Å 100 / 16 / 15.8 blend: ( A ) pre-dicted by autocatalytic method, (j) found by dynamic
matic amine is used to cure the blend, the
situa-DSC after isothermal holding, and (m) found by the
tion is quite different. An aromatic amine,
meta-infrared spectroscopic analysis.
phenylene diamine ( MPDA ) , was utilized to cure the PC – epoxy blend to study the reaction between carbonate and aromatic amine.18
Curves A, B, and
that is lower than that of the original carbonate C of Figure 10 are the spectra of initial, 2 h at
absorption at 1780 cm01due to the transesterifi-807C, and 2 h at 1507C, respectively. There is little
cation reaction. The carbonate of PC transesteri-spectroscopic variation in the carbonate group of
ficates with the hydroxyl group formed from the PC ( compare curves A and B ) even after 2 h at
curing of oxirane with amine at higher tempera-1507C. Lower nucleophility of the aromatic amine
ture. Therefore, the transesterification should not due to electron attraction by the benzene ring
re-influence the kinetic results of the normal curing quires more stringent conditions to react with the
carried out at 80 – 1007C. carbonate of PC. In other words, an aromatic
The autocatalytic model [ eq. ( 14 ) ] was also amine can only proceed by normal curing reaction
used to calculate the kinetic parameters m , n , with oxirane in the PC – epoxy / aromatic amine
Ea, and A .
18
There data were substituted into the blend at 807C or below. Curve C of Figure 10
integrated autocatalytic model to estimate con-shows the carbonyl absorption peak at 1760 cm01
version as a function of time and temperature ( curve A, Fig. 11 ) . The verification of the kinetic results using DSC autocatalytic methods and in-frared spectroscopic measurements are illus-trated in Figure 11. Comparing these curves, the experimental obtained DSC and IR results are in good agreement with the predicted conversion. Thus, the autocatalytic model and the associated kinetic parameters can also successfully describe the kinetics of the neat and the PC – epoxy / aro-matic amine systems.
CONCLUSION
The reaction mechanisms of the PC – epoxy blend cured by aliphatic amine are influenced by the amount of PC presence in the blend. For the blends containing lower PC content ( PC 6 wt % ) , Figure 10. Infrared spectra of the DER 331 /MPDA /
the transamidation reaction converts nearly all
PC Å 100 / 16 / 15.8 blend recorded in the carbonyl
the carbonate and fraction of the amine into
N-stretching region: ( A ) initial, ( B ) 807C for 2 h, and (C)
This research is financially supported by the National
mixing at an ambient condition. Further amine
Science Council, Taiwan, R.O.C., under contract No.
substitution of this carbamates into ureas takes
NSC 86-2216-E-009-002. We thank Epolab Chemical
place at the high temperature of 807C. The
re-Co. for supplying the materials.
maining amine precedes the normal curing reac-tion with oxirane and produces the hydroxyl at the same time. The produced hydroxyl is able re-act with urea to yield the N-aliphatic aliphatic
REFERENCES AND NOTES
carbamate at 1507C. For the blend containinghigher PC content ( PC 12 wt % ) , the transamida-tion reactransamida-tion takes place first. Then, most of the
1. Y. Yu and J. P. Bell, J. Polym. Sci., Part A, 26, 247
produced N-aliphatic aromatic carbamate con- ( 1988 ) .
verts into N-aliphatic aliphatic carbamates at 2. H. Mera and H. Umetani, Jpn. Pat. 02,170,822 807C via two routes: (1) by reacting N-aliphatic ( 1990 ) .
aromatic carbamate with the hydroxyl formed 3. M. Rong and H. Zeng, Proc. Inter. Chinese Symp. from the normal curing directly, and ( 2 ) decompo- on Polymer Blends, Hsin Chu, Taiwan, July, 1995. sition of the N-aliphatic aromatic carbamate into 4. M. C. Chen, D. J. Hourston, and W. B. Sun, Eur.
Polym. J., 28, 1471 ( 1992 ) . the aliphatic isocyanate followed by reacting with
5. M. L. Lin, F. C. Chang, M. S. Li, and C. C. M. Ma,
the hydroxyl to yield the N-aliphatic aliphatic
car-J. Polym. Sci., Part B, to appear. bamates. The latter route occurs more
signifi-6. B. Ellis, Chemistry and Technology of Epoxy
Res-cantly in the PC – epoxy blend cured by the higher
ins, Blackie Academic & Professional, London, molecular weight of aliphatic amine because more
1994.
residual oxirane is available to accelerate the
de-7. V. S. Foldi and T. W. Campbell, J. Appl. Polym.
composition of the N-aliphatic aromatic
carba-Sci., 56, 1 ( 1962 ) .
mates. The activation energy ( Ea) and preexpo- 8. G. Oertel, Polyurethane Handbook, Macmillan
nential factor ( A ) of the PC – epoxy / POPDA Publishing Co., Inc., New York, 1985.
blends decrease with increasing the PC content. 9. H. G. J. Overmars, Encyclopedia Polym. Sci. Tech-However, the kinetic study using the autocata- nol., 11, 480 ( 1969 ) .
lyzed model is able to predict only the oxirane 10. R. R. Myers and J. S. Long, Treatise on Coatings, conversion vs. time from DSC thermal analysis, Marcel Dekker, New York, 1967.
and IR spectroscopic results for the neat epoxy / 11. J. G. Saunder and K. C. Frisch, Polyurethanes: Chemistry and Technology, vols. I and II, Wiley POPDA and the PC – epoxy / aromatic amine
sys-Interscience, New York, 1962.
tems at 807C because only the normal curing
reac-12. R. E. Hartz, J. Appl. Polym. Sci., 19, 735 ( 1975 ) .
tion is involved. DSC has often been applied in
13. R. B. Prime, in Thermal Characterization of
Poly-the analysis of simple reactive systems but it is
meric Materials, E. A. Turi, Ed., Academic Press, unable to apply to the system where many
differ-New York, 1981.
ent reactions are involved. The IR method has
14. R. B. Prime, Polym. Eng. Sci., 12, 120 ( 1972 ) .
the advantage of direct determination of certain
15. J. M. Barton, Epoxy Resins and Composites I, K.
particular types of functional groups and their Dusek, Ed., Springer Verlag, Berlin, 1985. concentrations relative to a known standard. Any 16. W. G. Potter, Epoxide Resins, Springer-Verlag, reactive system can be monitored by the absorp- New York, 1970.
tion changes of these groups with time. Further 17. H. Lee and K. Neville, Handbook of Epoxy Resins, study by FTIR, which will appear later, is in prog- McGraw-Hill, New York, 1967.
ress to determine the kinetics of the PC – epoxy / 18. M. S. Li, C. C. Ma, and F. C. Chang et al., Polymer, 38, 855 ( 1997 ) .


![Figure 7. Plots of log ( da / dt ) vs. log [ a m / n ( 1 0 a ) ] ( I ) Figure 9. Plots of conversion versus time at 807C for](https://thumb-ap.123doks.com/thumbv2/9libinfo/7616629.130833/11.918.480.791.67.291/figure-plots-log-figure-plots-conversion-versus-time.webp)
