High-index sensitivity of surface mode in
photonic crystal hetero-slab-edge microcavity
Tsan-Wen Lu,*Yi-Hua Hsiao, Wei-De Ho, and Po-Tsung Lee
Department of Photonics and Institute of Electro-Optical Engineering, National Chiao Tung University, Rm. 415 CPT Building, 1001 Ta-Hsueh Road, Hsinchu 300, Taiwan
*Corresponding author: [email protected]
Received January 15, 2010; revised March 24, 2010; accepted March 25, 2010; posted April 1, 2010 (Doc. ID 122763); published April 30, 2010
We introduce a photonic crystal hetero-slab-edge microcavity design with surface mode, which is beneficial for optical index sensing. The simulated index sensitivity共Rn兲 as high as 675 nm per refractive index unit (nm/RIU) variation is obtained with slab thickness of180 nm. In experiments, single surface mode lasing action from a real device is observed. Based on the surface mode in this microcavity, high experimentalRn value of 625 nm/RIU is achieved by detecting index variation in a CO2 chamber with different gas
pressures. © 2010 Optical Society of America OCIS codes: 140.5960, 230.5298, 230.5750.
Optical index sensing via resonances in different pho-tonic structures [1,2] has long been a practical tool in various research fields. Especially in biological re-searches, this approach provides a fast and precise way to detect very small variation of analytes. In re-cent years, various resonance structures have been reported for highly sensitive optical index sensors, in-cluding surface plasmon resonance [3], long-period grating fiber [4], silica ring and sphere resonators [5–7], etc., where the resonance wavelength shift is usually used to estimate the analyte variation. How-ever, considering their device sizes, most of them may not be compact enough when we want to realize a versatile optical sensing integrated chip with very compact size. Fortunately, a photonic crystal (PhC), an artificial material with periodic dielectric varia-tion, hosts the advantage of well-controlling photon flow in wavelength scale owing to the photonic band gap (PBG) effect. Various PhC micro- and nanocavi-ties have been proposed (see [8–13] for the most re-cent works) to serve as optical sensors with advan-tages of high sensitivity and very compact size. The ultrasmall mode volume in PhC cavities also permits optical sensing with very low analyte consumption (typically, less than 1 fL) [9,12], which is beneficial for certain analyte with very limited amount.
In our previous work [14], we have proposed and demonstrated a PhC hetero-slab-edge (HSE) micro-cavity laser. In this design, the defect mode is con-fined in surface wave form at the PhC slab edge ow-ing to PBG and total internal reflection effects. Compared with most defect modes confined inside PhC micro- and nanocavities [8–11], the surface mode energy field extends more into the environ-ment, which is very beneficial for optical index sens-ing because of the strong interaction between surface mode and environmental analytes. Based on this PhC HSE microcavity design, in this Letter, we re-duce the microcavity slab thickness to obtain high in-dex sensitivity (Rn, defined as wavelength shift per
refractive index unit variation, nm/RIU) for serving as an optical index sensor. In experiments, we dem-onstrate the surface mode lasing in a PhC HSE
microcavity and its highly sensitive optical index sensing functionality by detecting CO2with different pressures.
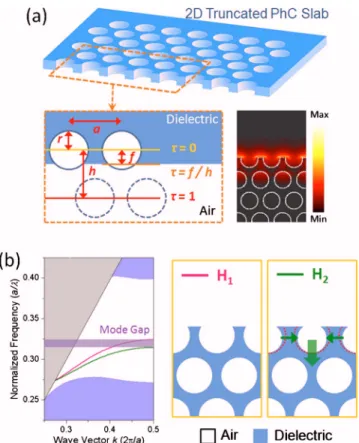
In a 2D truncated PhC slab, shown in Fig.1(a), the surface wave will form and propagate along the inter-face between the dielectric PhC slab and air, as shown by the simulated electric field distribution in the inset of Fig. 1(a). Different truncated PhC slab
Fig. 1. (Color online) (a) Scheme of 2D truncated PhC slab surrounded by air and the definition of slab-edge termina-tion parameter . The simulated surface mode in electric field propagating along the slab edge with =0.25 is also shown in the inset. (b) Calculated dispersion curves of sur-face modes propagating along the PhC slab edges H1 and H2. The dark gray (purple online) shadow represents the
mode gap formed by H1and H2.
1452 OPTICS LETTERS / Vol. 35, No. 9 / May 1, 2010
terminations with defined in Fig. 1(a) will lead to different surface wave properties [15]. For two differ-ent slab edges, H1and H2, shown in Fig. [1(b)], where
the H2slab edge is obtained by shrinking and
shift-ing the air holes at the slab edge of H1, the allowed
surface mode frequency in H2 will shift to be lower
than that in H1, as shown in the band diagram of Fig.
[1(b)]. The mode gap, denoted by a shadow region in Fig. [1(b)], will form owing to the surface mode fre-quency difference between H1 and H2; that is, the surface mode in H1 with frequency inside the mode
gap cannot propagate in H2. Thus, the
hetero-interface H1/H2can serve as a mirror.
By applying double hetero-interfaces mentioned above, we can obtain a PhC HSE microcavity with high quality共Q兲 factor surface mode, as shown by the scanning electron microscope picture in Fig. 2. The surface mode in microcavity region with slab edge H1
will be confined by mode gap effect provided by the gradually varying and outer barriers with slab edges
HGand H2. For gradually varying barrier HG, the ra-dii and positions of air holes at the slab edge are shrunk and shifted gradually and linearly. The air-hole radius共r兲 over lattice constant 共a兲 共r/a兲 ratios of the remaining outer barrier H2 are kept invariant, and the r / a ratio difference between H1and H2is de-noted as ⌬r/a. In 3D finite-difference time-domain (FDTD) simulations, we optimize the Q factor by tun-ing ⌬r/a and the length of HG at fixed . High Q value of 6.6⫻105 is obtained when the gradually
varying barrier length of HG, cavity length with H1, slab thickness,⌬r/a, andare 5a, 10a, 220 nm, 0.04, and 0.25, respectively.
To obtain high Rn value of the confined surface
mode, in simulations, the slab thickness is reduced from 220 nm to be 150 nm, which is thinner than typical half-wavelength design (/2n, ⬃220 nm for =1500 nm and n=3.4). This leads to more extension of mode field outside the cavity and increases the in-teractions between light and environmental index variation. In Table 1, the simulated Rn value
in-creases from 625 to 720 nm/RIU with the slab thick-ness reduced from 220 to 150 nm, where Rn value is
estimated by the resonance wavelength shift under
0.02 index variation in simulations. In addition, the surface mode volume also decreases with the reduced slab thickness. Owing to its small mode volume, as an optical index sensor, the analyte consumption would be about 2 fL. In the following experiments, the slab thickness is chosen as 180 nm according to our currently available epitaxial structure.
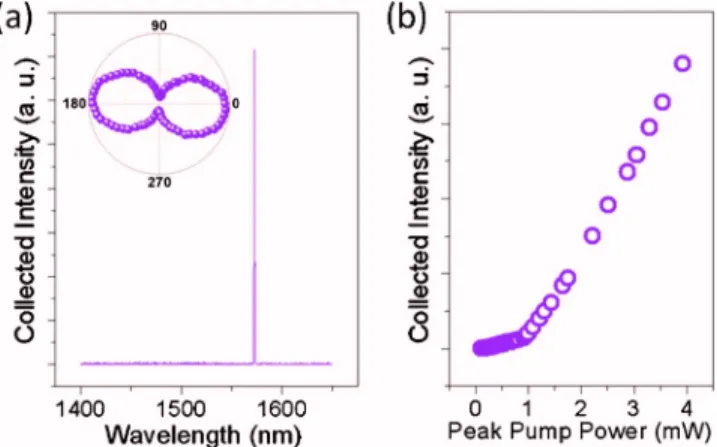
The PhC patterns are defined by electron-beam li-thography and followed by a series of dry- and wet-etching processes based on the epitaxial structure consisting of four compressively strained InGaAsP multi-quantum-wells with total thickness of 180 nm. The fabricated PhC HSE microcavity is optically pumped by a diode laser with pump spot diameter, pulse width, and duty cycle of 3.5m, 40 ns, and 0.2%, respectively, to avoid thermal problems. The measured lasing spectrum, polarization, and the light-in–light-out 共L-L兲 curve of surface mode are shown in Figs.3(a)and3(b). The lasing wavelength, threshold, and polarized degree are estimated as 1572.5 nm, 0.9 mW, and 0.81, respectively.
To demonstrate optical index sensing functionality by a PhC HSE microcavity, we set up a high vacuum chamber with a gas flow controlling gauge and a vacuum pump. The device is mounted on a stage in-side the chamber and can be observed from a quartz optical window by microphotoluminescence system outside. In preparation, the chamber is vacuumed down to the pressure of 10−2Pascal (Pa) and then
filled with CO2 by the gauge. This procedure is re-peated for three times to ensure that the chamber is filled with CO2 only. CO2 is an important analytic
target in chemical analysis, biomedics, environmen-tal monitoring, and so on. Besides, the use of CO2in our experiment provides very fine index variation
Fig. 2. (Color online) Scheme of PhC HSE microcavity with cavity共H1兲, gradually varying barrier 共HG兲, and outer barrier 共H2兲 layers. The r/a ratio distribution and the
formed mode gap in frequency by these three regions are also illustrated. The r / a ratio of H1and a of the fabricated
microcavity are 0.38 and 540 nm, respectively.
Table 1. FDTD Simulated Rn, Mode Volume, and Q Factor of PhC HSE Microcavities with Different
Slab Thicknesses
Slab Thickness Rn Mode Volume Q 220 nm 625 nm/ RIU 2.25共/n兲3 6.6⫻105
180 nm 675 nm/ RIU 2.14共/n兲3 3.2⫻105
150 nm 720 nm/ RIU 2.03共/n兲3 1.1⫻105
Fig. 3. (Color online) Typical (a) single-mode lasing spectrum, polarization, and (b) L-L curve of surface mode measured from PhC HSE microcavity laser.
and lower optical loss to the microcavity than in aqueous or organic solvent.
In the experiment, first, a PhC HSE microcavity is pumped for 30 min to guarantee the stability of the microcavity laser, which can be observed from the in-variant lasing wavelength. The pump power and pump position are strictly fixed during the measure-ments to avoid unwanted wavelength shift contrib-uted by the temperature instability inside the micro-cavity. Then the CO2 gas pressure (for reference,
⬃38.5 Pa in the atmosphere) in chamber is controlled and tuned from 1.00⫻104to 1.15⫻105Pa by the gas
flow gauge and vacuum pump. The measured surface mode wavelength shift is shown in Fig. 4(a), which indicates a linear redshift when the CO2gas pressure
increases, that is, when the environmental index in-creases. This agrees quite well with the FDTD simu-lation prediction also denoted in Fig. 4(a). The sur-face mode spectra under CO2pressures of 1.00⫻104
and 1.15⫻105Pa are shown in Fig. 4(b). The
wave-length shift is 0.3 nm, and the pressure variation leads to the refractive index change of 4.8⫻10−4. Thus, we obtain a high Rnvalue of 625 nm/RIU in
ex-periment, which agrees with the simulation result of 675 nm/RIU quite well. Considering the surface mode line width of 0.24 nm by Lorentzian fitting in Fig. 4(b), the experimental minimum detectable in-dex variation ␦nexp is about 4⫻10−4. This value is
similar to or better than those in [9–13]. Although presently␦nexpis not as small as the theoretical␦n of
7.2⫻10−6 calculated from Table 1 because of the
broadened line width arisen from carrier dynamics in active device, by using laser device as a sensor, we can discard highly efficient light input/output designs needed in most passive devices and obtain the optical signal easily. This simplifies the device design both in laboratory prototype and real applications. On the other hand, we perform thermal conduction analysis using a finite-element method to simulate the tem-perature fluctuation of the microcavity caused by the changed CO2thermal conductivityCO2under differ-ent gas pressures. The CO2 variation is only 1.8 ⫻10−5W / m . K when the gas pressure varies from
1.15⫻105to 1.00⫻104Pa, which corresponds to
0.15 K increase in temperature of the microcavity.
This leads to the wavelength redshift smaller than 0.0075 nm in the InGaAsP-based microcavity [16], which is much smaller than above measured wave-length shift and can be ignored. Thus, we can con-clude this wavelength shift is mainly contributed by the environmental index variation.
In summary, we have introduced and applied a PhC HSE microcavity with a highly index-sensitive surface mode for optical index sensing. To increase the Rnvalue of this microcavity, in 3D FDTD
simula-tions, the slab thickness is reduced from typical half-wavelength design to be 150 nm, which leads to the increased Rn value from 625 to 720 nm/RIU. In
ex-periments, single surface mode lasing action is ob-served from a PhC HSE microcavity with 180 nm slab thickness. Furthermore, we demonstrate the op-tical index sensing functionality by the surface mode wavelength shift under different CO2 gas pressures
in chamber. High experimental Rn value of
625 nm/RIU is achieved, which indicates the poten-tial of the PhC HSE microcavity with the surface mode serving as a highly sensitive optical index sen-sor with a very compact size.
This work was supported by Taiwan’s National Sci-ence Council (NSC) under contract numbers NSC-98-2120-M-009-002 and NSC-98-2221-E-009-015-MY2. The authors acknowledge the help from Center for Nano Science and Technology (CNST) of National Chiao Tung University, Taiwan.
References
1. C. Monat, P. Domachuk, and B. J. Eggleton, Nat. Pho-tonics 1, 106 (2007).
2. X. Fan, I. M. White, S. I. Shopova, H. Zhu, J. D. Suter, and Y. Sun, Anal. Chim. Acta 620, 8 (2008).
3. J. Homola, S. S. Yee, and G. Gauglitz, Sens. Actuators B 54, 3 (1999).
4. L. Rindorf, J. B. Jensen, M. Dufva, L. H. Pedersen, P. E. Høiby, and O. Bang, Opt. Express 14, 8224 (2006). 5. M. Sumetsky, R. S. Windeler, Y. Dulashko, and X. Fan,
Opt. Express 15, 14376 (2007).
6. A. M. Armani, R. P. Kulkarni, S. E. Fraser, R. C. Flagan, and K. J. Vahala, Science 317, 783 (2007). 7. A. M. Armani and K. J. Vahala, Opt. Lett. 31, 1896
(2006).
8. M. R. Lee and P. M. Fauchet, Opt. Express 15, 4530 (2007).
9. S. Kita, K. Nozaki, and T. Baba, Opt. Express 16, 8174 (2008).
10. D. F. Dorfner, T. Hürlimann, T. Zabel, L. H. Frandsen, G. Abstreiter, and J. J. Finley, Appl. Phys. Lett. 93, 181103 (2008).
11. T. Sünner, T. Stichel, S. H. Kwon, T. W. Schlereth, S. Höfling, M. Kamp, and A. Forchel, Appl. Phys. Lett. 92, 261112 (2008).
12. S. H. Kwon, T. Sünner, M. Kamp, and A. Forchel, Opt. Express 16, 11709 (2008).
13. A. Di Falco, L. O’Faolain, and T. F. Krauss, Appl. Phys. Lett. 94, 063503 (2009).
14. T. W. Lu, Y. H. Hsiao, W. D. Ho, and P. T. Lee, Appl. Phys. Lett. 94, 141110 (2009).
15. J. K. Yang, S. H. Kim, G. H. Kim, H. G. Park, Y. H. Lee, and S. B. Kim, Appl. Phys. Lett. 84, 3016 (2004). 16. P. T. Lee, J. R. Cao, S. J. Choi, Z. J. Wei, J. D. O’Brien,
and P. D. Dapkus, Appl. Phys. Lett. 81, 3311 (2002). Fig. 4. (Color online) (a) Measured (open circles) and
simulated (solid line with solid circles) wavelength shifts of surface mode under different CO2 gas pressures and the
corresponding index variations. (b) Surface mode lasing spectra under pressures of 1.00⫻104 and 1.15⫻105Pa.
The pump power is fixed at 1.5 mW.