i
國
國
國
國 立
立
立
立 交
交
交
交 通
通
通
通 大
大
大
大 學
學
學
學
土
土
土
土 木
木
木
木 工
工
工
工 程
程
程
程 學
學
學
學 系
系
系
系
博
博
博
博 士
士
士 論
士
論
論
論 文
文
文
文
以空載光達資料進行台灣地區山崩型態測計之研究
以空載光達資料進行台灣地區山崩型態測計之研究
以空載光達資料進行台灣地區山崩型態測計之研究
以空載光達資料進行台灣地區山崩型態測計之研究
Characterizing Morphologic Features of Taiwan
Characterizing Morphologic Features of Taiwan
Characterizing Morphologic Features of Taiwan
Characterizing Morphologic Features of Taiwan
Landslides with Airborne LiDAR Data
Landslides with Airborne LiDAR Data
Landslides with Airborne LiDAR Data
Landslides with Airborne LiDAR Data
研
研
研
研
究
究
究
究
生
生:
生
生
:
:劉進金
:
劉進金
劉進金
劉進金
指導教授
指導教授
指導教授
指導教授:
:
:史天元
:
史天元
史天元
史天元
中
中
中
中
華
華
華
華
民
民
民
民
國
國
國
國
一
一
一
一
○
○
○
○
二
二
二
二
年
年
年
年
一月
一月
一月
一月
ii
以空載光達資料進行台灣地區山崩型態測計之研究
以空載光達資料進行台灣地區山崩型態測計之研究
以空載光達資料進行台灣地區山崩型態測計之研究
以空載光達資料進行台灣地區山崩型態測計之研究
Characterizing Morphologic Features of
Taiwan Landslides with Airborne LiDAR Data
研
研
研
研 究
究
究
究 生
生
生:
生
:
:劉進金
:
劉進金
劉進金 Student: Jin-King Liu
劉進金
指導教授
指導教授
指導教授
指導教授:
:
:史天元
:
史天元
史天元 博士
史天元
博士
博士
博士 Advisor: Dr. Tian-Yuan Shih
國
國
國
國
立
立
立
立
交
交
交
交
通
通
通
通
大
大
大
大
學
學
學
學
土
土
土
土
木
木
木
木
工
工
工
工
程
程
程
程
學
學
學
學
系
系
系
系
博
博
博
博
士
士
士
士
論
論
論
論
文
文
文
文
A Dissertation
Submitted to Department of Civil Engineering
College of Engineering
National Chiao Tung University
in Partial Fulfillment of the Requirements
for the Degree of
Doctor of Philosophy
in
Civil Engineering
January 2013
Hsinchu, Taiwan, Republic of China
中
中
中
中
華
華
華
華
民
民
民
民
國
國
國
國
一
一
一
一
○
○
○
○
二
二
二
二
年
年
年
年
一月
一月
一月
一月
iii
以空載光達資料進行台灣地區山崩型態測計之研究
以空載光達資料進行台灣地區山崩型態測計之研究
以空載光達資料進行台灣地區山崩型態測計之研究
以空載光達資料進行台灣地區山崩型態測計之研究
學生:劉進金 指導教授:史天元 國立交通大學土木工程學系博士班 摘 要 空載光達資料可用於各種淺層與深層山崩之探討。雖然空載光達資料為山崩 研究開啟嶄新的一頁,但是由於許多新的分析方法有待開發,所以尚未成為普遍 使用的工具。空載光達資料用於山崩研究主要可分為三方面:(1)山崩偵測, 經由光達資料辨認山崩並且清點山崩的分佈特性與幾何特性,並可進而進行山崩 潛感性分析;(2)山崩監測,經由多期光達資料分析山崩的變動或山崩的體積 及其變化;(3)山崩辨認或山崩變動模型建立,經由光達資料產生之山崩型態 測計參數建立預測與評估模式。本研究之目的即針對這三個山崩研究面向分別提 出分析方法,並選擇台灣的案例進行實驗:(1)山崩辨識,以專家法與半自動 法,進行台灣北部與南部之淺層山崩與深層山崩案例之探討;(2)山崩監測, 提出個體山崩體積與全區山崩體積估算法,對高雄市案例進行個體深層山崩與區 域性淺層山崩體積之估算;(3)山崩自動萃取建模,利用光達資料產生之山崩 型態測計參數,以高雄市案例建立預測與評估模式。結果顯示,本研究所提出之 各種光達山崩分析法均有其可行性,空載光達資料確實對於各種淺層與深層山崩 之探討均有其效用。 首先,為了解空載光達技術用於山崩研究之潛力與限制,本論文首先彙整用 於型態測計的重要的山崩分類與幾何特徵,進而對空載光達技術應用於台灣山崩 的經驗予以審視。並分別就空載光達技術在山崩研究應用上的主要有利與不利因 素加以探討。以申論空載光達資料用於山崩研究隱含之基本問題。 在淺層山崩辨識的探討上,本研究提出的方法包括(1)專家法:包括數值 表面模型暈渲法與數值高程模型暈渲法;(2)半自動法:包括點雲密度指標法 與物件導向分析法;與(3)自動法:本研究提出一個混合影像分割與物件導向 法,並以傳統逐像元方式的分類法比較。在深層山崩辨識的探討上,本研究提出 的方法包括(1)專家法;(2)半自動法:影像組織分析與物件導向分析法;(3) 多期光達變動分析法:以三期光達資料檢視深層山崩之活動性。專家法分別以數 值表面模型暈渲圖及數值高程模型暈渲圖作為專家判釋的依據,結果顯示淺層山iv 崩判釋上,數值表面模型暈渲法優於數值高程模型暈渲法;相反地,深層山崩判 釋上,反映林木遮蔽下之微地形的數值高程模型暈渲圖優於數值高程模型暈渲圖。 半自動法先進行光達影像增揚處理 (enhancement),產生之結果再由地質專家進 一步分析判釋。光達點雲密度指標法提出四種光達點雲密度指標及其計算方法, 其處理結果再與正規化數值表面模型暈渲法 (nDSM-shaded relief ) 專家判釋成 果進行比較,結果顯示問題的關鍵在於點雲密度指標之參數的選擇。物件導向分 析法以區域影像分割法 (area-based segmentation) 產生物件再以支持向量機法 (SVM)完成分類,分類結果分別與傳統逐像元分類法 (pixel-based method) 及專家 判釋成果進行比較,結果顯示整體精度達 93.4%,Kappa 係數達 0.817,物件導向 法優於傳統逐像元分類法。至於深層山崩,利用影像組織分析與物件導向分析法 進行之山崩活動性探討,本研究顯示台灣的地質與地形環境的複雜度在這方法仍 有很大探討空間。在多期光達變動分析上,本研究以簡單數值高程模型差異法檢 視三期光達資料,確實可以觀察到深層山崩之活動性。 在山崩體積估計的探討上,本研究提出兩種山崩體積估計方案,全區性山崩 體積評估的方法包括:簡易數值高程模型相減法 (Difference of DEMs,簡稱
Simple DoD Method)與個體山崩體積累計法;個體山崩體積評估的方法包括:山
崩三維斷面法、平均切片法、與網格法等。本研究以小林山崩及高雄市納馬夏區 之一個圖幅進行實例示範。此外,一個山崩圖幅之個別山崩可予以分割,從而產 生每一個山崩的精確體積,因而可以進而探討山崩之面積 A (m2)與體積 V (m3) 的冪次法則關係式,V = kAa。本研究納馬夏案例,獲得 k = 0.099,a = 1.395,相 關係數 R2= 83.7%。此冪次法則可以反映不同地質、土壤、與風化侵蝕的特性。 在山崩自動萃取模式的建立上,本研究利用 2005 年與 2009 年兩期的光達資 料建立一個山崩自動萃取的山崩型態測計模式。首先利用研究區的衛星影像進行 自動山崩分類,其後以專家法,逐一檢視與修正山崩分佈圖。利用山崩分佈圖作 為切割版,萃取發生山崩地區之光達山崩型態測計參數如坡度、地形曲率、物件 高程模式(OHM)、OHM 粗糙度、與地形濕度指數等。再統計產生山崩型態測計 參數之區間值,由而建立一個二元多評準決策模式,此為一線性組合模式,所有 落入山崩型態測計參數之區間值範圍者即為山崩。結果顯示此山崩模式之整體精 度為 64.9%。當進一步考慮將舊山崩區與河岸區納入,精度為 64.4%,並沒有改 善。當排除面積小於 50m2 (即小於 10m x 5m) 之山崩時,2005 年與 2009 年之山 崩預測精度分別成為 76.6% 與 72.5%,有明顯改善。成果顯示此山崩型態測計模 式是有效的,唯型態測計參數的選擇與參數區間值的產生仍值得進一步探討。 總結而言,本研究針對空載光達資料用於山崩研究之三個面向分別提出分析 方法,並選擇案例進行實驗,結果顯示本研究提出之方法可行,空載光達資料確
v 實是山崩研究有用的工具。中央地質調查所在 2009 年莫拉克風災後推動全國光 達測繪計畫,期間從 2010 年至 2015 年,其目的在獲取全區之一公尺解析力之光 達數值表面模型(DSM ) 與數值高程模型 (DEM)、以及 0.5 公尺解析力之正攝影 像。這可提供未來多期體積變化研究的基準,亦可提供本研究後續之應用與探討, 以了解不同地文環境之適用性。此外,因為森林覆蓋下深層山崩不易被察覺,值 得進一步開發半自動化的物建導向分析法予以探討。森林覆蓋區是多期變動監測 之誤差主要來源,光達全光譜分析用於萃取森林底層較微弱的反射訊號,以增加 森林地區數值高程模型的精度,並降低多期變動監測的不確定性,值得進一步探 討。未來也可以考慮加入山崩誘因作為參數,併入本研究提出之山崩模式。 關鍵詞:遙測、自然災害、地形測計、影像增揚、國家空間資訊基礎建設。
vi
Characterizing Morphologic Features of Taiwan Landslides
with Airborne LiDAR Data
Student:Jin-King Liu Advisors:Dr. Tian-Yuan Shih
Department of Civil Engineering National Chiao Tung University
ABSTRACT
Taiwan is located on the active collision zone between the Eurasian plate and the Philippine Sea plate. Mountains have a high relief, and rock formations are highly fractured and fragile. These physiographic settings are unfavorable to landslide susceptibility. LiDAR-derived data can be used to investigate any type of landslides including both shallow and deep-seated ones. Nevertheless, LiDAR data are not yet a common tool for landslides investigations though this technique has opened new domains of applications that still have to be developed. Applications of LiDAR in landslide investigations can be classified as: (1) Detection and characterization of landslides which include the recognition of landslides and their subsequent application in susceptibility analysis; (2) Monitoring of displacement or volume change of landslide bodies; (3) Modeling for the movement of landslides or the automatic extraction of landslides. The purposes of this research are to develop methods for understanding all these 3 aspects: (1) Landslide recognition for both shallow and deep-seated landslides with expert-based and semi-automatic approaches with cases from northern and southern Taiwan; (2) Landslide volume estimation for both shallow and deep-seated landslides with multi-temporal LiDAR data in southern Taiwan; and (3) Modeling landslide extraction with 6 geomorphometric features including slope, curvature, OHM (object height model), OHM roughness, and topographic wetness index which are derived from multi-temporal LiDAR data acquired in 2005 and 2009 in southern Taiwan.
vii
For exploring the prospects and limitations of LiDAR Technology, the significant classification scheme and landslide features are concisely reviewed. Subsequently, both favorable and adverse factors of applying LiDAR data for landslide investigation are discussed on basis of the experiences gained so far in Taiwan. It is concluded that the awareness of the adverse factors is critical in using the LiDAR products for landslide investigations..
In the experiment of landslide detection by indices of LiDAR point-cloud density, classification results from the indices derived from the proposed four kinds of densities are verified by the result obtained by manual interpretation of the derived nDSM images. The datasets for this study are in I-Lan County after Typhoon Kalmaegi on 17 July 2008. The results show that a proper definition of the parameters for the indices is most critical for the detection of shallow landslides. Landslides recognition of the same area was also done by a pixel-based method and an object-oriented method combining area-based segmentation and a Supported Vector Machine (SVM) method. The geomorphometric features applied in the classification include Slope, OHM, and Shaded Relief which are derived from LiDAR data , as well as features of RGB, Greenness, and NDVI which are derived from concurrent images. This case shows the object-oriented SVM method is better than a pixel-based SVM method in classification accuracy and the most important features include slope and OHM. In addition, deep-seated landslide under forest can be detected in this area under expert-based shaded-relief analysis of micro-morphology.
In the experiment of landslide volume change with multi-temporal LiDAR data acquired in 2005 and 2010 in southern Taiwan, both regional approach and approach of individual landslides for volume estimation are raised. For the estimation of regional sedimentation, two methods are proposed: (1) a simple DoD method; (2) Method of Accumulating Individuals. For the estimation of each individual landslide, three methods are proposed: (1) Method of 3D Sections; (2) Method of Average Sections; and (3) Grid Method. These methods are texted with a deep-seated landslide (Hsiaolin Landslide) and with a selected map-sheet area in Namashia District of
viii
Kaohsiong City. Because the area and volume of each individual landslide in an area can be estimated, it is straightforward to model the relation between A (m2) and volume V (m3) of landslides, V = kAa. The result of the Ternbausan-One area shows that k = 0.099, a = 1.395, and R-squared coefficient of determination = 83.7%. The empirical formula reflects different physiographic conditions including geology, soils, climate and denudation processes.
In the experiment of establishing a geomorphological model for extracting landslides using multi-temporal LiDAR data of high accuracy and high resolution. Two sets of LiDAR data were acquired for before and after a heavy rainfall event. The landslides which took place from 2005 to 2009 were classified automatically by satellite images, and subsequently the landslides were interpreted and edited manually. Geomorphometric parameters including slope, curvature, OHM, OHM roughness, and topographic wetness index were then extracted using stencils of landslide polygons overlaid on respective thematic maps derived from LiDAR, DEM and DSM. The ranges of every parameter were derived from the statistics of the landslide area. Some selected non-morphometric parameters were also included in a later stage to account for all possible features of landslides, such as vegetation index and geological strength. The ranges of the parameters of landslides were optimized for the model by the statistics of the landslide area. The overall accuracy predicted by the model was 64.9%. When the buffer zones of old landslides and riverside areas were included, the overall accuracy was 64.4%, showing no improvement. When landslides smaller than 50 m2 were filtered, the overall accuracy reached 76.6% and 72.5% for 2005 and 2009, respectively. The results show that the geomorphological model proposed in this research is effective for landslide extraction.
In conclusion, the methods developed in this research for landslide detection, for multi-temporal volume change analysis, and for establishing a landslide extracting model are proved to be effective for the cases in Taiwan and for the airborne LiDAR data acquired. Generally, LiDAR data can be a good tool for landslides investigations. A national geohazard mapping program employing integrated airborne LiDAR and
ix
digital photography was launched by the Central Geological Survey after Typhoon Morakot hit southern Taiwan in 2009. The national mapping program, spanning 2010 to 2015, was dedicated to capture an entire territory of the country with airborne LiDAR and digital imagery. More datasets of multi-temporal and various physiographical settings are becoming available. Technique of OOA segmentation method for the detection of deep-seated landslides in dense forest should be developed especially for the high relief terrain of Taiwan. Other research topics include uncertainties of LiDAR analysis, the dependence of morphometric parameters on triggering events or geographical locations, and full waveform for detect the subtle reflection from the forest floor, thus to increase ground point densities of densely-vegetated area and to suppress the uncertainties of the DEM in this environment.
Keywords: remote sensing, natural hazards, geomorphometry, image enhancement, NSDI
x
DEDICATION
This dissertation is dedicated to the memory of my beloved father, Liu Ma-Hsiang (1910-1993)
and mother, Liu Jhuang-Hsio (1916-2008)
for their love, humble, and hard-work in raising 7 children: Jin-Tsai Liu, Jin-Shi Liu,
Jin-Cheng Liu, Jin-Shing Liu, Yue-Mei Liu, Me and Chiu-Guei Hsu.
xi
ACKNOWLEDGEMENTS
Many people have contributed to my success in completing this dissertation, especially my family, my advisor Prof. Tian-Yuan Shih, the outstanding committee members for reviewing my dissertation, my colleagues in Industrial Technology Research Institute (ITRI) and in LIDAR Technology Co. Ltd., and peers of professional geo-infomatics worldwide.
I am fortunate to have an outstanding committee for reviewing my dissertation including Prof. Dr. Liang-Chien Chen, Prof. Dr. Chyi-Tyi Lee, Associate Prof. Dr. Yu-Chang Chan, Prof. Dr. Jyh-Jong Liao, Prof. Dr. Cheinway Hwang, Associate Prof. Dr. Tee-Ann Teo, and Prof. Dr. Tian-Yuan Shih.
I have been involved in the profession of remote sensing and photogrammetry since my first job in 1977 when I enrolled to the newly-established remote sensing group in Mining Research and Service Organization of ITRI. I started with aerial photo-interpretation for geological applications. With the advancement of the technology, Prof. Shih cooperated with ITRI introduced airborne LiDAR technology to Taiwan after the major disaster JiJi Earthquake in 1999. Subsequently, with supports by National Chiao Tung University, National Central University, National Taiwan University, and National Cheng Kung University, ITRI started an operational experiment of airborne LiDAR from 2004 to 2006 and introduced this new technology to the industry of Taiwan with sponsorship of the Ministry of the Interior, Republic of China (Taiwan). In 2005, Dr. Yu-Chang Chan of Institute of Earth Sciences, Academia Sinica coordinated with ITRI and Chung-Hsing Survey Company initiated a geological study using airborne LiDAR with sponsorship of Central Geological Survey. The study continued from March 2005 till December 2010. The effectiveness and significance of airborne LiDAR for geological study have been explored and validated by this 7-years 2 phases of study. Thus, after Morakot disaster in 2009, Central Geological Survey launched a national LiDAR mapping program dedicated to the investigation of geological hazards. I gained the knowledge of airborne LiDAR as well as natural hazards from peers of this profession. Especially, I acknowledge all of the
xii
colleagues in ITRI worked with me in this period of time for promoting airborne LiDAR technology including Kuo-Shin Hsiao, Da-ko Chen, Wei-Chen Hsu, Hsin-Yu Hou, Tzu-Yi Liao, Chi-Chung Lau, Miao-Hsiang Peng, and Chieh-Cheng Yen.
I also must acknowledge Dr. Jiann-Yeou Rau for his invaluable discussion when he was a Ph. D student and associate specialist in Center for Space and Remote Sensing Research, National Central University, under the supervision of Prof. Dr. Liang-Chien Chen. From 2004 to 2009, with the cooperation of ITRI, Prof. Dr. Chen was in charge of research and development on building reconstruction from LIDAR Data and Aerial Imagery. The discussion with Dr. Rau includes monitoring scheme of landslides and joint efforts in developing software tools for manual interpretation of shallow landslides in addition to the application of photogrammetric means for automatic detection of landslides.
I am also indebted to Prof. Dr. Chyi-Tyi Lee for his friendship and long support. Since Prof. Lee inaugurated the first Director of Graduate Institute of Applied Geology in 1991, National Central University, I have learnt so much landslide-related knowledge from him because seismic and landslide hazard analyses are his academic interests and I have the privilege to discuss with him and his research students.
Finally, to my family, my wife Linda Feng-Chin Lin, my son Luis Yao Liu, and my daughter Sofia Shao-Wen Liu, thank you for listening and understanding when I responded to your many requests with excuses of professional matters.
xiii TABLE OF CONTENTS 中 中 中 中文摘要文摘要文摘要文摘要 ... iii ABSTRACT ... vi DEDICATION ... x ACKNOWLEDGEMENTS ... xi
LIST OF TABLES ... xvi
LIST OF FIGURES ... xvii
CHAPTER 1 INTRODUCTION ... 1
1.1 Research Background and Motivation ... 1
1.2 Research Purposes ... 6
1.3 Organization of the Dissertation ... 7
CHAPTER 2 GEOMORPHOMETRY OF LANDSLIDES AND AIRBORNE LIDAR TECHNOLOGY ... 9
2.1 Significance of Geomorphometry of Landslides ... 9
2.2 Introduction to Airborne LiDAR Technology ... 13
2.3 Favorable Factors of using LiDAR for Landslide Investigations ... 17
2.4 Adverse Factors of using LiDAR for Landslide Investigations ... 20
CHAPTER 3 LANDSLIDE DETECTION USING AIRBORNE LIDAR DATA . 25 3.1 Detection of Shallow Landslides ... 26
3.1.1 Introduction ... 26
xiv
3.1.3 Method 2: Method with Indices of Point Cloud Density ... 30
3.1.4 Method 3: Method of nDSM Slicing ... 38
3.1.5 Method 4: A Hybrid Object-oriented Method ... 44
3.2 Detection of Deep-seated Landslides ... 52
3.2.1 Introduction ... 52
3.2.2 Method 1: Expert-based Methods ... 54
3.2.3 Method 2: Texture or OOA Methods... 57
3.2.4 Method 3: Multi-temporal Analysis ... 62
CHAPTER 4 LANDSLIDE MONITORING AND VOLUME CHANGE ANALYSIS OF LANDSLIDES ... 72
4.1 Introduction ... 72
4.2 Methods of Landslide Volume Analysis ... 73
4.3 Study Area and Materials ... 81
4.4 Results and Discussion ... 83
CHAPTER 5 LANDSLIDE EXTRACTION WITH A GEOMORPHOLOGICAL MODEL ... 89
5.1 Introduction ... 89
5.2 Study Area and Materials ... 90 5.3 The Geomorphological Model for Landslide Extraction ... 96
5.4 Results and Discussion ... 103
xv
CHAPTER 6 CONCLUSIONS AND FUTURE WORKS ... 114
6.1 Conclusions and contributions ... 114
6.2 Recommendation for future study ... 114
REFERENCES... 116
xvi
LIST OF TABLES
Table 2.1 Table 2.1 Types of landslides (Varnes, 1978) ... 10
Table 2.2 Simplified classification landslide scheme applied to Taiwan ... 12
Table 3.1 The criteria for the recognition of rainfall-induced landslides ... 28
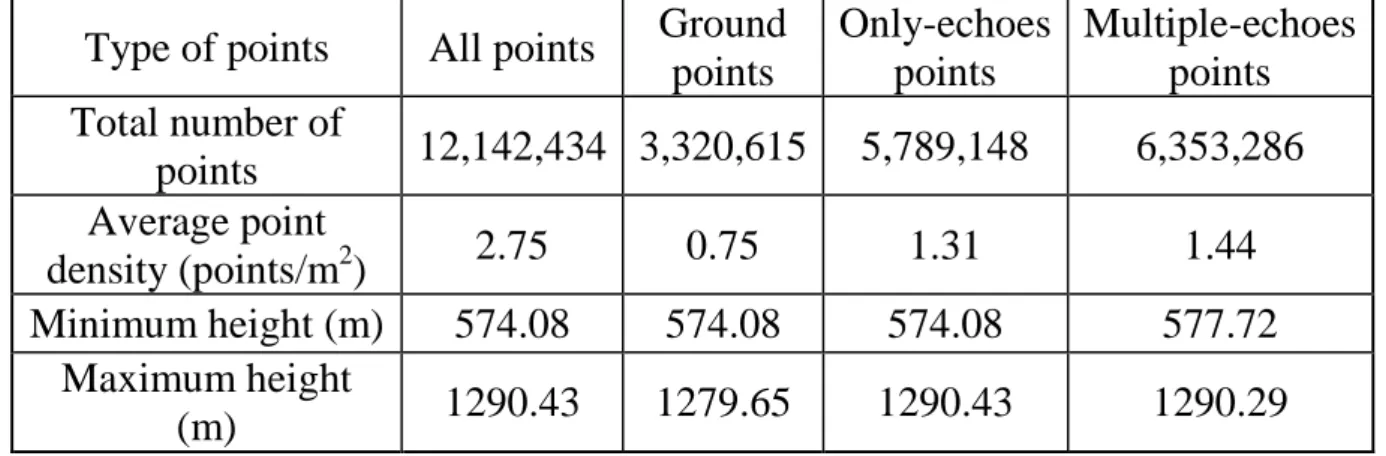
Table 3.2 Attributes of the LiDAR data used in point density study ... 35
Table 3.3 Confusion table of OOA classification and pixel-based classification ... 52
Table 5.1 Tries of different combinations of thresholds for model parameters ... 110
Table 5.2 Model accuracy for 2008 training samples in polygons ... 110
xvii
LIST OF FIGURES
Figure 2.1 An idealized rotational slide showing commonly used nomenclature for
labeling the parts of a landslide (Cruden and Varnes, 1996). ... 10
Figure 2.2 Suggested nomenclature for landslides by IAEG Commission on Landslides (1990). ... 11
Figure 2.3 Flowchart of Airborne LiDAR Survey and Applications.. ... 15
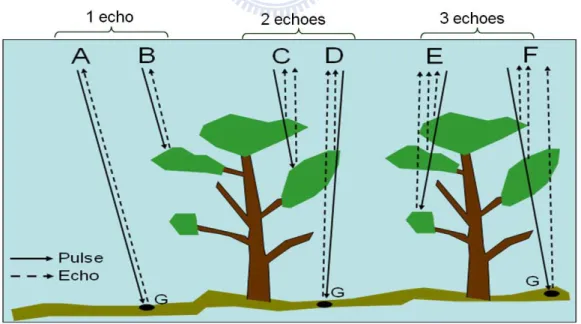
Figure 2.4 Multiple echoes (returns) of LiDAR pulses. G denotes a point on the bare ground.. ... 19
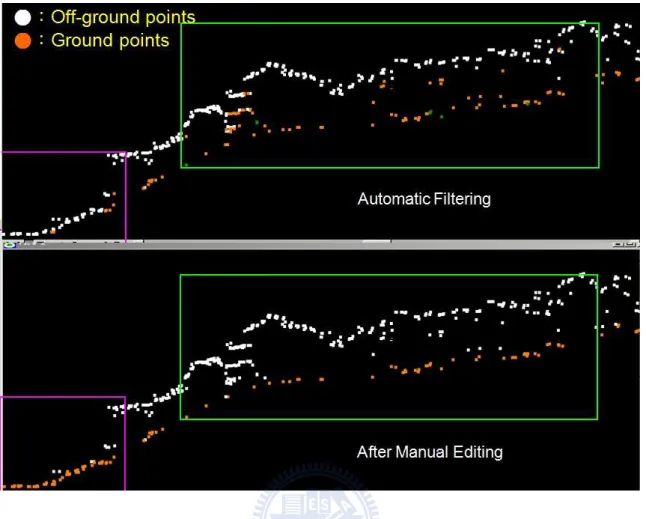
Figure 2.5 Manual editing of point clouds is a must, especially for vegetated and complex terrain. ... 24
Figure 2.6 Example of the resultant DEMs due to data voids and artifacts. ... 24
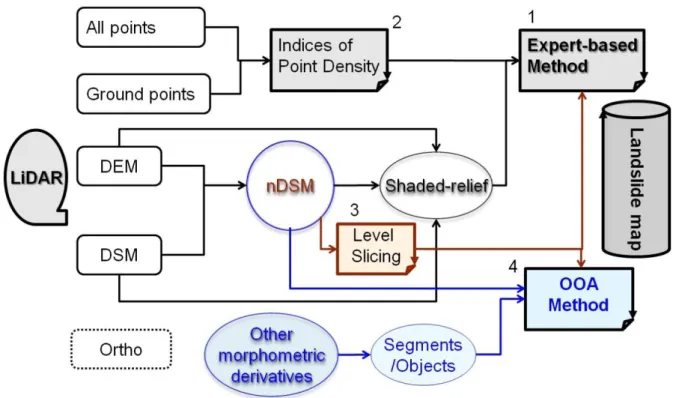
Figure 3.1 A scheme showing the methods proposed in this study for landslide detection using LiDAR standard products. ... 26
Figure 3.2 Shaded-relief image of LiDAR DSM (Left) and DEM (Right) at the southern bank of Shimen Reservoir, North Taiwan.. ... 30
Figure 3.3 Orthographic aerial photograph (Left) and DSM-shaded relief (Right) at Alishan of central Taiwan. ... 30
Figure 3.4 Schematic diagram showing the geometry of airborne LiDAR scanning. .. 32
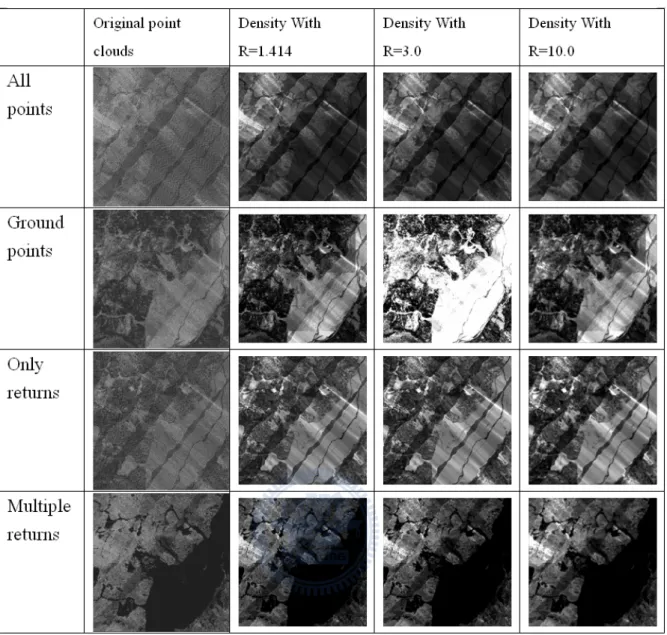
Figure 3.5 Selected results of four types of point density and their distribution under various searching radii with 1m grid.. ... 37
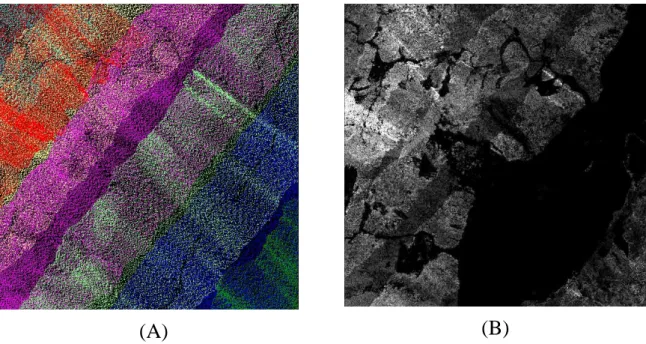
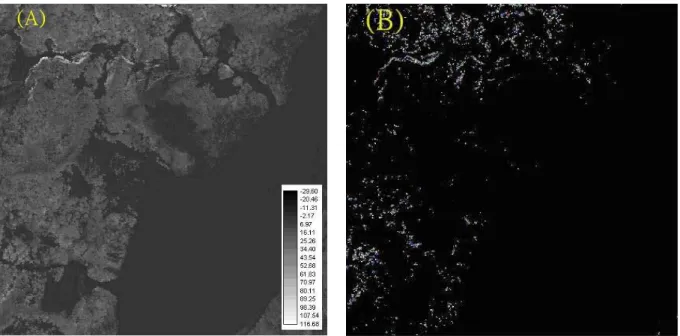
Figure 3.6 (A) Point cloud distribution with attribute of flight strip source ID. (B) Density map of multiple-return echoes with r=1.414m and grid spacing = 1m.. ... 38
Figure 3.7 (A) Gray map of nDSM of the study area. (B) Distribution of the locations of points with extra-ordinary values. ... 42
Figure 3.8 Gray maps of nDSM(A), DSM(B) and DEM(C). ... 43
Figure 3.9 Gray-level slicing of various nDSM ranges.. ... 44
Figure 3.10 Flowchart of OOA data processing. ... 49
xviii
Figure 3.12 Study Area and Ground Truth for OOA Test. ... 50
Figure 3.13 Results of the hybrid OOA method. ... 51
Figure 3.14 The results generated by pixel-based SVM classification. ... 52
Figure 3.15 A comparison of two images: color aerial photograph (left) and shaded-relief image of airborne LiDAR DEM (right) (Lewis, 2006). ... 56
Figure 3.16 Deep-seated landslides revealed in LiDAR-derived image at I-Lan.. ... 57
Figure 3.17 Shaded relief image of the Coringa Landslide and immediate surroundings. The primary kinematic units within the slide are earthflows E1 and E2, the area of compression U1 and the Blocky area with incorporated limestone blocks (McKean and Roering, 2004).. ... 59
Figure 3.18 Shaded relief image of the Salmon Falls landslides for semivariogram and fractal analyses. UB=Upper block, B=Body, T=Toe. (Glenn et al., 2006).60 Figure 3.19 LiDAR-derivatives of Li-Shan landslide complex, central Taiwan. ... 61
Figure 3.20 The location of Hsiaolin Slide and the vicinity. The landslide boundary is draped on the 3D perspective view of aerial photograph taken after the event.. ... 65
Figure 3.21 Three DSMs and DEMs of Hsiaolin Slide. ... 66
Figure 3.22 Topographic Features of Hsiaolin Slide and its Subdivisions. ... 68
Figure 3.23 (A) color coded image of V32; (B) hsaded relief image of V32.. ... 69
Figure 3.24 Cross section of Hsiaolin Slide along A-B-B' shown in top diagram of Fig. 3。α=31.7°,β=22.3°,γ=8.6°... 70
Figure 3.25 A close-up of the depletion area of Hsiaolin Slide. Remnants of unconsolidated materials still exited on the bare surface. The dash-line is the isoplethic line with -20 m. The area covers 48.68 hectares.. ... 70
Figure 4.1 A simple difference of 2010 DEM and 2005 DEM and the DoD result where the legend shows the value of the difference in meters.. ... 75
Figure 4.2 Different thresholds applied to the DoD results: (A) not applied; (B) a threshold of -3 m.. ... 76 Figure 4.3 Each individual landslide (B) can be extracted from the overall landslide
xix
map (A) generated by DoD method. ... 77
Figure 4.4 Landslide volume estimation using three landslide dimensions. ... 78
Figure 4.5 Landslide volume estimation using areas of cross sections of fixed-interval. ... 80
Figure 4.6 Landslide volume estimation using a grid of landslide depths. ... 80
Figure 4.7 The study area of Namashia District of Kaohsiong City. ... 82
Figure 4.8 LiDAR Data used in Namashia study area. ... 83
Figure 4.9 Hsiaolin Slide and its 7 subdivisions. The landslide is represented by an ellipse for the dimensions of width and length. Black lines are isopleths of -5 m and red lines are isopleths of +4m. Subdivision A is the major landslide body. ... 84
Figure 4.10 Interpretation of a 2D landslide map on basis of orthophoto and DoD-shaded images... 87
Figure 4.11 extraction of individual landslides are made one by one from the whole landslide map. ... 88
Figure 4.12 Empirical formula of landslide area A (m2) and volume V (m3) of the data points of landslides in the study area, V=kAa.. ... 88
Figure 5.1 SPOT image taken on 2009/08/24 after Typhoon Morakot. The 8-digit numbers are the map numbers of national 1/5000 map series. ... 91
Figure 5.2 A regional geological map near the Hsiaolin village (Song et al., 2000).. .. 92
Figure 5.3 Satellite images of the study area from 2005 to 2009. Bright grey features on the images are mostly landslide scars. Landslide occurrence increasingly increases in this period of time, as shown in Figure 5.8. ... 93
Figure 5.4 DEM and DSM images before Typhoon Morakot. ... 95
Figure 5.5 3D perspective views of Hsiaolin Village before and after Typhoon Morakot. Hsiaolin Landslide has a volume of ~25 million cubic meters with a maximum depth of 85 m on top area and a maximum length of 3396 m from top to the other side of Chisan River. The landslide completely destroyed the village.. ... 95
xx
Figure 5.6 DEM and DSM obtained after Typhoon Morakot. As compared to those of Fig. 4, dramatic landform change can be found in river valley as well as
mountain slopes, especially the example of Hsiaolin Landslide. ... 96 Figure 5.7 Flowchart of the geomorphometric model. ... 98 Figure 5.8 Landslide distribution between 2005 and 2009. Landslides on images are
high-lighted with yellow polylines. New landslides are in red polylines when comparing images taken in 2005 and 2008 (E) and those in 2008 and 2009, respectively.. ... 105 Figure 5.9 The distributions of major LiDAR-derived geomorphometric parameters
selected for landslide recognition in this study. The coordinates of the maps are (209810,2566339) and (217609,2557916) for the lower right and upper left, respectively. ... 106 Figure 5.10 Frequency distribution of geomorphologic parameters of landslides in
2005. ... 108 Figure 5.11 Frequency distribution of geomorphologic parameters of landslides in
2009.. ... 108 Figure 5.12 Landslide prediction with geomorphometric model: (A) Prediction of
2008 landslide susceptibility based on 2005 landslides in vector segments. (B) Prediction of 2009 landslide susceptibility based on 2005 landslides in vector segments. ... 112
1
Chapter 1
Introduction
1.1 Research background and motivation
Motivated by the tremendous loss and damages of Taiwan due to natural disasters caused by the vulnerable physiographic environment (NFA, 2012) and the newly availability of airborne LiDAR technology due to the launch of a national airborne LiDAR mapping program (Liu and Fei, 2011) and advances in the researches on the use of LiDAR in landslide investigations (Jaboyedoff et al., 2010&2012), this study is devoted to explore the applicability of airborne LiDAR data for investigation of landslides in Taiwan.
Nearly three-quarters of the territory of Taiwan, and 95% of its population, are exposed to frequent natural hazards (Dilley et al., 2005). In the aftermath of Typhoon Morakot, which dramatically affected southern Taiwan on August 8, 2009, and August 9, 2009, and caused the worst flooding in a century, authorities realized that the country is lacking detailed, accurate, and current elevation data and aerial imagery covering the entire territory of 36 000 km2. To address this problem, a national mapping program, spanning 2010 to 2015, was launched to capture an entire territory of the country with airborne LiDAR (Light Detecting And Ranging) and digital imagery (Liu and Fei 2011). A LiDAR DEM (Digital Elevation Model) and DSM (Digital Surface Model) and color orthophotos represent a core part of this national spatial data infrastructure.
2
Taiwan is located on the active collision zone between the Eurasian plate and the Philippine Sea plate. Mountains have a high slope and high relief, and rock formations are highly fractured and fragile. These physiographic settings are unfavorable to slope stabilities. Taiwan is also located on the path of typhoons in northwest Pacific area. Torrential rainfall during the typhoon season often triggers geological hazards. Landslides are one of the most important primary disasters.
In Taiwan, a typhoon can trigger hundreds, even thousands, of shallow landslides in mountainous areas (Lin and Jeng, 2000; Cheng et al., 2005; Lin et al., 2006). These landslides can deliver large amounts of sediment into local reservoirs, reducing their water storage capacity (Dadson et al., 2004; Mikos et al., 2006). In addition, the turbidity of the water in the reservoirs has a negative effect on the sustainable operation of water supply reservoirs. The assessment and inventory of landslides is essential for effective watershed management and sustainable development. However, because of the steep terrain in Taiwan’s mountainous watersheds, most landslides are unreachable. The detailed topographic mapping required for emergency mitigation measures cannot be completed within a short period using conventional on-site surveying. Therefore, improving the efficiency and accuracy of landslide monitoring and mapping using remote sensing techniques has become an important research issue (Liu, 1987; Raju and Saibaba, 1999; Rau et al., 2007; Borghuis et al., 2007; Herva et al., 2003).
3
In planning optimal measures of disaster mitigation, researchers often use remote sensing images and digital elevation models to map disaster features and to predict disaster susceptibility. During or immediately after a disaster event, ground survey or photogrammetry, in addition to remote sensing images, can be used to obtain detailed topography data of the subjected area. Because of its ability to obtain high-density point clouds and direct geo-referencing, LiDAR can be used to obtain a more accurate and detailed topographic survey. LiDAR generates accurate 3D coordinates of discrete measurements. Subsequently, DEM and DSM can be produced with high efficiency. In tropical and sub-tropical zones of Taiwan, most of the terrains are covered by dense forestry. Ground surface would be normally predicted by the surface of canopy in photogrammetry if the ground points cannot be seen from two different perspectives of a stereo-pair. One of the most important advantages of airborne LiDAR compared with conventional photogrammetry is that photogrammetry requires two different lines of sight to both see the same points on the ground from two different perspectives, but LiDAR only needs a single laser pulse to penetrate through the trees to measure the ground beneath. This means that LiDAR will have far fewer areas where the terrain is obscured by trees that block the lines of sight. The images of bare ground before and after the event are thus derived from LiDAR surveys to understand changes in the landscape and their possible consequences. The geomorphometric features become good tools for landslide detection, and are adopted in this study.
4
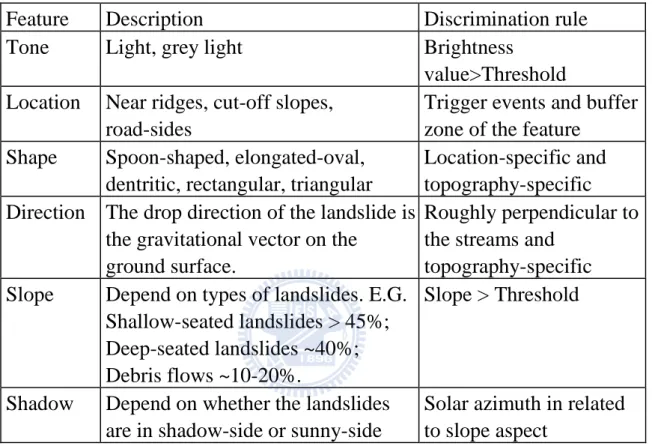
The general feature of a rainfall-induced landslide on aerial photograph is a fresh landslide scar with an elongated shape located on a relatively steep slope. Landslides can occur in any kind of geology, as there are some weathered overburdens on steep slopes. In aerial photographs, landslide features include a bright tone, bare surface, and the other features shown in Table 1. Manual interpretation uses both 2D and 3D features of the landslides for recognition: 2D features include tone, location, and shape, and 3D features include location, direction, slope, and shadow effects. A sound consideration of the automation of landslide recognition should consider all these aspects.
Geomorphometry is a major concern in manual interpretation. Geomorphometry, also known as geomorphological analysis, terrain morphometry, terrain analysis, and land surface analysis (Hengl and Reuter, 2009), is the science of quantitative land surface analysis. The purpose of geomorphometry is to extract surface parameters and objects using input from digital terrain models. Pike (1988) used a dozen groups of parameters as terrain descriptors by manually digitized digital terrain models. Pike used the resulting "geometric signature or topographic signature" to categorize terrain characteristics, and suggested the degree of landslide danger. Topographic signature of life and their processes are deemed to be strongly influenced by biota (Dietrich and Perron, 2006). Guth (2001&2003) used terrain fabric as measures of a point property of the digital terrain models and the underlying topographic surface. This technique is also called topographic fingerprinting
5
(Densmore and Hovius, 2000), and determines the location of a landslide on the slope. State-of-the-art technology such as high resolution satellite images, digital aerial photography, and airborne LiDAR has opened a new era in the automation of landslide recognition, especially the possibility of applying geomorphometrics. The extraction of land surface parameters is becoming increasingly attractive for both stochastic and process-based modeling, as it makes use of all the levels of detailed digital terrain models. Topographic-based analyses can be used to objectively delineate landslide features, generate mechanical inferences about landslide behavior, and evaluate recent landslide activity (Glenn et al., 2006; Mckean and Roering, 2004). Surface roughness derived from LiDAR DTM allows the objective measurement of landslide topography. Eigenvalues of surface normals are an effective parameter for differentiating shallow landslides and debris flows (Woodcock, 1977). Expert knowledge of the geomorphometric properties of landslides may be required to establish an automatic interpretation method. High resolution and high accuracy LiDAR DEM and DSM and orthophotos are now basic constituents of NSDI in Taiwan (Liu and Fei, 2011). Therefore, it is high time to further apply geomorphometry in active landslide study (Liu et al., 2009).
Airborne LiDAR make it possible to map and evaluate landslides in a survey type of regional level (typically at scales ranging from 1:10,000 down to 1:4,000,000 or even smaller), whereas the accuracy can be as good as or community level or site-specific level (typically vary from 1:1,000 to 1:10,000).
6
1.2 Research purposes
The major future challenges in landslide investigations as reviewed by van Westen et al. (2005) includes: (1) the use of very detailed topographic data; (2) the generation of event-based landslide inventory maps; (3) the use of event-based maps in spatial-temporal probabilistic modeling; and (4) the use of land use and climatic change scenarios in deterministic modeling. This viewpoint was also supported by a recent review by Jaboyedoff et al. (2010&2012) on the use of LiDAR in landslide investigations. The later stressed on airborne LiDAR for imaging relief by high-resolution digital elevation models or 3D models and gave a general review of different applications of LiDAR for landslide, rockfall and debris-flow. This review shows that LiDAR-derived data can be used to investigate any type of landslides including both shallow and deep-seated ones. Nevertheless, LiDAR data are not yet a common tool for landslides investigations though this technique has opened new domains of applications that still have to be developed.
Applications of LiDAR in landslide investigations can be classified as: (1) Detection and characterization of landslides which include the recognition of landslides and their subsequent application in susceptibility analysis; (2) Monitoring of displacement or volume change of landslide bodies; (3) Modeling for prediction of landslides. Therefore, the purposes of this research are to develop methods for understanding all these 3 aspects: (1) Landslide
7
recognition for both shallow and deep-seated landslides with expert-based and semi-automatic approaches with cases from northern and southern Taiwan; (2) Landslide volume change with multi-temporal LiDAR data in southern Taiwan; and (3) geomorphommetric modeling for the automatic extraction of shallow landslides with selected geomorphometric features such as including slope, curvature, OHM (object height model), OHM roughness, and topographic wetness index which are derived from multi-temporal LiDAR data acquired in 2005 and 2009 in southern Taiwan.
1.3 Organization of the dissertation
The remainder of this dissertation is organized as follows. In Chapter 2, summaries of classification schemes of landslides and morphologic features of landslides are introduced with subsequent review of favorable and adverse factors of applying LiDAR data for landslide investigation, thus to perceive the prospects and limitations of the new technology. In Chapter 3, methods and experiments for landslide detection for both shallow and deep-seated landslides are presented including expert-based interpretation and semi-automated methods. In Chapter 4, methods and experiments for the volume estimation of regional sedimentation and individual landslides with multi-temporal LiDAR data are presented and an empirical power law is derived to model the relation between A (m2) and volume V (m3) of landslides. In Chapter 5, methods and experiments for establishing a geomorphological model for extracting landslides using
8
multi-temporal LiDAR data are presented. Final concluding remarks and suggestions for future researches are presented in Chapter 6. Appendix 1 gives a list of acronym for the abbreviations used in this dissertation.
9
Chapter 2
Geomorphometry of Landslides and Airborne
LiDAR Technology
This chapter is served as basics to the applications of airborne LiDAR data for landslide investigations. At first, summaries of classification schemes of landslides and standard morphologic features of landslides are introduced. Secondly, a review of favorable and adverse factors of applying LiDAR data for landslide investigation is made, thus to perceive the prospects and limitations of the new technology.
2.1 Significance of Geomorphometry of Landslides
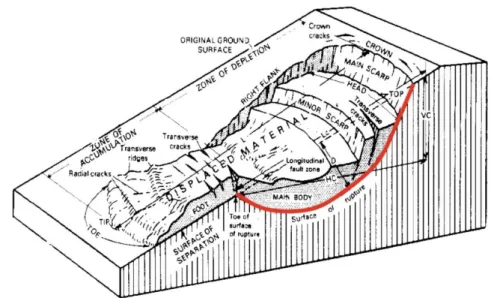
Landslide refers to any mass of earth material displaced by gravity. The various types of landslides can be differentiated by the kinds of material involved and the mode of movement. The most popular classification system based on these parameters is shown in Table 2.1 (Varnes, 1978). Geomorphometry is measurement of forms (size and shape) of geological phenomena or features. Morphological features of landslides are properties related to the external structure of landslides. Airborne LiDAR survey acquires digital elevation models in a resolution as high as one meter which may reveal detailed landslide features. The dimensions and geometry of a landslide have been described by Varnes (1978) and subsequently modified by Cruden and Varnes (1996) using the cutaway drawing in Figure 2.1. Subsequently, the International Association
10
of Engineering Geologists (IAEG) created a Commission on Landslides that has produced the section and definitions of a landslides for landslide features and dimensions (Figure 2.2) (IAEG Commission on Landslide, 1990). The feature of different parts of a landslide may thus be recognized from airborne LiDAR data.
Table 2.1 Types of landslides (Varnes, 1978).
Figure 2.1 An idealized rotational slide showing commonly used nomenclature for labeling the parts of a landslide (Cruden and Varnes, 1996)
No. Name of Landslide features 1 Crown 2 Main scarp 3 Top 4 Head 5 Minor scarp 6 Main body 7 Foot 8 Tip 9 Toe 10 Surface of rupture
11 Toe of surface of rupture 12 Surface of separation 13 Displaced material 14 Zone of depletion 15 Zone of accumulation 16 Depletion 17 Depleted mass 18 Accumulation 19 Flank
20 Original ground surface
Figure 2.2 Suggested nomenclature for landslides
For practical applications in the physiographic environments of Taiwan, the classification scheme of landslides developed by Varnes (1978) is simplified
11
of Landslide features
Surface of rupture
Toe of surface of rupture Surface of separation Displaced material Zone of depletion Zone of accumulation
Original ground surface
Designations of Landslide dimensions 1. Wd -- Width of displaced mass 2. Wr -- Width of surface rupture 3. Ld -- Length of displaced mass 4. Lr -- Length of surface rupture 5. Dd -- Depth of displaced mass 6. Dr -- Depth of surface rupture 7. L -- Total length
8. Lcl -- Length of center line
Suggested nomenclature for landslides by IAEG Landslides (1990)
For practical applications in the physiographic environments of Taiwan, the classification scheme of landslides developed by Varnes (1978) is simplified Landslide dimensions idth of displaced mass Width of surface rupture Length of displaced mass Length of surface rupture
Depth of displaced mass Depth of surface rupture Total length
Length of center line
by IAEG Commission on
For practical applications in the physiographic environments of Taiwan, the classification scheme of landslides developed by Varnes (1978) is simplified
12
into five major categories, namely, rock falls, shallow-seated landslides, deep-seated landslides, dip-slope and wedge slides, and debris flows, as shown in Table 2.2. Thus, types of landslides can be differentiated by their physical appearance, which is especially useful for practical applications with remotely sensed images.
Table 2.2 Simplified classification landslide scheme applied to Taiwan
Type of Movements
Type of Materials
Bed rock Engineering Soils
Debris Soils Falls Rock falls Shallow-seated slide Topples Slide Translational
Dip-slope and wedge slide
Rotational Deep-seated slide
Flows (not applicable) Debris flow (not applicable)
In this dissertation, for the detection of landslide features only shallow and deep-seated landslides are differentiated. Shallow landslide refers to the landslide in which the sliding surface is located within the soil mantle or weathered bedrock (typically to a depth from few decimeters to some meters). Shallow landslides usually include debris slides, debris flow, and failures of road cut-slopes. Deep-seated landslide refers to the landslide in which the sliding surface is mostly deeply located below the maximum rooting depth of trees (typically to depths greater than ten meters). Deep-seated landslides
13
usually involve deep regolith, weathered rock, and/or bedrock and include large slope failure associated with translational, rotational, or complex movement. These typically move slowly, only several meters per year, but occasionally move faster. They tend to be larger than shallow landslides and form along a plane of weakness such as a fault or bedding plane.
As pointed out by Pike (1988&2000), geological phenomena such as landslides may be characterized by sets of diagnostic measurements of geo-features which is known as geometric signature. Therefore, morphological features of landslides of the properties related to the external structure of landslides can be used for landslide detection, for multi-temporal change analysis, and landslide modeling. Spatial measures of landslide include both 2D planimetric attributes (X, Y) and 3D continuous elevation or relief attributes (X, Y, Z). Obviously, airborne LiDAR survey with standard products of point clouds and grids of digital elevation models and digital surface models should have high potentials for obtaining the spatial measures of landslides.
2.2 Introduction to Airborne LiDAR Technology - standard products
Airborne LiDAR is mainly used for landslide investigation to create accurate and precise high resolution digital elevation models (DEM) and digital surface models (DSM) in raster grids. Basic products of airborne LiDAR usually include all points, ground points, DEM, and DSM (MOI, 2006). The former two are vectors of discrete points and the later two are interpolated raster grids of the
14
discrete points of the former two. Nevertheless, new specifications and recommendations may requires products such as simultaneous digital aerial photographs, full waveforms, and so on (Heidemann, 2012).
Figure 2.3 is a flowchart showing the general process of an airborne LiDAR survey and applications. Generally, five phases of tasks are implemented for an airborne LiDAR survey, including: (1) The planning step; (2) Flights and pre-processing – obtaining point clouds in local projected coordinate system, such as Taiwan Geodetic Datum 1997 (TWD97), Taiwan Vertical Datum 2001 (TWVD 2001); (3) Classification step – The extraction of points hitting the bare earth from all point clouds for the production of LiDAR DEM; (4) Quality validation step - for assuring the conformance of quality and quantity requirements of the results to the selected guidelines or specifications, such as MOI (2006) or USGS Lidar base specification (Heidemann, 2012); and (5) The output step – Interpolation of discrete points is made to obtain grids of specified resolution and specified map-sheet extent, such as 1 m grid of national 5k map-sheets in Taiwan. Thus, DEMs and DSMs with ellipsoid height are created by interpolation of the discrete ground points. In Taiwan, DEMs and DSMs with orthometric heights are then prepared by applying a reduction of geoid undulation model published by the Ministry of The Interior, namely Taiwan Vertical Datum 2001 (TWVD2001). Subsequently, applications can be made with or without former or ancillary data. And, most importantly domain knowledge of the applications are critical and required.
15 IMU Rover GPS Boresight Data POS Base GPS DGPS Laser scanning Raw points Editing
All and ground points
Ground check
Quality Check
DEM and DSM
Former LiDAR or other ancillary data Applications
Integration
ok
Figure 2.3 Flowchart of Airborne LiDAR Survey and Applications
A common practice of using rectangular grid for interpolation from vector format of discrete points to rater format is due to its ease of use and availability of interpolation tools. TIN (Triangulated Irregular Network) or other raster format can also be applied for geological applications when point clouds are available.
Usually, vertical accuracy will be specified in the LiDAR survey. The vertical accuracy of DEM is evaluated by a direct comparison of LiDAR DEM and ground durvey for the analyzed study areas. According to the accuracy
16
specification of LiDAR DTM by the Ministry of the Interior, Taiwan (MOI, 2006), the accuracy of elevation should satisfy the following formula based on some environment conditions and the production of DEM:
= + + (2.1)
where σ is the tolerable error, a is fundamental accuracy based on the product level of DEM, b is the topography-adjustment factor, c is the vegetation-adjustment factor, and t is the mean height of trees. The DEM used in this study is derived from point cloud data with manual editing and strip adjustment so the fundamental accuracy a is equal to 0.3 m and the topography-adjustment factor b is 0 in an area with a slope smaller than 5°, 0.2 m in an area with a slope 5°-15°, 0.5 m in an area with a slope 15°-30°, and 1.0 m in an area with a slope greater than 30°. The vegetation-adjustment factor c is 0 for bare land, 0.2 for grass land, 0.3 for forest, and 0.5 for dense forest. According to the accuracy specification, the maximum tolerable error of DEM in the dense forest area will be 8.3 m with a slope greater than 30° if the mean height of trees is 14 m. In geological applications, most of the time expert interventions are required for interpretation. Therefore, such a stunning tolerance of absolute accuracy would usually not cause problems in applications though cares and awareness always have to be taken.
The relative error is also evaluated with overlap data and absolute error is evaluated by a comparison with ground control points. According to the LiDAR
17
guide (MOI, 2006), the residuals between strips in this study are smaller than 10 cm. A cross flight is designed in every 30 km perpendicular to major flight lines for checking discrepancies between flight strips. Five land-types and transactions for ground survey are also selected for validating the accuracy achieved in this phase. Ground data are collected by GPS and Total Stations. The 5 designated land-cover types include (1) bare land, (2) low vegetation, (3) sparsely-vegetated forest, (4) dense forest, and (5) building-up area. At least 30 measurements are collected for each of the cover types. In addition, 50 check points are collected along a profile of 20 km in length crossing the flight strips. As an example, the RMSE (root mean square error) accuracies on cover types of bare land, low vegetation, spare forest and building-up areas are better than 0.16m for the datasets used in this study for Namashia case (see paragraph 4.3 in Chapter 4). The average error for transactions in the study area is 0.131 m. And, the RMSE is around 0.25 m for dense forest. These standardized procedures assure the requirements of geodetic and vertical survey datum, as well as the quality of the datasets.
2.3 Favorable Factors of using LiDAR for Landslide Investigations
The favorable factors or unique features that make airborne LiDAR data so useful for landslide investigations are summarized in this paragraph. These unique features include (1) multiple echoes and/or full waveform; (2) high density and high resolution; (3) high accuracy, in terms of large area survey; (4)
18
direct geo-referencing.
The capability of multiple echoes for one laser pulse make it possible to "see through" the forest. As shown in Fig.2.4, when a pulse is traveling down it might hit an object before reaches the ground, and thus, an echo or return can be expected from the point where the beam hit the object. The beam will travel further downward and may hit another objects except completely blocked by an object or the ground. Currently, LiDAR sensors are able to record up to 7 echoes per pulse and every echo can give a coordinate of the interaction location. Whereas, 4 echoes are recorded for most of LiDAR sensors, such as the prevailing sensor producers Leica and Optech. Points for both of types A and B are created by single echo, also known as only echo. For type A, the points hit the bare ground. For type B, the points hit on object above the ground. Points of type C~F are created by multiple echoes and the points may hit several objects before reach the bare ground. Types C and D include two echoes, namely first echo and last echo. Types E and F include three echoes, namely first echo, intermediate echo and last echo. This feature of multiple echoes is used in assisting automatic and manual editing of ground points.
The state-of-the-art pulse rate of airborne LiDAR can be as high as 500 KHz (Roth and Thompson, 2008; Roth, 2010 & 2011). Average point density of airborne LiDAR survey can be as high as 20 points per square meter. The most common specification is with an average point density of 1 or 2 points per square meter, which has been practiced in Taiwan. Therefore, DEM/DSM grid is
19
usually with 1 m or 2m. Because of the nature of airborne survey with a nominal flight speed of circa 100 knots, efficiency of large area survey with high resolution and high accuracy can be achieved. In addition, the technology of direct geo-referencing of airborne LiDAR makes it possible to have accurate coordinates of each individual points as well as the derived grid. As compared to the traditional stereoscopic study of aerial photo-interpretation, the direct geo-referencing is an important favorable factor. Thus, it is possible to obtain results of interpreted landslides with high position accuracy.
All these unique features of airborne LiDAR make it possible (1) to observe 3D features of landslides; (2) to observe landslides under forest cover; (3) to detect micro-morphological features of deep-seated landslides; and (4) to observe minor offset of lineaments of geological structure.
Figure 2.4 Multiple echoes (returns) of LiDAR pulses. G denotes a point on the bare ground.
20
2.4 Adverse Factors of using LiDAR for Landslide Investigations
This paragraph is to discuss some pitfalls which may mislead the applications of airborne LiDAR data for landslide investigations. Cares and awareness have to be taken for these pitfalls though researches can also be conducted to find out methods for suppressing the uncertainties caused by these pitfalls. Trade-offs of resource allocations for the compensation between ideal products and de facto products can be perceived in this discussion (Liu et al., 2010).
These adverse factors are inherent in every stage of LiDAR data production: (1) In general handling of data, there are problems of edge-matching between map-sheets and interpolation methods; (2) In project preparation and acquisition stage, there are problems of setting up a common datum for all surveys, and acquisition with an optimal point density for all points and ground points; (3) In acquisition and editing stage, the problem of artifacts (commission error) and voids (omission error) (Liu et al., 2010; Hopkinson, 2006).
Due to the large volume of LiDAR point clouds, interpolation for DEM/DSM grids is usually carried out on basis of map-sheets which may extend only around 2.5 km by 2.5 km as the instance of 1/5000 Taiwan National Map-sheet Series. For a large study area which is composed of multiple map-sheets, discontinuities will exist between map-sheets. Measures are required to handle this problem though it is not specified in LiDAR guidelines (MOI, 2006). In addition, different interpolation algorithm may generate
21
different results of DEM/DSM form identical discrete point cloud. Uses must aware of this problem when using DEM/DSM datasets, especially when comparing two different datasets.
A national common datum is required to keep all spatial data under the same frame for analysis and comparison. Nevertheless, in practice, this may not be the case. Some dedicated LiDAR survey may apply their own datum for some reasons. As an example, the datum adopted by Taiwan LiDAR Survey project is TWD97_CGS and the ground control points of this datum are with different coordinates in 2009 and 2011. Other source of datum problem may be due to that the DEM/DSM datasets are generated by different sensors or by different sensors such as InSAR or photogrammetry.
Density of ground points is an important index of DEM quality. However, high density of ground points may not be easily achieved for areas of high relief or dense forest (Hsu et al., 2012; Liu and Fei, 2011). In general, low penetration rate (i.e. the ratio between number of ground points and that of all points) may be due to factors such as (a) nature of vegetation cover; (2) complexity of topography; (3) ground surface conditions such as wetness, grass, or bushes; (4) flight parameters which may be limited by constraints of schedule and budgets; and others. Lack of ground points in certain areas will cause data voids, and thus cause problems or misunderstanding in applications. In addition, high overall point density may produce high density of ground points, whereas it cannot be assured due to the un-controllable factors aforementioned.
22
Figure 2.5 is an example of point cloud editing for filtering non-ground points and retaining ground points. Manual editing of point clouds is a must, especially for vegetated and complex terrain. Even though after manual editing, the resultant DEM is still prone to errors in the viewpoints of users in geology. Why? Usually, there are around 4 millions of ground points in a map-sheet of 2.5 km by 2.5 km. If the acceptability criterion is set to 1 percent for either commission error and omission error, the total erroneous points will be as many as 80,000 points in one map-sheets. Points of commission error result in artifacts in LiDAR image where the height of trees are used in the interpolation of DEM. Points of omission error take place very often in dense forest area and thus result in flat mountain tops and rough terrains in sloping area. Figure 2.6 shows examples of voids (A) due to lacking ground points on top of mountains and artifacts (B) due to imperfect filtering of trees on sloping areas. Figure 2.6(C) shows that it is possible to improve this type of flaws by good practice of manual editing.
Data voids mostly are resulted from gaps of flight coverage and occlusion by topography, clouds, and trees. in the experience of Taiwan National LiDAR Mapping, Hsu et al. (2012) indicated that there are 8 types of gaps, namely (a) water bodies; (b) cloud covers; (c) steep slopes; (d) volley bottoms; (e) mountain ridges and tops; (f) lateral winds on high mountain tops; (g) sudden change of topography at the ends of a flight-line; and (h) possible mirror reflection or absorption of laser energy on certain high mountain slopes. For the area covered
23
by water bodies, there are no echoes due to water absorption of LiDAR IR wavelength in 1064 nm. Cloud covers are the most serious problem in the high mountains. Steep slopes in this area are almost as high as 90 degrees. Volley bottoms and mountain ridges or tops are out of range of the setting pulse rates and thus caused no returns of signals recorded. The lateral winds on high mountain tops causes the plane drifts, deviate from the scheduled flight path, and thus cause gaps of point clouds. Sudden change of topography at the ends of a flight-line due to safety reasons and thus causes the width of flight-strip becomes smaller on ridges. An unusual phenomena with no LiDAR echoes is the possible mirror reflection or moisture absorption on certain high mountain slopes where in reality are landslide terrains with medium slopes.
Due to the unique features of airborne LiDAR data, the number of publications discussing the use of LIDAR in landslide studies has grown considerably during the last decade (Derron and Jaboyedoff, 2010). Nevertheless, some of the adverse factors discussed above are inherent to the datasets. Awareness and cares have to be taken into consideration in the applications. Some of the adverse factors that concerning with the settings of flight parameters might be amended with strict specifications, and thus requiring more cost in data acquisition. A trade-off between quality and cost is obvious in this case.
24
Figure 2.5 Manual editing of point clouds is a must, especially for vegetated and complex terrain.
25
Chapter 3 Landslide Detection Using Airborne LiDAR Data
In this chapter, methods and experiments for landslide detection for both shallow and deep-seated landslides are presented including expert-based interpretation and automated methods.
In the experiment of shallow landslide detection (Figure 3.1), four methods are proposed and tested in this research, namely (1) Expert-based Method - a test of conventional approach of manual photo-interpretation; (2) Method of Indices of Point Density - using LiDAR point clouds; (3) Method of nDSM Slicing - using DSM and DEM; and (4) A hybrid OOA Method - using all standard products of LiDAR survey in an object-oriented classifier.
In the experiment of deep-seated landslide detection, three methods are raised and two of them are tested in this research, namely (1) Expert-based method - a test of conventional approach of manual photo-interpretation with the new possibility of micro-morphology analysis using LiDAR-derived shaded-relief images. This is the main application of LiDAR data for the study of deep-seated landslides; (2) Method of Texture-related or OOA Method - though this is not tested in this study whereas a brief review is made for demonstrating the significance; (3) Method of Multi-temporal Analysis - the major extension of expert-method using multiple times of LiDAR data for
26
perceiving the activeness of deep-seated landslides.
Figure 3.1 A scheme showing the methods proposed in this study for landslide detection using LiDAR standard products
3.1 Detection of Shallow Landslides 3.1.1 Introduction
An effective method for landslide detection has to be able to give a correct recognition of landslide body and to give an accurate delineation of landslide. In other words, area size and spatial distribution of landslides should be correctly enumerated. In this research, four methods are proposed, tested, and discussed. Only samples are demonstrated for expert-based method. Each of the other three methods uses the same datasets and discussed with four parts including introduction of the method, methodology, materials, and results and discussion.