國
立
交
通
大
學
多媒體工程研究所
碩
碩
碩
碩
士
士
士
士
論
論
論
論
文
文
文
文
U M L
線 上 手 寫 辨 識 系 統
An Online Handwritten Recognition System of UML
Diagrams
研 究 生:王偉全
指導教授:陳玲慧 教授
中
中
中
中 華
華
華
華 民
民
民
民 國
國
國
國 九
九
九 十
九
十 七
十
十
七
七
七 年
年
年 六
年
六
六 月
六
月
月
月
U M L 線 上 手 寫 辨 識 系 統
An Online Handwritten Recognition System of UML Diagrams
研 究 生:王偉全 Student:Wei-Chuang Wang
指導教授:陳玲慧 Advisor:Ling-Hwei Chen
國 立 交 通 大 學
多 媒 體 工 程 研 究 所
碩 士 論 文
A ThesisSubmitted to Institute of MultimediaEngineering College of Computer Science
National Chiao Tung University in partial Fulfillment of the Requirements
for the Degree of Master
in
Computer Science June 2008
Hsinchu, Taiwan, Republic of China
UML 線上手寫辨識系統
研究生:王偉全
指導教授:陳玲慧 博士
國立交通大學多媒體工程研究所
摘要
在本論文中,我們建構了一個 UML 線上手寫辨識系統。
根據我們的觀察,UML 的圖形多半為類似方形或是菱形的圖
形,因此在本系統中利用決策樹的方式,來達到辨識的效
果。首先我們擷取使用者輸入圖形的幾何特徵,來進行第一
階段的分類。接著從輸入圖形擷取我們需要的特徵,和其所
屬分類中各個圖形的特徵向量進行比對,即可得到最後的辨
識結果。本系統之優點在於可以接受使用者任意筆順的輸
入,並且辨識的方法較之前更為簡單有效,正確結果出現在
前三名的辨識率為 91.24%。
An Online Handwritten Recognition System of
UML Diagrams
Student: Wei-Chuang Wang
Advisor: Dr. Ling-Hwei Chen
Institute of Multimedia and Engineering
National Chiao Tung University
ABSTRACT
In this thesis, we construct an online handwritten recognition system of UML diagrams. We use a decision tree to do recognition. According to our observation, the shapes of the notations of UML diagrams almost look like rectangles or diamonds. Based on this characteristic, an input notation is first classified to the correct category. Then some notation features are extracted from the input notation and used to do final recognition. The advantages of our system are that we can accept free style input and our method is simpler and more efficient than previous methods. The recognition rate of the top three choices is 91.24%.
誌謝
誌謝
誌謝
誌謝
能夠完成這篇論文,首先要感謝我的指導教授 陳玲慧教授,在他細心、耐心 的指導下,使我於兩年的碩士生涯中,學習到了學術研究的精神以及方法。此外, 老師也在生活上給予我們鼓勵以及幫助,對於日後的處事有莫大的幫助,必會將 老師的教誨銘記於心。另外,也要感謝口試委員鍾國亮教授、蔡月霞教授、以及 李坤龍處長於口試中給予的指導與建議。 兩年的碩士生涯,多虧了實驗室的夥伴陪伴,不但在課業上互相扶持,更讓 兩年的生活中充滿了歡笑與美好的回憶。在此要感謝實驗室的大家:民全、萓聖、 文超、惠龍、俊旻以及占和等博士班的學長,維中、立人、芳如以及佩瑩等大我 們一屆的學長姐,子翔、信嘉、薰瑩等同屆的同學,最後當然少不了益成、明旭、 志鴻、志達這些活潑的學弟們,因為有你們,讓這個實驗室無時無刻充滿朝氣, 也豐富了我這兩年的碩士生涯。 最後,最重要的是要感謝我的家人:爸爸、媽媽以及弟弟,總是在最需要的時 候給我鼓勵與支持,雖然與家人相處的機會較少了,但是家人一句簡單的問候與 關心,就是我努力下去的最大動力,謝謝你們一直那麼支持我。謹以此篇論文獻 給所有關心我以及鼓勵我的人。
TABLE OF CONTENTS
摘要
摘要
摘要
摘要...i
ABSTRACT ...ii
TABLE OF CONTENTS ...iv
LIST OF FIGURES ...vi
LIST OF TABLES...vii
CHAPTER 1 INTRODUCTION ...1
1.1 Motivation ... 1
1.2 UML Diagrams ... 2
1.3 Previous Works ... 4
1.4 Organization of the Thesis ... 6
CHAPTER 2 UML NOTATION DATABASE...8
CHAPTER 3 PROPOSED METHOD...9
3.1 Input ... 9
3.2 Geometric Feature Extraction...11
3.2.1 Convex Hull...11 3.2.2 Bounding Rectangle ... 12 3.2.3 PA Ratio... 13 3.2.4 Area Ratio ... 13 3.3 Category Classifier ... 13 3.3.1 Circle Filter... 15 3.3.2 Line Filter ... 16 3.3.3 Rectangle Filter... 17 3.3.4 Diamond Filter... 17 3.3.5 Other Notations... 18
3.4 Notation Feature Extraction ... 18
3.4.1 Primitive ... 19
3.4.3 Length Feature ... 22
3.4.4 Hollowness ... 23
3.5 Final Classifier... 24
3.6 MBSAS Algorithm for Database Creation... 24
3.7 Post Processing ... 25
CHAPTER 4 EXPERIMENTAL RESULTS ...27
CHAPTER 5 CONCLUSION AND FUTURE WORK ...30
LIST OF FIGURES
Figure 1.1 An example of Use Case diagram ..………....…....3
Figure 1.2 An example of Class diagram ……….………..….4
Figure 2.1 Supported notation of the system ……….……….………….8
Figure 3.1 The proposed method ...……….………...10
Figure 3.2 (a) A convex hull of a set of points …...……….………..………12
Figure 3.2 (b) The convex hull of an input notation “Actor”…...………..…12
Figure 3.3 An example of bounding rectangle of an input notation “Actor” ....…12
Figure 3.4 The classification of each notation ………..14
Figure 3.5 The flowchart of the category classifier………...…….15
Figure 3.6 Two examples to show the PA ratios of lines……….….….…16
Figure 3.7 Two examples to show the Area ratio of rectangles……..…………...17
Figure 3.8 Two examples to show the Area ratios of diamonds………....18
Figure 3.9 4-way chain codes………..………...20
Figure 3.10 An example of the relative location………....22
Figure 3.11 (a) A hollow shape………...……….…..……23
Figure 3.11 (b) A solid shape……….23
LIST OF TABLES
Table 1 The recognition rate of top 1 choice and top 3 choice………...…...28 Table 2 Comparison with SkGs method ...……….………..……….29
CHAPTER 1
INTRODUCTION
1.1 Motivation
In recent years, the development of the handheld devices and pen-based computing hardware, such as PDAs, electronic whiteboards and tablet computers, is grown rapidly, and the handwritten systems which can work in the freehand drawing environment are short of demand. There exists some handwritten recognition systems in some different applications, including math formula [1], engineering drawings [2], table detection [3] and geometric shapes [4-5]. However, the Unified Modeling Language (UML) are widely used in many different domains but there is no handwritten recognition system supporting them.
UML diagrams are widely used in the field of software engineering. Early in the software design cycle, software engineers need to sketch UML diagrams to represent the whole structure of the system. Engineers may draw these diagrams on paper, whiteboard or computer. There are many Computer Assisted Software Engineering (CASE) tools like Rational Rose or Visio to sketch UML diagrams on computer. The functionality of these CASE tools is robust but they have some drawbacks. The most serious drawback of CASE tools is that their design concepts are technique oriented. Technique oriented design provides strong capability but it is not convenient to use.
For example, the input manner of CASE tools is not intuitional. CASE tools usually provide a way called “point and click” to sketch UML diagrams. “Point and click” means that user needs to start with pointing the icon which represents the desired input notation and then to click the position that the notation wants to be placed. Using this way to draw notations is simple but not intuitional. Sketching notations using pen or mouse is the most intuitional way for people, because people are used to draw diagrams on paper by hand. Due to these reasons, we want to build a handwritten recognition system which can allow people enjoying the freedom of drawing UML diagrams by hand.
1.2 UML Diagrams
UML is a general-purpose modeling language that includes a graphical notation used to create an abstract model of a system [6]. UML was designed to specify, visualize, construct and document software-intensive systems. UML is not only restricted to modeling software but also used for business process modeling, systems engineering modeling and representing organizational structures. UML consists of thirteen different diagram types : Activity, Class, Component, Composite, Communication, Deployment, Interaction, Object, Package, Sequence, State, UML Timing and Use Case diagrams [7]. Although there are thirteen different types, UML
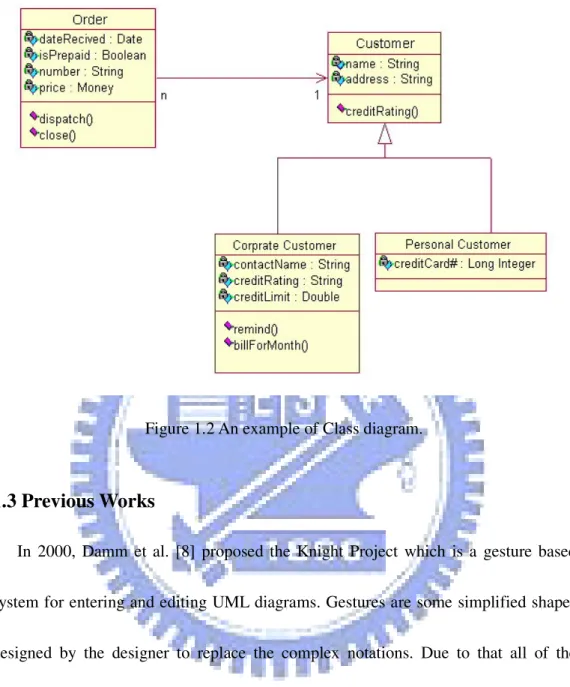
diagrams only have some main concepts [6], such as structure, behavior, and relationship. The structure concept is the main components of a diagram and includes actor, class, component…etc. The behavior concept is the actions or the functions of a diagram. The behavior concepts include activity, state, use case…etc. The relationship concept indicates the relationship between the structure and the behavior and includes aggregation, association, dependency…etc. We can construct any UML diagram based on these concepts. Figures 1.1 and 1.2 show the examples of Use Case diagram and Class diagram.
Figure 1.2 An example of Class diagram.
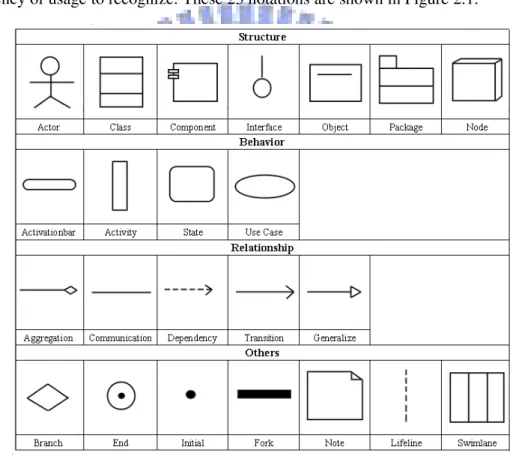
1.3 Previous Works
In 2000, Damm et al. [8] proposed the Knight Project which is a gesture based system for entering and editing UML diagrams. Gestures are some simplified shapes designed by the designer to replace the complex notations. Due to that all of the shapes are simplified, the advantage of gesture based systems is easy to recognize the input notations. However, the user needs to learn what the gestures stand for because they are designed by the designer. In Knight Project, the gestures are separated into two classes, compound gestures and eager gestures, and they use Rubine’s algorithm [9] to recognize their gestures. The drawbacks of the Knight Project are that the
gesture based system is not intuitional enough. Besides, they do not illustrate the notations supported by their system and there is no experimental result to show their recognition rate.
In 2001, Lank et al. [10] proposed an online recognition algorithm for UML diagrams. The algorithm is composed of the domain dependent kernel and the domain independent kernel. The domain independent kernel deals with the preprocessing steps, including capturing the input strokes, stroke grouping and so on, and the domain dependent kernel is the part of recognition. In the recognition algorithm, they use size, number of strokes, the input order of strokes and the stroke’s bounding box size to recognize the input notations. Their algorithm does not allow user drawing the notations in various order because they use the input order as a feature. Besides, there is no experimental result to show their recognition rate.
In 2003, Chen et al. [11] proposed another gesture based recognition system for UML diagrams called SUMLOW. The recognition kernel of SUMLOW combines several multi-stroke shape recognition algorithms to recognize their gestures. The characteristic of SUMLOW is that they allow user modifying, copying, replacing, and deleting input notations via pen-based input technique. Their system has high recognition rate, but there are only six experienced UML designers to participate in their experiment. Thus the recognition rate is not objective.
In 2006, Costagiola et al. [12] proposed an online recognition method for hand-drawn diagrams based on grammar formalism, namely Sketch Grammars. The method uses a parse tree and the Sketch Grammar to recognize input notations. To enhance the recognition rate, the authors propose a language recognizer which can help the original recognizer to select the best interpretation. This method can be adapted to any notation besides UML diagrams and has high recognition rate. However, a troublesome problem for this method is how the grammars train for new notations.
In this thesis, we propose a new online recognition system for UML diagrams based on decision tree. The system supports all the UML notations which are used frequently and allows user inputting the notations in any kind of order. Our user interface is designed based on the user oriented concepts. In the system, we provide the redrawn technique to help users draw in the location they desired. We also provide the function of user self-definition letting users define the gestures themselves.
1.4 Organization of the Thesis
This thesis is composed of four chapters. In Chapter 1, the motivation and previous works are introduced. The UML notation database is described in Chapter 2. Our proposed system will be presented in Chapter 3. Experimental results and
comparisons to other systems are presented in Chapter 4. The conclusions and future works are summarized in Chapter 5.
CHAPTER 2
UML NOTATION DATABASE
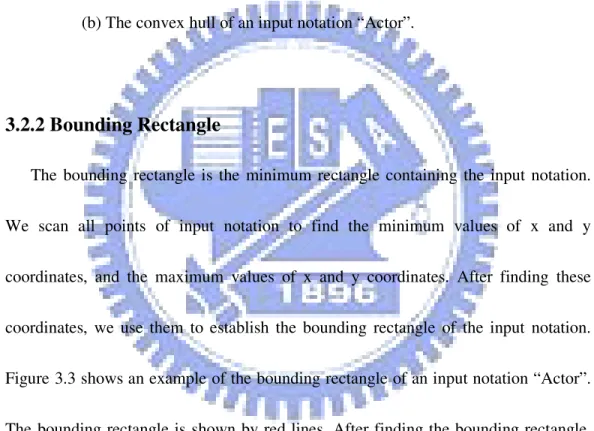
UML diagrams have thirteen different types and more than forty different notations. However, some of these notations are used rarely and their shapes are more complex. In the thesis, we choose 23 notations based on UML concepts and the frequency of usage to recognize. These 23 notations are shown in Figure 2.1.
Figure 2.1 Supported notations of the system.
In the thesis, we invite 20 persons to draw the 23 notations ten times for each and collect the ink data they draw. We randomly choose half of the ink data for training, and the rest for testing. The training procedure is implemented by the MBSAS algorithm [13] which will be elaborated in the next chapter.
CHAPTER 3
PROPOSED METHOD
The proposed method is based on a decision tree and shown in Figure 3.1. The whole process consists of four major phases: geometric feature extraction, category classifier, notation feature extraction (NFE), and final classifier. In the geometric feature extraction phase, some geometric features, such as convex hull, bounding rectangle, PA ratio and Area ratio, are extracted from the input notation. In the category classifier phase, the features extracted in the previous phase are used to classify the input notation to the belonging category. In the notation feature extraction phase, the input notation is divided into primitives and then we extract features like direction, location and distance from these primitives. In the final classifier phase, based on the extracted features, a similarity measure is provided. Based on the similarity measure, the result notation that is most similar to the input notation is determined.
3.1 Input
Before discussing the proposed method, we need to describe how we get input and define some expressions which are used frequently in the thesis. The system can get input from tablet computer, tablet digitizer and mouse, and convert the input to a point
sequence. The recognition procedure of the system is started when users draw a
Figure 3.1 The proposed method.
complete notation, not a stroke. A stroke is the locus of the pen tip from its pen down to the next pen up position. A notation is composed of one or more strokes and represents a UML symbol. For getting the complete input, the time-out technique which is proposed by Kimura [6] is used. The system processes pen input when the time-out value is decreased to zero. The time-out value is started to decrease when the pen up action occurs. It is stopped and reset when the pen down action occurs before the value is decreased to zero. The system sets 2 seconds to the time-out value initially. Based on the technique, the system can get integrated input and start the
Geometric Feature Extraction
Category Classifier
NFE NFE NFE NFE NFE
Final Classifier Final Classifier Final Classifier Final Classifier Final Classifier
Result Result Result Result Result
Line Circle Rectangle Diamond Others Pen Input
recognition procedure.
3.2 Geometric Feature Extraction
The first phase of the recognition procedure is geometric feature extraction. According to our observation, the notations supported in the system can be divided into five categories, i.e. circle, line, rectangle, diamond, and others, based on their geometric properties. This phase extracts geometric features from input notation to classify it to the correct category. The geometric features we used include convex hull, bounding rectangle, PA ratio and Area ratio. Each of these features is described below.
3.2.1 Convex Hull
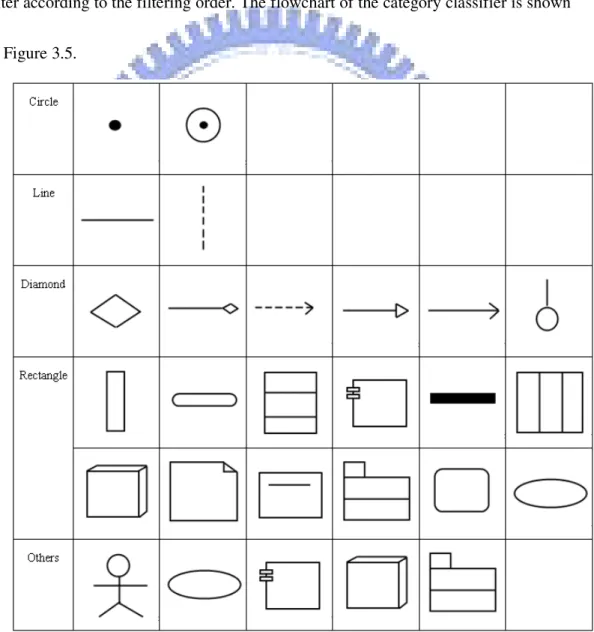
The first feature we need is the convex hull of the input notation. The convex hull for a set of points X is the minimal convex set containing X. Figure 3 gives two examples to illustrate convex hull. We use the Graham scan algorithm [14] to find the convex hull of the input notation. Figure 3.2 (b) shows the convex hull of an input notation “Actor”. The blue line denotes the convex hull. After finding the convex hull, we compute its perimeter and the area. These values will be used in the following section.
Figure 3.2 Two examples to illustrate convex hull (a) A convex hull of a set of points. (b) The convex hull of an input notation “Actor”.
3.2.2 Bounding Rectangle
The bounding rectangle is the minimum rectangle containing the input notation. We scan all points of input notation to find the minimum values of x and y coordinates, and the maximum values of x and y coordinates. After finding these coordinates, we use them to establish the bounding rectangle of the input notation. Figure 3.3 shows an example of the bounding rectangle of an input notation “Actor”. The bounding rectangle is shown by red lines. After finding the bounding rectangle, we compute its perimeter and area. These values will be used in the following section.
Figure 3.3 An example of the bounding rectangle of an input notation “Actor”.
3.2.3 PA Ratio
PA ratio proposed by Kimura [6] is defined as:
CH 2 CH
/Area
Perimeter
ratio
=
PA
, (1)where PerimeterCH denotes the perimeter of the convex hull of the input notation, and AreaCH denotes the area of the convex hull of the input notation. Note that the perimeter and area partly define the shape of an object.
This ratio will be a constant for some kinds of shape. For instance, PA ratio = 16 for any square rectangle and PA ratio = 4π for any circle. Size independent is the main advantage of PA ratio. In the thesis, PA ratio is used to classify circle and line.
3.2.4 Area Ratio
Area ratio is also proposed by Kimura [6]. The ratio is defined as:
BR CH
/Area
Area
ratio
=
Area
, (2)where AreaBR is the area of the bounding rectangle of an input notation.
Area ratio also has the property of size independent. In the thesis, we use this ratio to distinguish the rectangle and the diamond shape.
3.3 Category Classifier
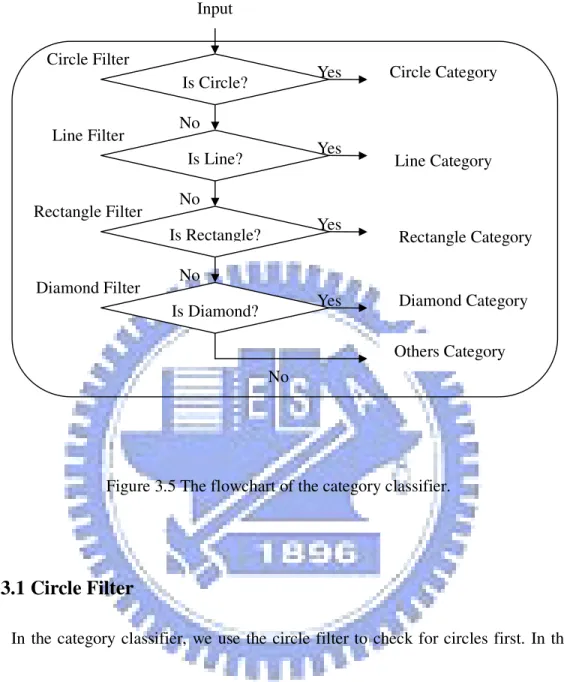
notation to the correct category. The 23 supported notations are separated to five categories including circle, line, rectangle, diamond, and others. The classification of each notation is shown in Figure 3.4. Four different filters, namely circle filter, line filter, rectangle filter and diamond filter, are provided to distinguish the five categories in the category classifier. In the following sections, we will introduce each filter according to the filtering order. The flowchart of the category classifier is shown in Figure 3.5.
Figure 3.5 The flowchart of the category classifier.
3.3.1 Circle Filter
In the category classifier, we use the circle filter to check for circles first. In the thesis, we use PA ratio for circle filter. PA ratio of a perfect circle of any size is a scalar 4π. Due to that the input may not be a perfect circle, we need to train a threshold range around 4π to classify the input notation. To train the threshold, we
compute the PA ratio of the notations belonging to the circle category in the training database first. Then we find a maximum and a minimum as the upper bound and the lower bound of threshold range.
Is Circle? Input Is Line? Is Rectangle? Is Diamond? Circle Filter Line Filter Rectangle Filter Diamond Filter Others Category Rectangle Category Line Category Circle Category Yes Yes Yes Diamond Category Yes No No No No
3.3.2 Line Filter
If the input notation does not belong to the circle category, it will be checked by the line filter. Here, we use PA ratio for line filter. Due to the PerimeterCH of a line is close to twice of the length of input notation andthe AreaCH of a line is closed to the product of the length of input notation and ∆h which is the maximum distance between input stroke and its convex hull, the PA ratio of a line can be approximated by h l h l l ratio PA ∆ = ∆ × ≈ (2 ) 4 2
. Since ∆ << l the PA ratio should be large. Here, we h take 120 as a threshold value obtained by training. Figure 3.6 shows two examples to explain why the PA ratio is greater than a threshold. In Figure 3.6, the black line is user’s input and the red line is the convex hull. To avoid the error of dividing zero, we set the PA ratio equal to 200 when the area of the convex hull of a line is equal to zero.
3.3.3 Rectangle Filter
Rectangle filter will be used when the notation does not belong to the circle or line category. In the thesis, we use Area ratio for rectangle filter. According to the fact that the AreaCH of a rectangle is almost equal to the AreaBR of the rectangle, the Area ratio of a rectangle is close to 1. Figure 3.7 shows two examples to explain the fact mentioned above. In Figure 3.7, the black line is user’s input, the red line is the convex hull and the green line is the bounding rectangle. To get a threshold range, we also train the rectangle notations in the training database.
Figure 3.7 Two examples to show the Area ratios of rectangles.
3.3.4 Diamond Filter
If input notation is not considered as a circle, a line or a rectangle, it will be checked by the diamond filter. In the thesis, we use Area ratio for diamond filter. We assume that the notations belonging to the diamond category are all upright patterns. The Area of a diamond is nearly two times of the Area of a diamond based on our
assumption. In other words, the Area ratio of a diamond is nearly 0.5. Figure 3.8 shows two examples to explain why the Area ratio of a diamond is nearly 0.5. In Figure 3.8, the black line is user’s input, the blue line is the convex hull and the red line is the bounding rectangle. We use a threshold range which is trained using the diamond notations in the training database to check whether the input notation belongs to the diamond category or not.
Figure 3.8 Two examples to show the Area ratios of diamonds.
3.3.5 Other Notations
If the input notation does not belong to any category mentioned above, it will be classified to the others category. In our experiments, after category classification the others category contains Actor and several rectangle notations which are ill-written.
3.4 Notation Feature Extraction
extracted for the final classification. Before extracting notation features, we will first segment the notation into several primitives, which will be described in the following subsection. The notation features extracted include the number of primitives, the direction of each primitive, the location of each primitive, the length of each primitive, and the hollowness of the notation. In the following subsections, we will describe how to extract features.
3.4.1 Primitive
A primitive is defined to be the minimum unit of a notation, which may be a line or an arc. The advantage of segmenting a notation to primitives is that it is much easier for the shape matching procedure to find the matching notation. All the notation features are extracted in primitive level except hollowness.
To divide a notation to many primitives, we use 4-way chain code and the curvature of each point. The 4-way chain code is shown in Figure 3.9. First we compute the chain code for each point. Then we compute the curvature of each point by ) )) 1 ( ) 1 ( ( )) 1 ( ) 1 ( ( ) 1 ( ) 1 ( ( cos r 2 2 1 -pi + − − + + − − + − − = i y i y i x i x i x i x C , (4)
where x(i), y(i) denotes the x, y coordinates of point pi and Crpi is the curvature of point p. After computing the curvature, we evaluate the curvature difference between
two neighboring points to find the dominate points, which have curvature difference greater than a threshold. Finally, the notation is divided into several segments using the dominate points as cut points, each segment is considered as a primitive of the notation. When the notation is segmented to many primitives, we take the number of primitives, N, as the first feature. Note that we have two kinds of primitives: line and curve, which are decided by the sequence of chain codes of the primitive. To decide what kind of a primitive is, we evaluate the chain code difference between each two neighboring points in the chain code sequence and sum all of them. If the summation is larger than a threshold, we will decide that it is a curve; otherwise, it is a line.
Figure 3.9 4-way chain codes
3.4.2 Direction and Location Feature
The direction of a line primitive is defined as the chain code which appears most frequently in the primitive. If the primitive is an arc or a curve, we set 5 to be its
1 2 3
direction. In order to record the directions of the extracted primitives as a feature vector, we should give an unique id to each primitive. The primitives get their unique ids based on the relative locations on the notation. Since some notations have some rotation varieties with 90, 180, and 270 degrees, we provide an algorithm to find relative location.
First, we extract the directions of primitives. Then the primitives with the same direction are collected and sorted according to their top left corner points. Finally, each primitive gets its unique id based on the sorted list. When all the primitives get their unique ids, we combine their directions into a direction feature vector. An example is shown in Figure 3.11; the blue number in the figure denotes the id of a primitive. The provided algorithm is stated below.
When the algorithm is finished, all the primitives have unique ids and we group
Algorithm to Find Unique Id
1. Setting variable i to 1.
2. Collecting the primitives with direction i to a temp list.
3. Sorting the temp list according to the top left corners point of primitives. 4. Giving a unique id to each primitive in the sorted temp list according to its
order in the list.
the directions of primitives according to their ids into a vector, DIR, which is considered as the second notation feature. The notation in Figure 3.10 has (1, 1, 1, 1, 3, 3) as its direction feature.
Figure 3.10 An example of the relative location of each primitive in a notation with the direction feature vector is (1, 1, 1, 1, 3, 3).
3.4.3 Length Feature
The length feature is a binary value which represents that a primitive is long or short. To extract this feature, we first find the longest primitive in a notation. Then each primitive is compared to the longest one. If the length of the primitive is larger than half of the longest one, it is considered as a long primitive; otherwise, it is a short one. The length feature is calculated by
<
=
otherwise,
2
len(j)
max
2
1
len(i)
1
)
(
i
if
jLEN
(5)where len(i) denotes the length of the ith primitive, and max len(j) denotes the length of the longest primitive in the notation.
1 4 5 2 3 6
3.4.4 Hollowness
The hollowness feature is the only feature extracted in the notation level. Hollowness means whether the shape is a solid one or not. A hollow shape has a property that there are no points near the gravity center of the shape. According to this property, we locate a rectangle with size 60% of the convex hull, and the center of the located rectangle is the same as that of the convex hull. If the number of points inside the rectangle is smaller than a threshold, the notation is considered as a hollow shape. Otherwise, the notation is not a hollow shape. Figure 3.11 shows examples of hollowness. Figure 3.11 (a) is a hollow shape, and Figure 3.11 (b) is a solid shape. The hollowness feature, H, is also a binary value and defined by
< = otherwise, 2 t P If 1 rec H (6)
where Prec denotes the number of points inside the located rectangle, and t is a threshold value.
Figure 3.11 Examples of hollowness. (a) A hollow shape. (b) A solid shape
(a) (b)
gravity center
3.5 Final Classifier
Feature vectors extracted from the operations described above, including N, DIR, LEN, and H, are taken for pattern matching at this phase.
In order to obtain the most likely notation for the input notation, we use the inverse of sum-of-absolute-difference (SAD) as the similarity measure. Let notations T and T’ be the database notation and the input notation respectively, the similarity between T and T’ is calculated by
∑
=−
=
4 1 ')
(
i i i iK
F
F
T
SAD
,)
(
1
)
(
T
SAD
T
S
=
, (7)where Fi (Fi’) denotes the ith feature vector of T (T’), and Fi∈{N, DIR, LEN, H}. Ki
denotes the number of elements in the feature vector Fi.
Due to the dimension of direction feature vector and the length feature vector are dependent on the number of primitives, we will pad zero to the smaller vector between Fi and Fi’ for computing SAD. Let * argmaxS(T)
T
=
T , the input notation is
considered to be notation T*.
3.6 MBSAS Algorithm for Database Creation
The final classifier step uses the inverse SAD to classify the notation. If we calculate SAD between the input notation and all the notations in the database which is described in Chapter 2, the processing time will be very long. Therefore, we use
MBSAS to reduce the database and get some representative feature vectors for reducing the processing time.
Modified Basic Sequential Algorithm Scheme (MBSAS) [13] is a clustering algorithm. More specifically, it is an algorithm to group the objects based on attributes. MBSAS does not need to know the number of clusters. It contains two phases. The first phase determines the number of clusters; the second phase is the pattern classification.
3.7 Post Processing
The input notation is classified in the previous steps, but we do not know where the notation should be located on. Therefore, we will do some post processing to display the notation at the correct position and size.
First, we will display the input notation using the corresponding standard UML notation at the position user drawn based on the corner points of the bounding rectangle of input notation. Then, we resize the notation to the user’s requisite size based on the size of the bounding rectangle of input notation. Finally, we will get the user desired result. Figure 3.12 shows an example of the post processing step. The left figure shows the scene before post processing and the right one shows the scene after post processing.
CHAPTER 4
EXPERIMENTAL RESULTS
In order to evaluate the recognition rate of the proposed method, we invite 20 persons, with poor experience using tablet digitizer and tablet PC, to sketch 23 supported notations about ten times for each notation. We use a tablet digitizer, Wacom Graphire4 CTE-440, and a tablet PC, HP Compaq tc4200, to collect the ink data. In the experiment, we randomly choose half of the ink data for training and the rest for testing. Table 1 shows the recognition rate of the proposed method. The first column shows that only the top one is chosen and the recognition rate is 84.62%. The second column shows that the top three ones are taken, and the recognition rate increases from 84.62% to 91.24%. We can observe that the notations belonging to the Line, Circle, and Diamond categories are classified very well.
In order to show that our proposed method has higher recognition rate than other methods, we compare our method to SkGs method [12]. In SkGs method, there are five students to participate the experiment, and each student draw 20-25 symbols of Use Case diagram. The recognition method proposed in [12] has two parts. The first part only used the Grammar based method to recognize symbol, and the second part combined the Grammar based method and the language recognizer. Our results will be compared to these two parts. In the comparison, we also invite five persons
drawing the symbols supported in SkGs method, and the recognition rate is shown in Table 2. In Table 2, we can see that the results of the proposed method are better than these two parts besides Actor. Thus, our recognition rate is superior to SkGs method.
Table 1. The recognition rate of top 1 choice and top 3 choices. (continued)
Shape Top 1 Accuracy% Top 3 Accuracy%
Activity 73(73/100) 86(86/100) Aggregation 88.78(87/98) 91.84(90/98) Activationbar 87.78(79/90) 88.89(80/90) Actor 87.78(79/90) 92.22(83/90) Branch 90.91(90/99) 100(99/99) Class 84.44(76/90) 92.22(83/90) Component 73.81(62/84) 86.9(73/84) Communication 100(98/98) 100(98/98) Dependency 81(81/100) 86(86/100) End 92(92/100) 92(92/100) Fork 89.29(75/84) 89.29(75/84) Generalize 97.96(96/98) 98.98(97/98) Initial 77(77/100) 81(81/100) Interface 78.65(70/89) 85.39(76/89) Lifeline 100(89/89) 100(89/89) Node 72.22(65/90) 86.67(78/90) Note 70.79(63/89) 91.01(81/89)
Table 1 The recognition rate of top 1 choice and top 3 choices.
Shape Top 1 Accuracy% Top 3 Accuracy%
Object 87.78(79/90) 88.89(80/90) Package 75.56(68/90) 92.22(83/90) State 71(71/100) 84(84/100) Swimlane 80.9(72/89) 91.01(81/89) Transition 94(94/100) 97(97/100) Use Case 89.89(80/89) 96.63(86/89) Total 84.62 (1816/2146) 91.24 (1958/2146)
Table 2. Comparison with SkGs method
Shape SkGs without Language Recognizer (%) SkGs with Language Recognizer (%) Proposed Method (%) Actor 76.92(10/13) 92.31(12/13) 92.31(12/13) Use Case 83.3(45/54) 90.74(49/54) 96.30(52/54) Communication 100(21/21) 100(21/21) 100(21/21) Dependency 72.73(16/22) 72.73(16/22) 95.45(21/22) Generalize 81.82(9/11) 100 (11/11) 100(11/11) Transition 88.89(8/9) 88.89(8/9) 100(9/9) Total 80.99(98/121) 91.74(111/121) 96.69(117/121)
CHAPTER 5
CONCLUSION AND FUTURE WORK
The thesis proposed an online handwritten recognition system of UML diagrams based on decision tree. First, some geometric features are extracted for classifying the input notation to the corresponding category. Then we extract several notation features in primitive level and notation level to create the feature vectors. Finally, the similarity measure based on SAD is calculated for getting the final result.
In the system, users can sketch UML diagrams using tablet computer, digital tablet, and mouse. Users can sketch any notation in any kind of order in the system. After sketching a notation, the standard notation will replace the hand-drawn one and be displayed with the correct position and size. We also support user self-definition function which allows user defining gestures representing the UML notations. Besides these characteristics, the most important property of the system is that it is relative efficient and simple to other methods mentioned above because we use decision tree and reduction database to reduce the comparison time.
Although the system provides many functions of sketching UML diagrams, it is still not enough. In the future, we will add more functions, such as forward/backward engineering, modularity, supporting the multi-layer diagrams, and supporting more UML notations to make the system become a practical tool.
REFERENCES
[1] L. H. Chen and Y. P. Yin, “A System for On-line Recognition of Handwritten Mathematical Expressions,” Computer Processing of Chinese and Oriental Languages, Vol. 6, No. 1, pp. 19-39, 1992.
[2] G. Hutton, M. Cripps, D. Elliman, and C. Higgins, “A Strategy for On-line Interpretation of Sketching Engineering Drawings,” Fourth Intl. Conf. on Document Analysis and Recognition, pp. 771-775, 1997.
[3] Z. Lin, J. He, Z. Zhong, R. Wang, and H. Shum, “Table Detection in Online Ink Notes,” IEEE Transactions on Pattern Analysis and Machine Intelligence, Vol. 28, No. 8, pp. 1341-1346, 2006.
[4] T. Kimura, A. Apte, and V. Vo, “Recognizing Multistroke Geometric Shapes: an Experimental Evaluation,” Proceedings of the ACM conference on User Interface and Software Technology (UIST’93), pp. 121-128, 1993.
[5] M. Fonseca and J. Jorge, “Using Fuzzy Logic to Recognize Geometric Shapes Interactively,” The Ninth IEEE International Conference on Fuzzy Systems, Vol. 1, pp. 291-296, 2000.
[6] UML in Wikipedia : http://en.wikipedia.org/wiki/Unified_Modeling_Language [7] Object Management Group : http://www.uml.org/
Modeling: Support for Intuition, Flexibility and Collaboration in CASE Tools,” ECOOP 2000-Object-Oriented Programming: 14th European Conference, Vol.
1850, pp. 27-43, 2000.
[9] D. Rubine, “Specifying Gestures by Example,” Proceedings of SIGGRAPH'91, pp. 329-337, 1991.
[10] E. Lank, J. Thorley, S. Chen, and D. Blostein, “On-line Recognition of UML Diagrams,” The Sixth IEEE International Conference on Document Analysis and Recognition, pp. 356-360, 2001.
[11] Q. Chen, J. Grundy, and J. Hosking, “An E-whiteboard Application to Support Early Design-Stage Sketching of UML Diagrams,” IEEE Symposium on Human Centric Computing Language and Environments, pp. 219-226, 2003.
[12] G. Costagliola, V. Deufemia, and M. Risi, “A Multi-layer Parsing Strategy for On-line Recognition of Hand-drawn Diagrams,” IEEE Symposium on Visual Languages and Human-Centric Computing (VL-HCC’06), pp. 103-110, 2006. [13] S. Theodoridis and K. Koutroumbas, Pattern Recognition, Academic Press,
2006.
[14] T. Cormen, C. Leiserson, R. Rivest, and C. Stein, Introduction to Algorithms, MIT Press, 2001.

![table detection [3] and geometric shapes [4-5]. However, the Unified Modeling](https://thumb-ap.123doks.com/thumbv2/9libinfo/7978171.158903/10.918.166.758.371.809/table-detection-geometric-shapes-unified-modeling.webp)